admitted to the Intensive Care Unit at Pinderfields General Hospital. One minute average ..... data reveals certain general relationships between ICP,. CPP, and ...
Acta Neurochir (Wien) (1994) I26:113-119
_-Acta . Ncurochlrurgn
.
9 Springer-Verlag 1994 Printed in Austria
Monitoring of Cerebrospinal Dynamics Using Continuous Analysis of Intracranial Pressure and Cerebral Perfusion Pressure in Head Injury M. Czosnyka 1, D. J. Price 2, and M. Williamson 2 1Academic Neurosurgery Unit, University of Cambridge, Addenbrooke's Hospital, Cambridge, and 2 Pinderfields General Hospital, Wakefield, West Yorkshire, U.K.
Summary Cerebrospinal dynamics has been investigated by statistical analysis of results of computerised monitoring of 80 head injured patients admitted to the Intensive Care Unit at Pinderfields General Hospital. One minute average values of intracranial pressure (ICP), systemic arterial pressure (ABP), cerebral perfusion pressure (CPP), amplitude of the fundamental component of the intracranial pressure pulse wave and the short-term moving correlation coefficient between that amplitude and mean ICP (RAP) were recorded. It was found that reduction of CPP down to 40mmHg was more often caused by decrease in ABP than increase in ICP, Further falls in CPP below 40mmHg were caused by substantial increases in ICP above 25 mmHg. The relationship between the ICP pulse wave amplitude and CPP showed a significant gradual increase in amplitude with CPP decreasing from 75 to 30 mmHg. For CPP below 30 mmHg there is a sharp decrease in amplitude followed by a change in the coefficient RAP from positive to negative values. This was interpreted as a sign of critical disturbance in cerebral circulation.
Keywords: Cerebrospinal dynamics; intracranial pressure; cerebral perfusion pressure; waveform analysis.
Introduction As yet, it is not possible to routinely and continuously monitor cerebral blood flow in neurosurgical intensive care unit. As a compromise, transcranial Doppler ultrasonography, laser Doppler flowmetry, thermal dilution flowmetry, arterio-jugular venous oxygen difference, cerebral function monitoring and cerebral near-infrared spectroscopy are aimed at continuous assessment of the equilibrium between cerebral blood flow and metabolic demands 3' 2, ~8. The importance of more traditional monitoring of intracranial pressure (ICP) and systemic arterial blood pressure (ABP) in head injured patients remains unquestionable over many years. It permits calculation of the cerebral perfusion pressure (CPP) which may be affected by sys-
temic hypotension or rising ICP. Modern, reliable and less invasive transducers reduce the risk caused by longterm ICP monitoring4. Computer signal processing has advantages over conventional chart recorders as it provides averaging and compression for trend recognition 16. It also allows various calculated parameters describing the ICP waveform to provide additional information on the cerebral dynamics8' 10, 14, 19. Over the last 20 years a number of methods of ICP waveform analysis have been developed and introduced into clinical practice. These include the analysis of frequencydependent transmission of the arterial blood pressure wave to the cerebrospinal fluid compartment 14, dependence of a pressure-volume index on the CPP level1~ and harmonic distortion of intracranial pressure pulse wave 19. All are aimed to monitor the cerebrospinal compensatory and, indirectly, auto:regulatory reserves. Our own method of continuous assessment of these reserves uses the short-term moving correlation coefficient between changes in amplitude of the fundamental harmonic of pulsatile wave and mean ICP (socalled RAP index, named after R - s y m b o l of correlation coefficient, A - amplitude, P-pressureS). The amplitude of intracranial pressure has frequently been reported 1' 7, 11, 12, 14, 19 to be affected by cerebrospinal elasticity and on the pulsatile component of cerebral blood volume. Both factors are influenced by the mechanisms controlling cerebral blood flow such as autoregulation and venous blood outflow. A linear relationship between the amplitude and ICP mean was observed and interpreted 1' 12 as a consequence of the exponential shape of the cerebrospinal pressure-volume relationship 12. Few authors have, however, noted that the mechanoetastic properties of the cerebrospinal
114
M. Czosnyka et al,: Monitoring of Cerebrospinal Dynamics
space are strongly dependent on the state of cerebrovascular system5' 10, 14. An upper breakpoint of the relationship between the amplitude and the ICP was observed and interpreted as the point above which autoregulation was exhausted as a result at reduced cerebral perfusion pressure s, 7, 8, 13. The interpretation of this breakpoint is probably the same as the "reflection point" of the pressure-volume index considered as a factor dependent on cerebral perfusion pressure proposed by Gray and Rosner 1~ An example of amplitude/ ICP curve exhibiting the upper breakpoint is demonstrated in Fig. 1. Another breakpoint of the relationship between pulse wave amplitude and mean ICP is often observed at a low ICP level below which the amplitude does not significantly depend on intracranial pressure 2~ Therefore, the theoretically linear 1 relationship between intracranial pulse amplitude and mean pressure is distorted for lower and upper ICPs u. With an advent of low-cost computing this relationship can be detected over a period of few minutes by on-line analysis as a gradient and a correlation coefficient RAP. In the 1970s, it was anticipated that repeated monitoring of this gradient would reveal changes in amplitude-pressure relationship 17. Subsequent critical analysis of this assumption proved that the correlation coefficient was a significantly better predictor of any impending intracranial hypertensive episode than the gradient itselfs' 15. Below the upper breakpoint, demonstrated in Fig. 1 a, both the gradient and the regression coefficient are positive. When ICP rises above the level of the upper breakpoint the gradient and the
25
AMP [mmHg]
I Jm~
6
7
8 [hoursl
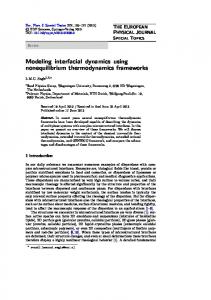
Fig. 2. Time trend of intracranial pressure (ICP) and RAP coefficient in head injured patient. Plateau wave of ICP was recorded before 6 p.m. Rise in intracranial pressure was associated with significant decrease in RAP to negative values, x-axis: time in hours
regression coefficient become negative. This concept is presented diagrammatically in Fig. 1 b. The display at the bedside of the fluctuations of RAP has enabled a better understanding of the relevance of changes in perfusion and volume buffering reserves. Not only does it provide a warning of impending intracranial hypertension but it explains the classical plateau waves when the RAP dramatically falls to negative values during periods of transient loss of autoregulation (Fig. 2). Although the value of changes in RAP has been demonstrated in individual cases s, 1l, 15 it is necessary to establish if these relationships are significant in a wider group of patients. This paper examines the interrelationship between the amplitude of ICP pulse wave, RAP, CPP, and ICP. At the same time, such a study offers an opportunity to compare the relationships between the mean values of ABP, ICP, and CPP. Material and Method
IeP ICP
B0
[mmHgl
a 0
lop
b
Fig. 1. (a) Relationship between intracranial pressure pulse wave amplitude (y-axis) and mean ICP (x-axis) detected in deep intracranial hypertension in head injured patient. (b) Schematic relationship between the amplitude and mean ICP and dependence of RAP coefficient versus mean ICP
Eighty head injured patients admitted to the ICU at Pinderfields General Hospital in a coma were analyzed. They were all ventilated, given mannitol arbitrarily at admission to the referring hospital and then transferred to the neurosurgical unit for immediate scanning and management. After removal of any haematoma or expansile contusion, ICP monitoring was carried out using a saline filled ventricular or subdural catheter connected to an external Gould P 10 EZ transducer and amplifier system with a bandwidth wider than 12Hz. Ventilation to procure pCO2 level between 4.0 and 4.5 kPa was maintained for a minimum of 24 hours and mannitol was used to control ICP below 25 mmHg. If mannitol failed, Propofol was administered to achieve partial EEO suppression. Any fall in blood pressure (ABP-monitored by transducer) was counteracted with increased fluid load and peripheral arterial vasoconstriction.
M. Czosnyka etal.: Monitoring of Cerebrospinal Dynamics
115
The continuous ICP and ABP waveforms were analysed and the results were stored using a computerized system SWM9: Amplitude of intracranial pulse wave has been evaluated every 8 seconds, using 128 point Fast Fourier Transform of the original pressure waveform sampled with the frequency of about 18 Hz. Mean ICP and ABP values were calculated within the same period as a time integral of sampled signals and stored together with last value of A M P in the circular buffer. Every one minute mean ABP, mean ICP, and m e a n pulse amplitude were calculated using simple averaging of the last 7 consecutive values from this buffer. Linear correlation coefficient (RAP) between last fifteen values of amplitude and ICP level have been calculated. The cerebral perfusion pressure has been calculated as difference between mean ABP and ICP. The average period of artifact free analysis was 26 hours and ranged from 10 hours to 4 days. The following parameters were taken for further statistical analysis: - m e a n Intracranial Pressure (ICP), - m e a n Cerebral Perfusion Pressure (CPP), - mean Arterial Blood Pressure (ABP), - amplitude of fundamental harmonic component of ICP cardiac pulse wave,
.
.
.
.
Results Histograms of CPP and ICP are presented in Fig. 3 a and b. Both histograms are non-symmetrical, they exhibit considerable skewness towards higher ICP and lower CPP pressures. ABP and CPP plotted against ICP are presented in Fig. 4 a and b; ABP and ICP versus CPP are in Fig~ 5 a and b. All these curves were evaluated CPP [mrnHg] 100
.
80 ~
Thousands of minute averages 20r .
- short-term correlation coefficient between fluctuations of ICP and first harmonic c o m p o n e n t of ICP pulse wave (RAP). The monitoring software was written at Warsaw University of Technology, Poland and introduced to clinical practice at Pinderfields General Hospital, Wakefield, U.K. in 1988.
.
.
.
.
.
.
.
.
.
.
.
.
.
.
.
.
60 15 40
......
i
. . . .
tO
20
Ic A 10 0
20
B 30
40
50
60
70
80
a
lCP[mmHg] 2
12
22
32
42
52
62
72
ICP [mmHg]
;3
Thousands of minute averages 10 [ . . . . . . .
ABP [mmHg] t20
100
60
40 t . . . . . 20 . . . . i. . . . .
A 0L
0
10
20
B 30
40
50
t 60
C
""" 70
80
ICP[mmHg] 0
17
27
37
47
57
67
CPP [mmHg]
77
87
97
107 b
Fig. 3. Distribution of' m e a n level of ICP (a) and CPP (b) in group of 80 head injured patients (total n u m b e r of one minute averages was 122595)
Fig. 4. Empiric regression curves. Outer thinner lines show 95% confidence limits for middle (thick) line interpolating average points of dependent variables, calculated for different ranges (3 m m H g wide) of the pressures presented along the horizontal axes. (a) Cerebral perfusion pressure versus ICP. (b) Systemic arterial blood pressure versus ICP
M. Czosnyka et al.: Monitoring of Cerebrospinal Dynamics
116
Table 1. Mean Values and Standard Deviations o f Analysed Parameters in Group of 80 Head Injured Patients
ICP [mmHg] 60
50 40
ICP (mmHg) ABP (mmHg) CPP (mmHg) Pulse wave amplitude AMP (mmHg) RAP
30 20
Mean
Standard deviation
18.1l 89.1 70.9 3.69 0.51
10.87 14,1 17.9 3.12 0.42
10
25
15
35
45
55
65
75
85
95 a
CPP [mmHgl ABP [mmHg]
120
.
.
.
.
.
.
.
.
.
.
.
.
.
.
.
.
100 80 60
40 2O 0 15
25
35
45
55
65
75
CPP [mmHg]
85
95
b
Fig. 5. (a) ICP versus CPP, (b) ABP versus CPP
as empiric regressions, i.e., the conditional average of dependent variable (these values of dependent variable were averaged for which the independent variable was included within a certain narrow range) was plotted against the independent variable. Sample numbers given for averaging in subsequent ranges of 1CP and CPP are different and can be assessed from distributions of CPP and ICP shown in Fig. 3. A 95% confidence limits for mean were represented by thinner lines around thick average curve for each relationship. The CPP versus ICP regression curve (Fig. 4 a) has three sub-ranges delimited by vertical lines A, B, and C: (i) when ICP is below 25mmHg, CPP decreases with rising ICP (gradient - 1.1l; r - - - 0.89; p < 0.0001); (ii) with ICP increasing within the range from 25 to 50 mmHg, CPP still decreases but slower. Mean CPP
is 60 mmHg within this range of ICP with standard deviation 12mmHg, CPP/ICP gradient - 0 . 2 5 ; with correlation coefficient r = - 0.74 (p < 0.001); (iii) further increase in ICP above 50 mmHg provokes a decrease in CPP and then for ICP above 60 mmHg a sharp fall in CPP to almost 0 mmHg. The relationship of ABP versus ICP (Fig. 4 b) exhibits three identical sub-ranges: (i) when ICP is less than 25 mmHg, ABP is stable (mean 90 mmHg); (ii) for ICP rising from 25 to 50mmHg ABP is increasing (gradient 0.66; r = 0.72; p < 0.001); (iii) for ICP higher than 50 mmHg ABP reaches maximum and then starts to decrease significantly for ICP higher than 60 mmHg. The relationship between ICP and CPP (Fig. 5 a) has bi-linear characteristic: (i) when CPP is higher than 35 rnmHg ICP increases linearly with decreasing CPP (gradient - 0 . 2 3 ; r = - 0.95; p < 0.0001); (ii) for CPP decreasing below 35 mmHg ICP starts to increase steeper (gradient 1.35; r = 0.86; p < 0.001). The regression of ABP versus CPP (Fig. 5 b) exhibits similar bi-phasic shape: (i) when CPP is higher than 30 mmHg, ABP decreases with falling CPP (gradient 1.02; r = 0.98; p < 0.0001); (ii) decrease in CPP below 30 mmHg provokes increase in ABP. The relationships of pulse wave', amplitude (AMP) versus CPP and RAP versus CPP are presented in Fig. 6 a and b, respectively. Pulse amplitude versus CPP curve exhibits four ranges: (i) non-significant variations in amplitude when CPP is higher than 75 mmHg; (ii) slow increase in amplitude when CPP is decreasing down to 45mmHg (gradient - 0.04; r = - 0.71; p < 0.01);
M. Czosnyka et al.: Monitoring of Cerebrospinal Dynamics
117
(iii) rapid increase in amplitude when CPP is decreasing from 45 to 30mmHg (gradient - 0 . 4 6 ; r = - 0.85; p < 0.001); (iv) sharp decrease in amplitude for CPP decreasing further below 30mmHg (gradient 0.33; r = 0.92; p < 0.01). The relationship between RAP coefficient and CPP is presented on Fig. 6 b. A sharp decrease in RAP from positive to negative was noticed for CPP decreasing from 35 to 25mmHg (p < 0.0001). The relationship between pulse wave amplitude and mean ICP can be divided to three ranges (Fig. 7 a): (i) slow increase in amplitude with ICP increasing to about 50mmHg (gradient 0.1; r = 0.68; p < 0.01); (ii) rapid increase of amplitude when ICP increases further to about 65mmHg (gradient 0.5; r--0.84; p < 0.005);
AMP [mmHg]
111f12.9 . . . ~-. . . . . . . .
if 0
.
.
.
.
.
.
.
20
30
40
50
60
70
80
ICP[mmHg]
a
RAP 1
AMP [mmHg] 12~ . . .
10
.
.
.
.
.
.
.
.
.
.
.
.
.
.
.
.
.
.
.
. 0.5
10
0
15
25
35
45
55
65
75
85
95
CPP [mmHgl
0
10
20
30
40 ICP[ramHgt
a
50
60
70
80 b
Fig. 7. (a) Amplitude of the fundamental component of intracranial pressure versus mean ICP. (b) R A P versus ICP
AMP [mmHg] 0.8
0.6
(iii) sharp decrease in amplitude for ICP higher than 65mmHg (gradient - 1; r -- - 0.87; p < 0.001). The relationship between RAP and ICP is presented in Fig. 7 b. The significant decrease in RAP from positive to negative values was observed for increase in ICP from 45 to 70mmHg (p < 0.01).
0.4l 0.2 0 -0.2 -0,4 15
J 25
Discussion 35
45
55
65
CPP [mmHg]
75
85
95
b
Fig. 6. (a) Amplitude of the fundamental c o m p o n e n t of intracranial pressure pulse wave (AMP) versus CPP. (b) Short term correlation coefficient between amplitude of the fundamental component of pulse wave and mean intracranial pressure (RAP) versus CPP
The statistical analysis of such a large amount of data reveals certain general relationships between ICP, CPP, and pulse wave amplitude of intracranial pressure. Gradual increase in the amplitude with ICP increasing to 45 mmHg (Fig. 7 a) or CPP decreasing from the
l 18 higher levels (70-80mmHg) down to 55mmHg (Fig. 6 a) is often interpreted by exponential cerebrospinal pressure-volume relationship 1' 12. Cardiac-related pulsatile changes in cerebral blood volume are supposed to produce the higher pressure responses due to increase in the gradient of pressure-volume curve with increasing ICP. However, an alternative explanation for this phenomenon may be suggested: As the compliance of the cerebral arterial bed increases with the reduction of CPP, the transmission of arterial pressure pulse wave to cerebrospinal fluid compartment may increase 14. The subsequent acceleration of the rate of increase in the amplitude within the low CPP range from 50 to 30 mmHg (see Fig. 6 a) may be produced by an increase in the pulsatile component of cerebral blood flow around the critical limit for cerebral perfusion7. The same phenomenon can be presumably observed using transcranial Doppler flow velocimetry as the gradual increase in pulsatility index with the reduction of CPP below 60-70 mmHg 3' 5, 13 RAP considered as a function of CPP exhibits good sensitivity for the dynamic detection of critical ICP and CPP limits statistically (Figs. 6 b and 7 b) and in individual cases (Fig. 2) when decreases from significantly positive to negative values. The evaluated relationships between ICP, ABP, and CPP (Figs. 4 and 5) show that moderate decreases in CPP (for CPP greater than 40 mmHg) depends stronger on decreases in ABP (where the gradient of the regression line is close to 1) than on increases in ICP (gradient is - 0.23). Therefore, falls in CPP down to 40 mmHg are statistically more often caused by decreases in ABP than by increases in ICP. However, for terminally low CPP (below 40 mmHg - Fig. 5 b) an increase in ABP, presumably caused by activation of the Cushing response, can be noticed. ICP also increases sharply for CPP less than 40 mmHg (Fig. 5 a), suggesting that intracranial hypertension is usually responsible for the decreases in CPP below 40 mmHg. A gradual increase in ABP is observed with ICP increasing above 25 mmHg (Fig. 4 b). This compensates for the increase in ICP, producing plateau of CPP at 60 mmHg (Fig. 4 a). This compensatory response is exhausted for ICP above 55 mmHg. For ICP increasing above 65 mmHg the mechanisms responsible for stabilization of cerebral perfusion are finally exhausted and CPP falls below 30 mmHg (Fig. 5 a). This situation is often observed in brainstem conning as a sudden fall of systemic blood pressure, triggered by ischaemic damage of vasomotor control centre. It is remarkable that
M. Czosnykaet al.: Monitoringof Cerebrospinal Dynamics the amplitude of ICP pulse wave starts to decrease and RAP falls sharply from positive to negative values (Fig. 6) below the same level of CPP (30 mmHg). Therefore, the upper breakpoint of amplitude/pressure curve can be interpreted as the limit of terminal exhaustion of cerebral perfusion reserve 5' 8, 11, 15 The statistically documented behaviour of the continuously monitored ICP, ABP, CPP, pulse amplitude of ICP and RAP in head-injured patients justifies the following classification of the cerebrospinal dynamics on the basis of amplitude of ICP pulse wave, RAP coefficient, mean ICP, and mean CPP: State 1: RAP does not differ significantly from 0 and the amplitude of the pulse wave does not increase with increasing ICP. This state may be interpreted as the good cerebrospinal compensatory and cerebral perfusion reserves: variations in CPP does not affect cerebral circulation, fluctuations of cerebrospinal fluid volume do not provoke rapid rise in the ICP pulse wave. On average ICP is lower than 20 mmHg and CPP higher than 75 mmHg in this state. State 2." The RAP is significantly positive and ICP pulse amplitude is gradually increasing with decreasing CPP. In this state the cerebrospinal compensatory reserve is severely reduced. Further increases in ICP usually provoke an increase in ABP. Average ICP ranges from 20 to 50 mmHg and CPP from 50 to 75 mmHg. State 3: RAP is close to + 1, pulse amplitude rises rapidly with decreasing CPP. This is the state of nearly exhausted cerebral perfusion reserve. Increase in blood flow pulsations, reported in 3' 5, 13 is transmitted to ICP pulse waveform and is responsible for its fast rise. Average ICP ranges from 50 to 65 mmHg, CPP from 30 to 50 mmHg. S t a t e 4: Pulse amplitude of ICP starts to fall and RAP switches to significantly negative values. In this state cerebral perfusion is deeply reduced, any further decrease in CPP usually produces ischaemic brain damage. On average ICP is higher than 65 mmHg and CPP lower than 30 mmHg. The frequency of detecting of the listed states in our material was: State 1: 62.8%, State 2: 25.5%, State 3: 8.9%, State 4: 2.8% (as the percentage of the total number of observations). Finally it should be reiterated that statistical analysis of the presented clinical materials does not entitle the introduction of fixed ranges of ICP and CPP in the assessment of the state of cerebrospinal dynamics in
M. Czosnyka eta[.: Monitoring of Cerebrospinal Dynamics
119
i n d i v i d u a l cases. The pressure limits m a y differ considerably from case to case, m o r e o v e r they can fluctuate with time. C o n t i n u o u s m o n i t o r i n g of the d y n a m i c re-
8.
lationships between the pulse wave a m p l i t u d e of I C P a n d pressure levels can b r i n g precise i n f o r m a t i o n o n the state o f c o m p e n s a t o r y a n d a u t o r e g u l a t o r y reserves.
9.
Conclusion 10. C o m p u t e r i z e d analysis of I C P a n d C P P waveforms provides i m p o r t a n t i n f o r m a t i o n o n cerebrospinal comp e n s a t o r y a n d a u t o r e g u l a t o r y reserves. Specific states of m e c h a n i s m s c o n t r o l l i n g cerebral b l o o d flow circulation a n d cerebrospinal pressure-volume c o m p e n s a -
11.
tion c a n be m o n i t o r e d using the p a r a m e t e r describing the relationship between changes of pulse wave amplitude a n d I C P (RAP). This index, calculated using spectral analysis of I C P pulse w a v e f o r m taking only first h a r m o n i c c o m p o n e n t , is f o r t u n a t e l y i n d e p e n d e n t
12.
o f a n y b a n d w i d t h l i m i t a t i o n o f m o s t of pressure m o n itoring systems. The t e r m i n a l stage of i n t r a c r a n i a l hy-
13.
p e r t e n s i o n causing deep, h a e m o d y n a m i c a l l y relevant decreases in C P P can be detected as sharp fall of R A P from positive to negative values a n d decrease in pulse wave a m p l i t u d e of ICP.
14.
15.
References 1. Avezaat CJJ, Eijndhoven JHM van (1986) Clinical observations on the relationship between cerebrospinal fluid pulse pressure and intracraniaI pressure. Acta Neurochir (Wien) 79:13-29 2. Chan KH, Dearden NM, Andrews PJD, etal (1993) Multimodality monitoring as a guide to treatment of intracranial hypertension after severe brain injury. Neurosurgery 35:547-553 3. Chan KH, Miller JD, Dearden NM, etal (1992) The effects of changes in cerebral perfusion pressure upon middle cerebral artery blood flow velocity and jugular bulb venous oxygen saturation after severe brain injury. J Neurosurg 77:55-61 4. Clark WC, Muhlbauer MS, Lowrey R, etal (1989) Complications of intracranial pressure monitoring in trauma patients. Neurosurgery 25:20-24 5. Czosnyka M, Guazzo E, Iyer V, etal (1994) Testing of cerebral autoregulation in head injury by waveform analysis of blood flow velocity and cerebral perfusion pressure. Acta Neurochir (Wien) [Suppl] 60:468-471 6. Czosnyka M, Harris NG, Pickard JD, Piechnik S (1993) CO2 cerebrovascular reactivity as a function of perfusion pressure a modelling study. Acta Neurochir (Wien) 121:159-165 7. Czosnyka M, Koszewski W, Laniewski P, etal (1993) The dynamics of cerebral blood flow, perfusion pressure and CSF circulation - a modelling study. In: Avezaat CJJ, van Eijndhoven
16.
17.
JHM, Maas AIR, Taus JTJ (ed) Intracranial pressure VIII. Springer, Berlin Heidelberg New York Tokyo, pp 699-706 Czosnyka M, Wollk-Laniewski P, Batorski L, etal (1989) Remarks on amplitude-pressure characteristic phenomenon. In: Hoff JT, Betz AL (eds) ICP VII. Springer, Berlin Heidelberg, pp 255-259 Czosnyka M, Wollk-Laniewski P, Darwaj P, etal (1987) Software for neurosurgery intensive care. In: HoffJT, Betz AL (eds) ICP VIII. Springer, Berlin Heidelberg New York Tokyo, pp 8487 Gray WJ, Rosner MJ (1987)Pressure-volumeindex as a function of cerebral perfusion pressure. Part 2: the effects of low cerebral perfusion pressure and autoregulation. J Neurosurg 67: 377380 LaniewskiP, Czosnyka M, MaksymowiczW (1993) Continuous analysis of the intracranial pressure waveform as a method of assessment of autoregulatory reserve. In: Avezaat CJJ, van Eijndhoven JHM, Maas AIR, Taus JTJ (ed) Intracranial pressure VIII. Springer, Berlin Heidelberg New York Tokyo, pp 376-38t Marmarou A, Shulman K, Rosende R (1978) A non linear analysis of the cerebrospinal fluid system and intraeranial pressure dynamics. J Neurosurg 48:332-344 Nelson RJ, Czosnyka M, Pickard JD, etal(1992) Experimental aspects of cerebrospinal hemodynamics: the relationship between blood flow velocity waveform and cerebral autoregulation. Neurosurgery 31:705-710 Piper I, Miller JD, Dearden M, etal (1990) System analysis of cerebrovascular pressure transmission: an observational study in head injured patients. J Neurosurg 73:871-880 Price DJ, Czosnyka M, Williamson M (1993) Attempts to continuously monitor autoregalation and compensatory reserve in severe head injuries. In: Avezaat CJJ, van Eijndhoven 3HM, Maas AIR, Taus JTJ (ed) Intracranial pressure VIII. Springer, Berlin Heidelberg New York Tokyo, pp 61-66 Price DJ, Driscoll P (1986) The problems of averaging ICP records by eye. In: Miller JD, Teasdale GM, Rowan JO, et al (eds) Intracranial pressure VI. Springer, Berlin Heidelberg New York Tokyo, pp 705-712 Price DJ, Mason J (1984) An attempt to automate control of cerebral edema. In: Go KG, Baethmann A (eds) Recent progress in the study and therapy of brain edema. Plenum, New York, pp 597-607
18. Robertson CS, Nara yan RK, Gokaslan ZL, et al (1989 ) Cerebral arteriovenous oxygen difference as an estimate of cerebral of blood flow in comatose patients. J Neurosurg 70:222-230 19. Robertson CS, Narayan RK, Contant CF, etal (1989) Clinical experience with a continuous monitor of intracranial compliance. J Neurosurg 71:673 680 20. SzewczykowskiJ, Dytko P, Kunicki A, etal (1976) Method of estimating intracranial decompensation in man. J Neurosurg 45: 155 Correspondence: Marek Czosnyka, M.D., Academic Neurosurgery Unit, Addenbrooke's Hospital, P.O. Box 167,Hills Road, Cambridge CB2 2QQ, U.K,