cells grown on standard minimal or complex media. Characteristic DNA patterns ... important platform organisms in industrial biotechnology. (Eggeling and Bott ...
bs_bs_banner
Monitoring of population dynamics of Corynebacterium glutamicum by multiparameter flow cytometry Andrea Neumeyer,1 Thomas Hübschmann,2 Susann Müller2 and Julia Frunzke1 1 Institute of Bio- and Geosciences, IBG-1: Biotechnology, Forschungszentrum Jülich, 52425 Jülich, Germany. 2 Department for Environmental Microbiology, Helmholtz-Centre for Environmental Research – UFZ, Permoserstr. 15, 04318 Leipzig, Germany. Summary Phenotypic variation of microbial populations is a well-known phenomenon and may have significant impact on the success of industrial bioprocesses. Flow cytometry (FC) and the large repertoire of fluorescent dyes bring the high-throughput analysis of multiple parameters in single bacterial cells into reach. In this study, we evaluated a set of different fluorescent dyes for suitability in FC single cell analysis of the biotechnological platform organism Corynebacterium glutamicum. Already simple scattering properties of C. glutamicum cells in the flow cytometer were shown to provide valuable information on the growth activity of analysed cells. Furthermore, we used DAPI staining for a FC-based determination of the DNA content of C. glutamicum cells grown on standard minimal or complex media. Characteristic DNA patterns were observed mirroring the typical uncoupled DNA synthesis in the logarithmic (log) growth phase and are in agreement with a symmetric type of cell division of C. glutamicum. Application of the fluorescent dyes Syto 9, propidium iodide, and DiOC2(3) allowed the identification of subpopulations with reduced viability and membrane potential within early log and stationary phase populations. The presented data highlight the potential of FC-based analyses for online monitoring of C. glutamicum bioprocesses and provide a first reference for future applications and protocols.
Received 6 September, 2012; revised 31 October, 2012; accepted 3 November, 2012. *For correspondence. E-mail j.frunzke@fz-juelich. de; Tel. (+49) 2461 61 5430; Fax (+49) 2461 61 2710. doi:10.1111/1751-7915.12018 Funding Information This work was supported by a Young Investigator grant of the Helmholtz Association (Grant VH-NG-716 to J. F.).
Introduction It is a well-known fact that even isogenic microbial populations often exhibit significant variability at the single cell level, which consequently may impact the productivity and the economic success of a whole bioprocess (Lidstrom and Konopka, 2010). Conventional approaches for the analytical monitoring of biotechnological processes are, however, still dominated by bulk measurements providing average data for cellular fitness, productivity or physical parameters. Consequently, there is a lack in receiving statistically valid information about the complex phenotypic structure within populations of industrial microorganisms (Nebe-von-Caron et al., 2000; Müller and Nebe-vonCaron, 2010; da Silva et al., 2012). In this context, flow cytometry (FC) represents a high resolution technique to assess phenotypic patterns of microbial populations and paves the way for novel highthroughput screening approaches in microbial strain development (Dietrich et al., 2010; Tracy et al., 2010). Based on the principle of hydrodynamic focusing, cells in a flow cytometer are transported in a fluid stream in a pearl chain-like arrangement. At the laser intercept cells passing the laser beam are analysed on the basis of their scattering (forward scatter, FSC, and side scatter, SSC) and fluorescence properties (dyes, natural fluorescence or recombinant proteins). Previous studies revealed that even simple parameters as the cell size, granularity or DNA content give already valuable insights into the metabolic status and the fitness of the whole population (Erlebach et al., 2000; Hewitt and Nebe-von-Caron, 2004; Müller, 2007). Membrane potential (MP) and integrity are further parameters, which can be analysed by the use of specific fluorescent dyes and do provide important information regarding the cellular stress response and viability parameters, which were shown in several studies to significantly correlate with productivity and economic efficiency of the bioprocess (Hewitt et al., 1999; David et al., 2011). When equipped with a cell sorting capability for separation of single bacterial cells, FC analyses can be complemented with further downstream investigations, such as microscopy, cultivation in liquid or on agar plates, or even Omics-based technologies (Bernas et al., 2006; Wiacek et al., 2006; Jehmlich et al., 2010). The small cell size (1/1000 of the volume of a mammalian cell) and huge diversity with respect to cell wall composition and metabolism challenges FC approaches in the
© 2012 The Authors. Microbial Biotechnology published by Blackwell Publishing Ltd and Society for Applied Microbiology. This is an open access article under the terms of the Creative Commons Attribution License, which permits use, distribution and reproduction in any medium, provided the original work is properly cited.
158 A. Neumeyer, T. Hübschmann, S. Müller and J. Frunzke field of microbiology and affects measurement quality (Shapiro and Nebe-von-Caron, 2004; Müller and Nebevon-Caron, 2010). Nowadays, a variety of fluorescent dyes is available to assess different phenotypic parameters, such as growth, MP or integrity. The majority of current protocols was, however, established and verified for only a small number of model species (Shapiro and Nebe-von-Caron, 2004). To end up with detailed and meaningful insights into the phenotypic structure of a species of interest, suitability of fluorescent dyes and staining protocols have to be adapted and optimized for every single bacterial species to be studied (Vives-Rego et al., 2000; Müller and Nebe-von-Caron, 2010). Besides species like Escherichia coli or Saccharomyces cerevisiae, the Gram-positive soil bacterium Corynebacterium glutamicum represents one of the most important platform organisms in industrial biotechnology (Eggeling and Bott, 2005; Burkovski, 2008). Currently, C. glutamicum is used for the industrial production of more than 3 million tons of amino acids per year, mainly L-glutamate and L-lysine. Only few studies have yet applied single cell approaches for strain development or for the analysis of phenotypic variation of C. glutamicum populations (Frunzke et al., 2008; Binder et al., 2012; Grünberger et al., 2012; Mustafi et al., 2012). A study of our lab could show that even under standard cultivation conditions wild type populations of the strain C. glutamicum ATCC 13032 exhibit significant variation with respect to the activity of the large prophage CGP3 (Frunzke et al., 2008). FC was first used in two very recent studies for the development of biosensor-based high-throughput screening approaches for the isolation of metabolite producing mutants (Binder et al., 2012; Mustafi et al., 2012). In these studies the intracellular amino acid levels were monitored in single cells by using transcriptional regulators as natural sensor devices to turn on expression of a fluorescent protein in response to the internal amino acid concentration. In this work, we used FC and cell sorting to analyse population dynamics of C. glutamicum with respect to cell size, granularity and DNA content at single cell resolution. Fluorescent dyes and staining protocols were established to assess membrane integrity and potential. Altogether, these data represent a first comprehensive insight into the phenotypic distribution of C. glutamicum populations and, thus, provide an important reference for future applications of FC as powerful tool for process monitoring and highthroughput screening for this important model organism. Results and discussion Size distribution of C. glutamicum wild type cells Cells passing the laser beam in the flow chamber of a cytometer can be characterized on the basis of their scat-
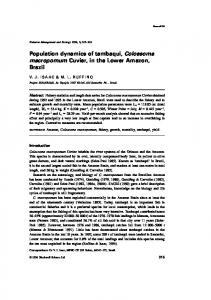
Fig. 1. Growth of C. glutamicum ATCC 13032 on (A) CGXII minimal medium with 4% glucose and (B) BHI complex medium in a 50 ml shaking flask culture at 30°C and 120 r.p.m.
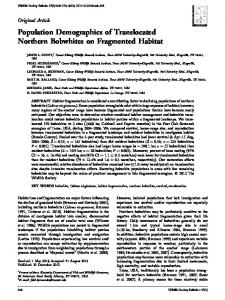
tering properties. It is a general assumption that the light scattering axial to the laser beam, so-called FSC, can be correlated with the size of a cell, whereas light scattering perpendicular to the laser beam (SSC) is indicative for the internal complexity or granularity of a cell (Müller and Nebe-von-Caron, 2010). In the case of C. glutamicum ATCC 13032, we observed a characteristic FSC distribution during growth in CGXII minimal medium containing 4% glucose as carbon source (Fig. 1). Cells of the early logarithmic (log) or stationary phase exhibited the smallest FSC signal. This signal significantly increased during the mid-log phase and reached a maximum approximately 5.5 h after inoculation (Fig. 2A). Microscopic analysis confirmed these findings demonstrating a difference in cell size of log phase cells (5.5 h: 2.58 mm ⫾ 0.31) and stationary cells (24 h: 1.66 mm ⫾ 0.31) (Fig. 2B). In Fig. 2C the FSC versus SSC distribution is shown as contour plots highlighting the formation of a second subpopulation in log phase populations. In order to verify whether the highFSC/SSC subpopulation in fact represents cells in a proliferating state we used DAPI (4′,6-diamidino-2′phenylindole) staining to correlate scattering properties
© 2012 The Authors. Microbial Biotechnology published by Blackwell Publishing Ltd and Society for Applied Microbiology, Microbial Biotechnology, 6, 157–167
Population dynamics of Corynebacterium glutamicum
159
Fig. 2. Size distribution of C. glutamicum cells during growth on CGXII minimal medium. A. Mean in forward scatter (FSC). Bars represent the mean ⫾ SD of three independent biological replicates. The asterisks depict significant differences between different time points (*P ⱕ 0.05, **P ⱕ 0.01). B. Microscopic analysis of C. glutamicum cells of the exponential (5.5 h after inoculation) and stationary growth phase (24 h). C. Contour plots of C. glutamicum cells (FSC versus SSC).
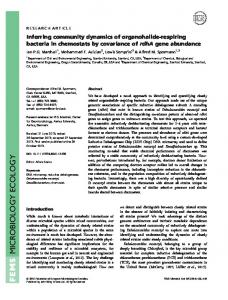
with the DNA content of the respective populations. The fluorescent dye DAPI is routinely used for DNA quantification of bacterial and eukaryotic cells and binds to A/Trich regions of DNA resulting in a bright and stable fluorescence signal. Due to its low emission maximum (463 nm) DAPI can also nicely be combined with other stains. As expected, cells with a low-FSC signal (P1) also showed a lower DAPI fluorescence than high-FSC cells (P2) (Fig. 3). When interpreting cell size distributions, the unique and multilayered cell wall structure of C. glutamicum has to be considered (Eggeling et al., 2008). A characteristic feature of the group of mycolata, including the genera Corynebacterium, Mycobacterium and Nocardia, is the formation of so-called V-shaped cells caused by a snapping cell division (see arrows in Fig. 2B). The cell wall of the mycolata is surrounded by a lipid-rich envelope, regarded as outer membrane and permeability barrier. After cell
Fig. 3. Correlation between cell size (FSC signal) and DAPI fluorescence. Gated populations (P1 and P2) are shown as dot plots: Cell size (FSC) against granularity (SSC) and FSC against DAPI fluorescence.
© 2012 The Authors. Microbial Biotechnology published by Blackwell Publishing Ltd and Society for Applied Microbiology, Microbial Biotechnology, 6, 157–167
160 A. Neumeyer, T. Hübschmann, S. Müller and J. Frunzke division, the daughter cells remain together and form a characteristic V-shape (Thanky et al., 2007; Letek et al., 2008). These cell cluster and aggregates most likely also contribute to the observed increase in FSC and DAPI signals in log phase populations where V-cells mainly occur (Fig. 2). Heterogeneity with respect to cell size distribution was also described in previous microscopy-based studies of C. glutamicum (Gayen and Venkatesh, 2008; Grünberger et al., 2012). In the study of Gayen and Venkatesh the authors reported a difference in the dividing properties of small and large cells of this species. Cells with a surface area greater than 1.6 mm2 were categorized as maximally dividing cells; smaller cells exhibited significantly reduced proliferation capacity. A correlation between cell size and growth phase was also observed in a picolitre bioreactor microfluidic device were cells of C. glutamicum showed a size of ⱖ 1.3 mm during exponential growth and a size of < 1.3 mm under carbon source limiting conditions (Gayen and Venkatesh, 2008; Grünberger et al., 2012). In general, reduction in cell size (in FSC signal, respectively) under carbon source limiting or stressful conditions has been described for various species (Erlebach et al., 2000; Hewitt and Nebe-von-Caron, 2004; Müller and Lösche, 2004; Díaz et al., 2010). For example, a significant decline in FSC values was reported for S. cerevisiae alcoholic fermentations, which was in fact associated with a reduction of actively proliferating yeast cells (Díaz et al., 2010). Furthermore, bacteria typically show a clear correlation between cell size and chromosome equivalents in the proliferation phase (Müller et al., 2010) – a fact which is also supported by the present study for C. glutamicum (Fig. 3). Thus, the measurement of the FSC and SSC distributions of cells in a bioreactor already provides valuable and easy accessible information on the overall fitness and metabolic activity of the bacterial culture. DNA pattern of C. glutamicum In several recent studies the analysis of the DNA pattern of microbial populations has been proven as excellent tool for the determination of proliferation and cell cycle activities of microorganisms (Müller, 2007). In this study, we used DAPI staining to record the DNA pattern of C. glutamicum grown on CGXII minimal medium or BHI (brain heart infusion) complex medium in shake flasks. Samples were taken as indicated, DAPI stained and analysed in a flow cytometer equipped with a 355 nm solid state laser (see Experimental procedures). The strain C. glutamicum ATCC 13032 is known to contain one circular chromosome (Kalinowski et al., 2003). Since an absolute quantification of chromosome copy numbers requires more elaborated measurements, the first peak in a DAPI histogram is typically regarded as benchmark
population Cn, where C stands for chromosome equivalent and n for the number thereof. Figure 4B shows the characteristic medium-dependent pattern that was observed for C. glutamicum cells grown on minimal or complex medium. Cells cultured in CGXII minimal medium typically showed two distinct peaks (Cn and C2n) in DAPI fluorescence at the early log phase, 1 h after inoculation into fresh medium. In the mid log phase, where C. glutamicum typically exhibits maximal growth rates, uncoupled DNA synthesis was observed as indicated by the shift of the population towards > C2n chromosome equivalents. In the late log phase a backshift occurred and cells arrested within distinct CXn peaks in the stationary phase. On complex medium a similar tendency was observed, however, in comparison to minimal medium the distribution of DAPI peaks shifted towards higher CXn equivalents suggesting the occurrence of cells containing elevated numbers of chromosomes (Fig. 4B). This finding is in line with even better growth conditions on BHI medium resulting in higher growth rates of C. glutamicum (m ~ 0.6-h) compared with CGXII minimal medium (m ~ 0.4-h). In the stationary phase, again, the formation of distinct CXn peaks was detected with a maximum of chromosome equivalents of about C16n (versus max. C4n in CGXII). The formation of distinct peaks within the late log and stationary phase can be explained due to the fact that bacteria finish replication (C-phase), but do not continue throughout cell division (D-phase) (Fig. 4A). Thus, our data reveal that C. glutamicum arrests in a pre-division (pre-D) phase when growth conditions become limiting. The occurrence of a pre-D phase under substrate limiting conditions has already been reported for several species, such as Rhodococcus erythropolis or Acinetobacter species, and was furthermore shown to readily pass over into cell division phase when growth conditions improve (Goodfellow et al., 1998; Müller et al., 2002). This is in agreement with the immediate entrance into D-phase when C. glutamicum stationary cultures were inoculated into fresh medium (see Fig. 4D, 1 h versus 48 h). Remarkably, previous studies revealed that occurrence of the pre-D phase is in fact a species-specific characteristic (Müller, 2007). The analysis of DNA patterns furthermore supports a symmetrical cell division of C. glutamicum, typical for rod-shaped species. We identified distinct peaks in the histogram corresponding to Cn (119), C2n (237), C4n (416), C8n (763), C16n (1454) etc. (Fig. 4) (Müller, 2007). However, we also observed minor peaks of odd numbers of chromosome equivalents, which is in fact indicative for a small fraction of asymmetrically dividing cells. Altogether, these data highlight the value of DNA pattern analysis as rapid online-compatible tool for process monitoring and provide a first reference for C. glutamicum in standard minimal and complex media.
© 2012 The Authors. Microbial Biotechnology published by Blackwell Publishing Ltd and Society for Applied Microbiology, Microbial Biotechnology, 6, 157–167
Population dynamics of Corynebacterium glutamicum
161
Fig. 4. DNA patterns of C. glutamicum cells grown on minimal or complex medium. A. Schematic overview on the uncoupled cell cycle of bacteria (adapted from Müller et al., 2010). Within the B-phase cells increase their biomass before they are able to enter the C-phase. The duration of the B-phase depends on the environmental conditions. In the C-phase the DNA is replicated and chromosomes are segregated to the cell poles. The duration of the C-phase is species-dependent. When growth conditions are limiting, some species may remain in a so-called pre-D. The D-phase represents the phase of actual cell division. B. DNA patterns of C. glutamicum cells of the early logarithmic (log), log and stationary phase. Cells were cultured in CGXII minimal medium with 4% glucose or in BHI complex medium. After sampling, cells were fixed with 10% sodium azide (in PBS) and stained with DAPI (see Experimental procedures). C. Detailed view on DAPI histogram of stationary phase C. glutamicum cells (pre-D phase) grown on BHI complex medium. Indicated peaks correspond to different numbers of chromosome equivalents (Cn). D. Time-course measurements of C. glutamicum cells during growth on CGXII minimal medium with 4% glucose.
Analysis of DNA patterns for the estimation of growth and activity states may also serve as a convenient alternative in turbid (e.g. CaCO3-buffered) production media which hamper the measurement of biomass as optical density or cell dry weight. FC-based measurement of the membrane potential The MP plays an important role in the physiology of bacteria as it is intimately involved in the generation of ATP
and has been implicated in bacterial autolysis, glucose transport, chemotaxis or bacterial survival at low pH. Therefore, the MP is a further adequate parameter to evaluate the cellular activity and metabolic state of a microbial population. Here, we used the carbocyanine dye 3,3′-diethyloxacarbocyanine iodide (DiOC2(3)) that exhibits a green fluorescence in all bacteria and shifts towards red emission due to self-association of dye molecules in dependency of the MP (high MP → increased red fluorescence) (Novo et al., 1999; 2000).
© 2012 The Authors. Microbial Biotechnology published by Blackwell Publishing Ltd and Society for Applied Microbiology, Microbial Biotechnology, 6, 157–167
162 A. Neumeyer, T. Hübschmann, S. Müller and J. Frunzke
Fig. 5. Determination of the MP of C. glutamicum cells. A. Control experiment ⫾ 50 mM CCCP. B. Control experiments ⫾ 5 mM valinomycin and different external potassium concentrations. C. Percentage of cells with a high or low MP. High and low MP were defined by the gating of the ⫾ CCCP control shown in D. Bars represent the mean ⫾ SD of three independent experiments. D. Representative dot plots of C. glutamicum cells of different growth phases (green DiOC2(3) fluorescence against the red DiOC2(3) fluorescence).
In a first set of experiments we verified suitability of DiOC2(3) for measurements in C. glutamicum. As a control, C. glutamicum cells were incubated with the uncoupler carbonyl cyanide m-chlorophenylhydrazone (CCCP), an inhibitor of oxidative phosphorylation, to a final concentration of 50 mM. CCCP-treated cells showed a considerable decrease in the red/green ratio of DiOC2(3) fluorescence indicative for a collapsed MP (Fig. 5A). For further validation we used the potassium ionophore valinomycin, which facilitates transport of potassium ions across the cell membrane. As a matter of fact, bacteria are depolarized when the external potassium concentration exceeds the cytoplasmic concentration (Novo et al., 2000). As expected, C. glutamicum log phase cells treated with 5 mM valinomycin showed a decrease in the red/ green ratio of DiOC2(3) fluorescence in response to increasing external potassium concentrations. The MP collapsed rapidly in presence of potassium concentrations between 1 and 10 mM. A constant ratio was maintained for potassium concentrations > 15 mM (Fig. 5B). Next, we analysed DiOC2(3) stained C. glutamicum cells grown in CGXII medium at different growth phases. Especially in early log and stationary phase populations we observed the formation of a second ‘low potential’ population, which resides at the position of CCCP-treated or dead cells (Fig. 5C and D). In the mid log phase, where
cells grow at maximum rate, all cells showed vital states and almost no ‘low potential’ cells were detected. However, it has to be considered that a direct conclusion on cellular viability cannot be derived from FC measurements using fluorescent dyes as all dyes itself affect viability of treated cells (Table 1) (Nebe-von-Caron et al., 2000). We therefore rather emphasize MP measurements either for direct comparisons of different strains of the same species under well-defined conditions or as indirect tool to assess cellular viability during cultivation of a particular species. Application of Syto 9 and propidium iodide – ‘live/dead’ staining A classical approach for the determination of membrane integrity is the combination of the fluorescent dyes propidium iodide (PI) and Syto 9, known as ‘live/dead staining’ or BacLight (Hammes et al., 2008). Both dyes bind specifically to DNA and RNA by intercalation between bases. Whereas Syto 9 (green fluorescence) is membrane permeable and stains all cells, PI only penetrates cells with damaged membranes and masks in these cells the Syto 9 signal. For verification of the staining protocol we performed a calibration using defined mixtures of live and dead (isopropanol-killed) cells stained with PI and
© 2012 The Authors. Microbial Biotechnology published by Blackwell Publishing Ltd and Society for Applied Microbiology, Microbial Biotechnology, 6, 157–167
Population dynamics of Corynebacterium glutamicum
163
Table 1. Survival rate of log and stationary phase C. glutamicum cells after treatment with different fluorescence dyes. Survival rates (%)a SYTO®9
Unstained control
DiOC2(3)
Propidium iodide
Incubation time (h)
BHI
CGXII
BHI
CGXII
BHI
CGXII
BHI
CGXII
Log phase Stat phase
96 ⫾ 2 63 ⫾ 3
95 ⫾ 4 49 ⫾ 4
80 ⫾ 13 66 ⫾ 15
71 ⫾ 34 59 ⫾ 29