Monitoring of wheat yellow rust with dynamic Hyperspectral data a
Wenjiang Huanga,b, Liangyun Liub, Muyi Huangb, Jihua Wangb, Jindi Wang a, Huawei Wan a b
National Engineering Research Center for Information Technology in Agriculture P.O. Box 2449-26 Beijing, 100089, China
[email protected]
Research Center for Remote Sensing and GIS, School of Geography Beijing Normal University, Beijing, 100875,China
[email protected]
Abstract: The objective in this study was to develop proper vegetation indices for prediction of soil irrigation demanding under vegetation covering conditions. The traditional method for the winter wheat yellow rust field survey is time consuming. It was discussed of the selection method of characteristic spectral bands and the establishing of inversion model to monitor winter wheat yellow rust using hyperspectral data in this study. The correlation coefficients between selected vegetation index and disease incidence (DI) at infected stages, Inversion models between DI and vegetation index such as normalized difference vegetation index (NDVI), ratio vegetation index (RVI), transformed vegetation index (TVI) were used to monitor yellow rust. The multi-temporal hyperspectral airborne images were acquired from winter booting stage to milking stage, and the Yellow rust disease of winter wheat was analyzed using hyperspectral images. Compared with healthy wheat, spectral reflectance of disease wheat was higher in 560670nm bands but lower in near infrared bands, and the absorption depth of chlorophyll in red band and reflectance peak in green band are relatively reduced. A novel spectral index for yellow rust indices was presented, and the degree and area of yellow rust disease were successfully remotely sensed from the multi-temporal hyperspectral data based on spectral index. Keywords Winter wheat; Yellow rust; Disease incices; Hyperspectral pushbroom imaging spectrometer (PHI)
I.
INTRODUCTION
Winter wheat (Triticum aestivum L.) is one of the most important crops in China. Forecasting, prevention and cure are playing very important roles in wheat production. Rinehart (2002) [6] researched the relationship between canopy spectral reflectance and stripe patch and dollar spot severity on creeping bentgrass. Michio (1991)[4] estimated grain yield of maturing rice canopies using hyperspectral data. Hyperspectral imaging systems scan a large number of wavebands, thus providing a greater spectral resolution in a cost-effective manner (Lamb et al., 2001) [2]. Studies using hand-held spectroradiometers have demonstrated the potential of hyperspectral measurements in detection of weeds (Brown et al., 1994) [1]. Extension of hyperspectral technology at canopy scale from an airborne platform is rather challenging and new for many of applications in agricultural crop monitoring. This paper describes an effort to determine whether it is possible to detect changes in canopy spectral response of yellow rust to monitor the winter wheat yellow rust using the field spectral and airborne hyperspectral images. The
0-7803-8742-2/04/$20.00 (c) 2004 IEEE
combination models between disease indices, the field spectrum and airborne images were established to monitor and forecast the yellow rust in winter wheat, in order to find the appropriate time and dosage of application fungicides. II.
MATERIALS AND METHOD
A. Experimental setups The experiment was conducted at remote sensing base of Beijing suburb, which is located in Changping district (40º21′ N, 116º34′ E), from year of 2001-2002 and 2002-2003. The climate of the study is the North Temperate Zone with a mean annual rainfall of 507.7 mm and a mean temperate of 13℃.Three tested cultivars were Jing 411, 98-100 and Xuezao. Jing 411 has stiff straw with a high tolerant to yellow rust, 98-100 has moderate tolerant to yellow rust, Xuezao was susceptible to yellow rust. The different stress treatments were chosen as follows: Normal treatment (CK) was designed near the yellow rust zone. Yellow rust, the three varieties were inoculated by the yellow rust epiphyte according to plant protection standard, and disease indices data were gained in field at an interval of 5 days after inoculation. B. Field reflectance data All canopy spectral measurements were taken from a height of 1.3m, under clear blue sky between 10:00 and 14:00 Beijing Local Time, using an ASD FieldSpec Pro spectrometer (Analytical Spectral Devices, Boulder, CO, USA) fitted with 25° field of view fiber optics, which functions in the 350–2500 nm spectral region with a sampling interval of 1.4 nm between 350 and 1050 nm, and 2 nm between 1050 and 2500 nm, and with spectral resolution of 3 nm at 700 nm, 10 nm at 1400 nm. A 0.40m*0.40 m BaSO4 calibration panel was used for calculation of reflectance. C. Disease indices and disease leaf rate Disease indices (DI) data were gained in field at an interval of 5 days after inoculation. And the disease severity degree was classified into nine different levels, which was as follows: 0 percent, 1 percent, 10 percents, 20 percents, 30 percents, 45 percents, 60 percents, 80 percents, and 100 percents, it was the ratio of the yellow rust patch areas to the whole leaf areas, it can be calculated as following formula:
4056
Where x is the disease severity degree, n is the highestlevel magnitude, which is 8; it was referred to Li’s research (Li et al., 2000 ) [3]. Disease leaf rate (DLR) data were defined as the ratio of disease leaf numbers (no mention about disease serious degree) to the whole leaf numbers in a unit field area. D. Biophysical and biochemical parameters Immediately following each canopy reflectance measurement, the precise area are corresponding to the footprint of the field spectrometer was harvested to soil level, packed in cooled black plastic bags and transported to the laboratory for subsequent analysis. Various field and laboratory data were collected for biochemical and biophysical analysis, such as foliar chlorophyll, foliar nitrogen and leaf area index (LAI) etc. E. Pushbroom Hyperspectral Imager (PHI) image PHI sensor was designed by Chinese Academy of Science (CAS), A solid state area array silicon CCD device of 780×244 elements is used as the detector of PHI. PHI has three parts: optic-mechanical system, signal process box and industrial control computer. This imager can acquire high spatial resolution because of its long focus time, high spectral resolution, lightweight and relatively high spatial resolution, and low cost enabled these two great imagers to use widely in various fields and to fly at low altitude with light aircraft. It was fitted with 21° field of view and ranged 400–850 nm s region with spectral resolution of 5nm. Three times dynamic PHI images were gained at stem elongation stage (April 18, 2003), Anthesis stage (May 17, 2003) and Grain filling stage(May 31, 2003). It was still not infected by stripe on April 18, but it was infected on May 17, and it was very serious on May 31. III.
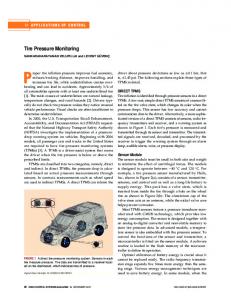
B. Dynamic images of PHI The treatments were inoculated by the yellow rust epiphyte on Apr.1, 2002, and disease indices data were gained in field at an interval of 5 days. PHI image and spectrum reflectance had no significant difference between the normal healthy and inoculated wheat on April 18, the winter wheat was in stem elongation stage, it has no significant difference both in visible light and near infrared bands. In the field, by the disease indices survey, it also shows no visible yellow rust happened. 45
0-7803-8742-2/04/$20.00 (c) 2004 IEEE
Disease0418
35 30 25 20 15 10 5 0 400
500
600
700
800
Wavelength(nm) Figure 1. Image spectra of normal and inoculated wheat on Apr. 18, 2002
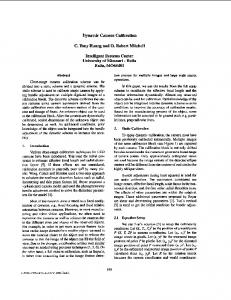
It has significant difference between the normal healthy and inoculated wheat on May 17, the winter wheat was in grain filling stage, as it is known to all, winter wheat growth state is very important to the grain yield and grain nutrition quality. It can be seen from PHI image and spectrum(figure2). 70
RESULTS
A. Inversion models between disease indices (DI) and hyperspectral indices The most common vegetation index was normalized difference vegetation index (NDVI), it was defined by Rouse et al., (1974) [7], and it was defined as follows: NDVI=(NIRR)/(NIR+R); in this paper we choose near infrared (NIR) as 830nm and Red(R) as 675nm. The photochemical reflectance index (PRI) was defined by Penuelas et al.,(1995) [5] as follows: PRI=(R531-R570)/( R531+R570). Regression equations between NDVI, PRI, ρλ680nm,ρλ976nm ,Δρλ1100 and DI were established. DI= -6.32xPRI+121.45; R2=0.879; DI= 21.32xρλ680nm; R2=0.783; DI= -27.43ln(xρλ976nm)+175.26; R2=0.675; DI= -135.11 e-9.88xρλ1100nm; R2=0.689. The coefficient of determination (R2) reached 0.578, 0.879,0.783,0.675and 0.689.
Normal0418
40
Reflectance
∑(x × f ) × 100 n×∑ f
Normal0517
Disease0517
500
700
60 50 Reflectance(%)
DI=
40 30 20 10 0 400
600
800
Wavelength(nm)
Figure 2. Image spectrum of the normal and diseased wheat on May 17, 2002
The winter wheat was in milky maturity stage on May 31, it was obvious that the normal growth wheat spectrum has the vegetation characteristic spectrum, but the diseased infected wheat has lost the typical vegetation characteristics.
4057
The chlorophyll content and leaf area index decreased in disease-infected wheat, so it looked like the dry grass characteristics (figure 3). 45 40
Normal0531
Disease0531
Reflectance(%)
35 30 25 20 15 10 5 0 400
500
600
700 800 Wavelength(nm)
Figure.3 Image spectra of normal and diseased wheat on May 31, 2002
DI>80% DI>45% DI>10% DI>1%
serious distribution area; it almost presented the middle, serious and very serious distribution. As mentioned above, the dynamic PHI images can be used to assess the degree of winter wheat yellow rust. IV.
DISCUSSION In this study, the sensitive bands of inversion models to monitor winter wheat yellow rust were selected, the selection of the sensitive bands will supply the auxiliary information and theory warranty to manufacture the special sensor on monitoring of disease on winter wheat in future research. Regression equations between vegetation indices and yellow rust disease indices in this paper hold a strong potential for “operational” use in the context of winter wheat yellow rust monitoring. It allows the on-site and non-sampling mode of crop growth monitoring and forecasting. Depending on these results we are developing some simple instruments in these sensitive bands. For example, optical camera lens focusing on 680 nm and 976nm or the bands of selected vegetation indices (PRI, NDVI) could be fixed on the agricultural machine traveling in the field. Such simple instruments can diagnose the plant growth status by the acquired spectral response, which is very important to monitor winter wheat yellow rust. ACKNOWLEDGMENT The authors gratefully acknowledge the financial support provided for this research by the Special Funds for Major State Basic Research Project (G20000779) and National High Tech R&D Program of China (2002AA243011), (2003AA209010) and (H020821020130)
DI>0
REFERENCES [1]
[2]
[3] Figure. 4 Disease indices images derived from 3 PHI airborne data Note: (the left, Apr.18, the middle, May.17, the right May.31)
In order to assess the degree of infected winter wheat by yellow rust and the distribution area in the field, it was studied the relationship between disease indices (DI) and spectrum characteristics. If the DI value is more than 80%, it was defined as very serious; more than 45% and less than 80%, defined as serious; more than 10% and less than 45%, defined as middle; more than 1% and less than 10%, defined as venial; about 0, defined as none. It can be seen from figure.5, the white line encircled area was the inoculation area, it almost was not infected by yellow rust on April 18; it was infected on May 17 and it has none, venial, middle, serious and very
0-7803-8742-2/04/$20.00 (c) 2004 IEEE
[4]
[5]
[6]
[7]
BROWN, R.B., STECKLER,G.A., ANDERSON, W.G. 1994, Remote sensing for identification of weeds in no-till corn. Trans. ASAE, 37(1): 297-302. LAMB, D.W., BROWN, R.B. 2001, Remote sensing and mapping of weeds in crops. Journal of Agriculture Engineering Research, 78(2): 117-125. LI YUEREN, SHANG HONGSHENG, 2000, Response of wheat plants infected with Yellow rust to water stress. Acta Phytophysiologica Sinica, 26(5): 417-421 MICHIO SHIBAYAMA, TSUYOSHI AKIYAMA, 1991, Estimating grain yield of maturing rice canopies using high spectral resolution reflectance measurements. Remote Sensing of Environment, 36:45-53 PENUELAS, J., FILELLA, I., and GAMON, J., A., 1995, Assessment of photosynthetic radiation use efficiency with spectral reflectance. Mew Phytologist, 131: 291-296. RINEHART G.L., CATHOUN J.H., and SCHABBENBERGER, O. 2002, Remote sensing of stripe patch and dollar spot on creeping bentgrass and annual bluegrass turf using visible and near-infrared spectroscopy. Australian Turfgrass Management Volume 4.2 : 2-80 ROUSE J.W., HAAS R.H., SCHELL J.A., ET AL., 1974, Monitoring vegetation systems in the great plains with ERTS. In: Proceedings of the Third Earth Resources Technology Satellite-1Symposium, Greenbelt: NASA SP-351: 301-317
4058