SPATIUM International Review No. 31, July 2014, pp. 85-91-7
Technical Report
MONITORING SPATIAL PATTERNS OF URBAN DYNAMICS IN AHMEDABAD CITY, TEXTILE HUB OF INDIA Ramachandra T.V1, Indian Institute of Science, Bangalore, Karnataka, India Bharath H. Aithal, Indian Institute of Science, Bangalore, Karnataka, India Sowmyashree M.V, Indian Institute of Science, Bangalore, Karnataka, India Urbanisation refers to the physical growth of urban region with the increase in the population due to either migration or amalgamation of peri-urban areas into cities. India, with 31.5% (377 million) urban population as per 2011 census, has been experiencing the global trend of increasing urbanisation. Urbanisation process involves changes in land uses and enhanced consumption of energy, which contribute significantly to the global warming. This necessitates developing effective urban planning strategies with the regular monitoring of landscape dynamics. Availability of temporal data of the earth’s surface acquired through space borne sensors helps in mapping and monitoring landscape. Spatial metrics aid in quantifying the urban structure and patterns of urban growth. In this context, the current research reports of urban growth (urbanization and urban sprawl) in Ahmedabad, based on the temporal land use dynamics considering four decades remote sensing data with gradient analysis and spatial metrics. Urban land use dynamics, in terms of both patterns and quantities, were studied using Shannon Entropy index and select spatial metrics for the study area with 10 km buffer (from administrative boundary). This provided insights into the pattern of urban development and its complexity. Results indicate that Ahmedabad city has rapidly grown from 3.2 % to 14.58 % in the period from 1975 to 2010. Spatial metrics highlight that the core area of the city (which is the core financial area) has grown into a compact single urban class, whereas the outskirts have dispersed urban patches. This analysis helps the regional planners and decision makers in advance visualisation of urban patterns for sustainable planning of the city with basic amenities and infrastructure. Key words: spatial analysis, remote sensing, land use, spatial metrics, urbanisation, urban sprawl, Ahmedabad.
INTRODUCTION 1 Rapid urbanisation leads to the haphazard physical growth of urban areas due to rural migration or peri-urban concentration into cities. This process drives major changes in the land use pattern of the region. Structural changes in the landscape alters the functioning of the ecosystem, which affects the sustenance of natural resources (Orville et al., 2000) and human livelihood (Grove and Burch, 1997). The dispersed growth of urban pockets is referred to as sprawl and is an urban characteristic feature (Ebrahimpour- Masoumi, 2012). Urban sprawl, a consequence of development of urban areas under influence of various factors such as social and economic etc., is increasingly becoming a major issue in many metropolitan areas (Ji et al., 2006; Miljković et al., 2012; Ramachandra et al., 2012a). Urban sprawl is the development of small urban settlements in 1
Bangalore, Karnataka, 560 012, India
[email protected]
the periphery or the sub-urban areas and these areas are devoid of any basic amenities (Adhvaryu, 2010; Kundu and Roy, 2012; Ramachandra et al., 2012a). Accurate and timely information on the extent of urbanisation and the rate of growth is required in order to avoid the negative impacts on human habitat, which is of utmost concern to urban planners, civil engineers, environmentalists etc. (Mesev et al., 2001; Ramachandra et al., 2012b). This necessitates understanding the dynamics of urban structure with its functions (Lu et al., 2004; Lu and Weng, 2007). Planners need to monitor the patterns of growth to understand and assess the future demand of urban land while balancing other land uses and providing basic amenities. Conventional surveying techniques are expensive, time consuming and inherently biased in sampling that hinders the understanding of urban phenomena. This has led to an increased interest in spatial research using temporal remote sensing data with Geographic Information System (GIS)
techniques (Herold et al., 2002; Sudhira et al., 2004; Dewan et al., 2009). Remote sensing data with digital processing techniques helps to detect and monitor urban dynamics (Zhang et al., 2002; Ramachandra et al., 2012a). Temporal remote sensing data aids in understanding the changes in the landscape using change detection (Tang et al., 2005). Spatial metrics aid in quantifying the urban structure and patterns of urban growth (Macleod and Congalton, 1998). The spatial metrics are advantageous in capturing inherent spatial structure of landscape classes based on shape, size, centrality, etc., (Herold et al., 2003; Sudhira et al., 2004; Bharath et al., 2012a). Complex measures of urban form were identified based on density, proximity, concentration, centrality, nuclearity, clustering and continuity (Galster et al., 2001). Spatial metrics have aided We are grateful to NRDMS Division, The Ministry of Science and Technology (DST), Government of India, ISRO-IISc Space Technology Cell (STC), IISc and Indian Institute of Science for the financial and infrastructure support. We thank Susanto Sen for language editing and suggestions.
spatium 85
T.V R. et al.: Monitoring spatial patterns of urban dynamics in Ahmedabad City, textile hub of India in characterizing the landscape (O’Neill et al. 1988; Turner et al., 2003; Li and Wu, 2004; Bharath et al., 2012b), including urban growth studies (Civco et al., 2002, Bhatta et al., 2009; Ramachandra et al., 2012a). Shannon’s entropy, a measure of uncertainty, is useful to quantify the urban sprawl in terms of spatial quantity (Sudhira et al., 2004; Bharath et al., 2012a). It has often been used as a measure of disaggregation and aggregation. (Jat et al., 2008). Now there are 48 cities in India with more than one million inhabitants (as per 2011 census, http://censusindia.gov.in). Quantification of urbanization pattern and sprawl in all cities through temporal remote sensing data would help in planning sustainable cities and towns. This research is aimed at quantification of urban process in one of the growing metropolitan textile city, Ahmedabad. The spatial analysis has been carried out for Ahmedabad city administrative boundary with 10 km buffer to account for the regions in peri-urban area experiencing urban sprawl. Temporal land use and land cover (LULC) analyses are performed to understand the distribution and dynamics of land use classes. Shannon’s entropy and spatial metrics with urban land use dynamics helped to assess the urban process quantitatively and qualitatively.
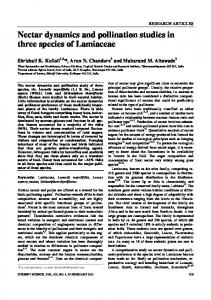
Figure 1. Study region Table 1. Data used Data Landsat Series Multispectral sensor (57.5m)
Year 1975
Landsat Series Thematic mapper (28.5m)
1990, 2010
Purpose Land cover and Land use analysis 2000,
Survey of India (SOI) toposheets of 1:50000 and 1:250000 scales
To generate boundary and base layer maps.
Field visit data – captured using GPS
geo-correcting and validation dataset
generating
STUDY AREA Ahmedabad is the seventh largest metropolitan city in India with population of approximately 7.2 million in 2011 (4.5 million in 2001). The city is located in the northern part of Gujarat and on the bank of River Sabarmati at 23°00’N, 72°40’E, at an elevation of 53 m. Ahmedabad (Karnavati or Amdavad) was the capital of Gujarat from 1960 to 1970 and later the capital was shifted to Gandhinagar. It is the financial and economic hub of Gujarat dominated by textile industries, also known as the ‘Manchester of India’ (Ahmedabad City Development Plan, 2013). The average temperature of the city ranges from 36°C to 43°C (in summer) making the region more hot and dry, and 15°C to 23°C (in winter). The average rainfall is about 1017 mm. The vigorous growth of the city’s economy led to its GDP (Gross Domestic Product) of 59 billion USD in 2010. The administration of Ahmedabad is controlled by the Ahmedabad Municipal Corporation (AMC, http://www.egovamc.com). During the last two decades the city has attracted many foreign investments making Gujarat one of the few economically developed states of India.
MATERIALS AND METHODS Data Landsat satellite images of Ahmedabad were acquired for different time periods from Global
86 spatium
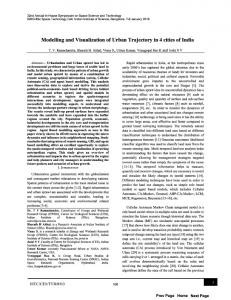
Figure 2. Procedure outline
Land Cover Facility (GLCF, http://glcf. umiacs.umd.edu/data), United States Geological Survey Earth Explorer (USGS, http://landsat.usgs.gov). Table 1 provides the details of the data that were used in the study. Survey of India (SOI) topographic maps was used to generate base layers and administrative boundaries. City administrative boundary was
digitized from the city administration map. Ground control points to register and geocorrect remote sensing data were collected using handheld pre-calibrated GPS (Global Positioning System), Survey of India topographic maps, and Google earth online data (http://earth.google.com) as outlined in Figure 2.
T.V R. et al.: Monitoring spatial patterns of urban dynamics in Ahmedabad City, textile hub of India Pre-processing
Zonal Analysis
The remote sensing data obtained were georeferenced, geo-corrected and cropped pertaining to the study area – Ahmedabad administrative area with 10 km buffer. Landsat satellite data were resampled to 30 m in order to maintain uniformity in spatial resolution across all temporal data.
As most of the definitions of a city or its growth are defined in directions, hence it was considered appropriate to divide the study region into four zones [as Northeast (NE), Southwest (SW), Northwest (NW) and Southeast (SE)] based on directions considering the central pixel (Central Business district).
Land Cover analysis Land cover analysis was performed to understand the changes in the vegetation cover during the study period. Normalised Difference Vegetation Index (NDVI) was computed for assessing the extent of vegetation cover. NDVI values range from -1 to +1. Very low values of NDVI (-0.1 and below) correspond to soil. Zero indicates the water cover. Moderate values represent low density vegetation (0.1 to 0.3), while high values indicate thick canopy vegetation (0.6 to 0.8). Land use analysis False colour composite (FCC) of remote sensing data (bands – green, red and NIR), was generated to visualise the heterogeneous patches in the landscape. Training data were digitized and then loaded to pre-calibrated GPS. The training data were chosen so as to cover at least 10% of the study region and uniformly distributed throughout the study region. Field investigations were carried out to collect the attribute information of these training polygons. The signatures were also digitized as polygons with the help of Google Earth. Land use categories (in table 2) were classified using supervised classifier based on Gaussian Maximum Likelihood Classifier (GMLC) algorithm with the help of training data (60% data were used for classification). GMLC is considered as one of the superior classifiers as it uses various classification decisions using probability and cost functions (Duda et al., 2000). Land use was computed through open source program GRASS Geographic Resource Analysis Support System (http://wgbis.ces.iisc.ernet.in/grass). Out of the total generated signatures 60% were used in classification and balance, 40% were used for validation and accuracy assessment of the classified data. Classes of the resulting image were recoded to form four land-use classes. Accuracy assessment to evaluate the performance of classifier (Ramachandra et al., 2012a) was done through a confusion matrix and comparison of kappa coefficients (Congalton et al., 1983; 1991; 2009).
Gradient Analysis Each zone was divided into concentric circles of incrementing radius of 1 km radius from the centre of the city. This analysis helps in visualising the urbanisation process at local levels and understanding the agents responsible for changes.
the distribution is maximally concentrated, the lowest value zero will be obtained. Conversely, if it is an even distribution among the concentric circles, then the value will be maximum of log n. Computation of spatial metrics Spatial metrics are helpful to quantify spatial characteristics of urbanising landscape. FRAGSTATS (McGarigal and Marks,1995) was used to compute metrics (details of the metrics are in Bharath et al., 2012b), which include Number of patches (Built-up) (NP), Patch Density (PD), Largest patch Index (Built-up) (LPI), Normalised landscape shape Index (NLSI), Area-Weighted Mean Shape Index (AWLSI), Edge Density (ED), Clumpiness Index (CLUMPY) and Aggregation Index (AI).
RESULTS AND DISCUSSION
Shannon’s Entropy (Hn) Shannon’s entropy given in equation 1 was computed for each zone to understand the growth of the urban area in specific zones and to understand if the urban area is compact or divergent. Shannon’s entropy explains the urban process by characterising the growth either as concentrated / aggregated or sprawl (Sudhira et al., 2004; Ramachandra et al., 2012c). (1) Where Pi is the proportion of the built-up in the ith concentric circle and Hn ranges from 0 to log n. If
Land cover The pre-processed temporal remote sensing data were used to derive the land cover of the region using NDVI. Table 3 lists the temporal (1975-2010) dynamics of vegetation cover in Ahmedabad. The results of the analysis show that the percentage of vegetation cover has drastically reduced to almost half in past four decades, with an increase of area under nonvegetation (buildings, open space, water etc.). Land use analysis was performed to understand the status of various classes in the region.
Table 2. Land use categories Land use class
Land uses included in the class
Urban
This category includes buildings and all paved surfaces and also mixed pixels having built up.
Water bodies
Tanks, lakes, reservoirs, canals.
Vegetation
Forest, cropland, nurseries.
Others
Rocks, quarry pits, open ground, un-metaled roads.
Table 3. Vegetation cover (based on NDVI) Vegetation (%)
Non-vegetation (%)
1975
49.78
50.22
1990
39.96
60.04
2000
29.87
70.13
2010
24.73
75.19
spatium 87
T.V R. et al.: Monitoring spatial patterns of urban dynamics in Ahmedabad City, textile hub of India Land use Figure 3 depicts the results of the temporal land use analyses based on GMLC. Table 4 lists the land use statistics, which indicates the decline of area under vegetation to about 24% from 45%, and the increase of the urban impervious class from 3% to about 14%, which is more than 400 times during four decades. Table 5 depicts the overall accuracy and kappa statistics of the analysis. Higher overall accuracy is an indicative that the derived land use information is in agreement with the ground conditions. Figure 4 illustrates the spatial increase in urban pixels during the last four decades based on the temporal classified images pertaining to urban land use class. Assessment of land use dynamics helps in understanding the trends of urban expansions. This illustrates the maximum growth in south-east and north-west directions and mainly in the gradients near the centre. Minimal growth or marginal growth compared to central gradients is seen in buffer zones and on the periphery.
Figure 3. Temporal land use
Shannon’s entropy (Hn) Table 4. Land use dynamics in Ahmedabad
1975 1990 2000 2010
Built-up (%)
Vegetation (%)
Water (%)
Others (%)
3.2 7.13 9.41 14.58
45.4 36.7 32.6 24.34
2.8 1.2 1.44 1.59
48.54 54.9 56.5 59.49
Table 5. Overall Accuracy and kappa statistics Year 1975 1990 2000 2010
Overall Accuracy (%) 72 98 79 87
Kappa 0.4130 0.6109 0.7558 0.8079
Figure 5 depicts Shannon entropy directionwise, from 1975 to 2010. The values close to 0 in 1975 indicate that there was a compact growth, but the values have increased temporally to 0.3 indicating the tendency of sprawl or fragmented outgrowth. This highlights that the region is experiencing land transformation from centric growth to multidimensional fragmented growth. This growth might create more concentrated unconnected patch growths, leading to haphazard development without basic facilities, thereby impacting the local environment.
Figure 5. Shannon’s entropy Figure 4.Urbanisation process during 1975- 2010
88 spatium
T.V R. et al.: Monitoring spatial patterns of urban dynamics in Ahmedabad City, textile hub of India Spatial Metrics Spatial metrics computed circle-wise for each zone are discussed next.
Metrics based on patch characteristics:
Number of patches (NP) Patch density (PD) and Largest Patch Index (LPI) were computed to understand the urban dynamics. NP indicates the number of built-up patches in a landscape through the quantification of urban impervious patches in the landscape. It indicates the level of fragmentation and/or clumpiness in the landscape. Reduced number of patches shows that the patches are combining to form a single class patch (Bharath et al., 2012b, Saura et al., 2007). Patch density, analogous to number of patches, measures the patch concentration in an area. As the number of patches increases, patch density increases representing higher fragmentation, and vice versa (Wu, 2004). LPI is a measure of patch dynamics in the landscape and quantifies the size of the patch in the landscape and its extent (Ibid.). Results indicate the process of aggregation in the core or central business district compared to the periphery and the buffer zones. Globalisation and the reforms in the industrial sector during 1990s witnessed a spurt in urban growth, which is evident from the occurrence of large number of urban patches surrounded by other land uses. Subsequent urban growth witnessed consolidation of fragmented patches with lower patch density and larger urban patch to form clumped urban pockets in all directions by 2010. Specifically, patches in Northwest and Southeast zones had clumped towards a single patch growth at the outskirts and even at the buffer zone.
Metrics based on shape characteristics:
Area Weighted Mean Shape Index (AWMSI), Normalised Landscape Shape Index (NLSI) and Edge Density (ED) were computed to understand the urban pattern based on shape characteristics. AWMSI metric computes the average shape of patches considering the weighted average of patch areas so that larger patches are weighed higher than smaller ones (McGarigal et al., 2002). The results of this metric reveal that during 2010, the core area or the city centre has lower values indicative of regular clumped shapes such as square, circle etc., while outskirts and buffer regions have higher values that can be attributed to a fragmented landscape with irregular patch distributions. During 1970 and 1990s, patches were evenly distributed and were clumped with simple shapes. NLSI represents the normalised value of the shape of the class or patch under consideration. This index provides a simple
measure of class aggregation or clumpiness through measure of the shape as complex or simple (Ramachandra et al., 2012a). Results show that in 1990 the buffer zones show the signs of urbanization with fragmented and complex shapes of growth, especially the gradients from 11 to 17. Further towards 2010, the core or the city administrative region (until gradient 7) show a clumped patch forming single dominant land use with little scope for further urbanization. City outskirts and also buffer region are experiencing dispersed growth or sprawl. Edge density (ED) computes the total number of edges present in a landscape. The increase in the number of patches in a landscape would increase the edges, and compared to a clumped growth would show lesser edge density (Fauth et al., 2000; Botequilha-Leitao et al., 2006; DiBari, 2007; Rehm and Baldassarre, 2007). If ED is 0, then it indicates that the landscape has one single edge/class, or else the increasing values indicate the mixture of land use present in the landscape. Results show a trend of increasing edge densities in the periphery and the buffer zones; post 1990 there has been a steady increase in the gradients 7 to 17 which form the outskirts in NE and SW in 2010 indicating higher degree of fragmentation. Lower edge density in the surroundings of CBD indicates that the urban growth has taken a toll over other land uses and is in the process of clumped single patch formation.
Metrics based on contagion: Clumpiness
Index (CLUMPY) and Aggregation Index (AI) were calculated. Clumpiness index measures patches’ aggregation or clumpiness (O’Neill et al., 1988) of the overall urban patches. Clumpiness ranges from -1 to 1 where Clumpy = -1, when urban patches are maximally disaggregated, Clumpy=0
when the patch is distributed randomly, and Clumpy tends to 1 when urban patch type is maximally aggregated. Aggregation Index gives the similar indication as clumpiness. Values close to 1 at the centre in 2010, when compared to 1975 and in 1990, show the simple clumped growth at the centre and the values close to 0 are indicative of the random patch growth at the outskirts and buffer regions. Clumpiness index clearly indicates the disappearance of other land uses at the centre, and growing urban dominance at the city periphery (gradients 7 to 17) and the buffer region, which highlights that the region has to be monitored for appropriate planning to avoid haphazard growth. The aggregation index shows a similar trend as the clumpiness index indicating a single homogeneous patch at the central part of the city, whereas the outskirts are with urban fragmented patches.
Principal Component Analysis (PCA) was
performed considering spatial metrics (area, shape and contagion), computed zone wise for each circle (Figure 6) and aided in assessing the patterns of urbanisation while prioritizing spatial metrics. PC 1 (Principal Component 1) explains 52.42% variance is positively correlated to metrics NP, LSI and ED, and negatively correlated with Pland LPI and AI. PC1 represents fragmentation of the landscape (circles 10 to 26), evident from metrics (NP, and ED). PLAND, LPI and AI of Circles 1 to 9 lie in the negative plot with low correlation to PC1. These metrics indicate the presence of larger size patch representing aggregated or clumped growth. PC 2 has a percentage variance of 26, with positive loadings for circles 3 to 9, which are in the process of getting clumped.
Figure 6: PCA of spatial metrics during 2010 (Note: A: Ahmedabad, Directions: NW, NE, SW, SE, concentric circles of incrementing 1 km radius: C1 to C 28)
spatium 89
T.V R. et al.: Monitoring spatial patterns of urban dynamics in Ahmedabad City, textile hub of India
CONCLUSION Urban dynamics research provides vital clues for evolving appropriate land use policy for sustainable management of natural resources. In this paper, an attempt is made to quantify and qualitatively describe the patterns of urban growth. Measures of capturing the pattern of growth using entropy, density, clumpiness, and shape will help in the better city planning and facilitate basic amenities and infrastructure. The urban built-up area in the study region (Ahmedabad City with buffer) has increased by more than five times from 1975 to 2010. The fastest growing period was 2000-2010, when urban built-up area increased its spatial extent by 163%. The spatial expansion did not take place equally in all directions. The outward sprawl in the SW and NE directions is higher compared to other zones. Shannon’s entropy and spatial metrics helped in understanding the form of urban sprawl and its spatial pattern. Increased values of entropy show the tendency of sprawl in all directions. Urban sprawl is taking place continuously at a faster rate in outskirts and buffer regions. Spatial metrics have been found to be effective in determination of urban sprawl and its spatial distribution. The pattern of growth has drastically altered the shape of the city that has evolved from simple shaped growth at the core to fragmented complex growth at outskirts. Spatial metrics analysis through gradients helped in understanding the relationship of sprawl with causative factors. This approach is useful for the regional planners and authorities to understand and determine spatial patterns of urbanisation. PCA helped in prioritizing spatial metrics for better elucidation. Results show that the core or the city administrative region (until gradient 7) with a clumped patch forms single dominant land use and little scope for further urbanisation. City outskirts as well as the buffer region are experiencing dispersed growth or sprawl. Temporal remote sensing data and gradient based spatial metrics analyses were useful in understanding the dynamic phenomenon of rapidly urbanizing landscape.
References Adhvaryu, B. (2010) Enhancing Urban Planning Using Simplified Models: SIMPLAN for Ahmedabad, India, Progress in Planning, No. 73, pp. 113–207. Ahmedabad City Development Plan (2013) http://www.scribd.com/doc/20614676/Ahmed abad%C2%A0City%C2%A0Development%C2 %A0Plan, accessed 10th May 2013. Bharath, H. A., Bharath, S., Sreekantha, S., Durgappa, D.S., Ramachandra, T. V. (2012a)
90 spatium
Spatial Patterns of Urbanization in Mysore: Emerging Tier II City in Karnataka, Proceedings
of National Remote Sensing Centre (NRSC) Users Meet, NRSC. Bharath, S., Bharath, H. A., Durgappa, D. S., Ramachandra, T. V. (2012b) Landscape Dynamics through Spatial Metrics. Proceedings of India Geospatial Conference. Bhatta, B. (2009) Analysis of Urban Growth Pattern Using Remote Sensing and GIS: A Case Study of Kolkata, India, International Journal of Remote Sensing, No. 30(18), pp. 4733-4746. Botequilha-Leitao, A., Ahern, J. (2002) Applying Landscape Concepts and Metrics in Sustainable Landscape Planning, Landscape Urban Planning No.59, pp.65–93.
(2000) Using Landscape Metrics to Model Source Habitat for Neo-tropical Migrants in the Midwestern U.S. Landscape Ecol. No. 15, pp. 621–631. Frank, A. (1999) Tracing Socioeconomic Pattern of Urban Development: Issues, Problems and Methods of Spatio-Temporal Urban Analysis in: Li, B. (ed.), Geoinformatic and Socioinformatics,
The proceedings of Conference, pp. 1–12.
Geoinformatics’99
Galster, G., Hanson, R., Ratcliffe, M. R., Wolman, H., Coleman, S., Freihage. J. (2001) Wrestling Sprawl to the Ground: Defining and Measuring an Elusive Concept, Housing Policy Debate, No. 12(4), pp. 681 – 717.
Botequilha-Leitao, A., Miller, J., Ahern, J., Mcgarigal, K. (2006) Measuring Landscapes. A Planner’s Handbook. Washington, DC: Island Press.
Grove, J.M., Burch, W.R. (1997) A Social Ecology Approach and Applications of Urban Ecosystem and Landscape Analyses: A Case Study of Baltimore, Maryland, Urban Ecosyst. No. 1, pp. 259–275.
Civco, D.L., Hurd, J.D., Wilson, E.H., Arnold, C.L., Prisloe, M. (2002) Quantifying and Describing Urbanizing Landscapes in the Northeast United States, Photogr. Eng. Remote Sens. No. 68(10), pp. 1083–1090.
Herold, M., Clarke, K., Scepan, J. (2002) The Use of Remote Sensing and Landscape Metrics to Describe Structures and Changes in Urban Land Uses, Environment and Planning, No. 34, pp. 1443-1458.
Congalton, R.G. (1991) A Review of Assessing the Accuracy of Classifications of Remotely Sensed Data, Remote Sensing of Environment, No. 37(1), pp. 35-46.
Herold, M., Goldstein, N. C., Clarke, K. C. (2003) The Spatiotemporal Form of Urban Growth: Measurement, Analysis and Modeling, Remote Sens. Environ., No. 86, pp. 286-302.
Congalton R.G., Green, K. (2009) Assessing the
Ji W., Ma, J., Twibell, R.W., Underhill, K. (2006) Characterizing Urban Sprawl Using Multi-stage Remote Sensing Images and Landscape Metrics, Comput Environ Urban No. 30, pp. 868-879.
Accuracy of Remotely Sensed Data: Principles and Practices. CRC Press Taylor & Francis Group, Boca Raton, FL. Congalton, R. G. (1991) A Review of Assessing the Accuracy of Classifications of Remotely Sensed Data, Remote Sensing of Environment, No. 37, pp. 35-46.
Kundu, S., Roy, S.D. (2012) Urbanisation and Desanitation: A De-compositional Analysis by Taking a Case Study of Few Indian Cities, Procedia Social and Behavioral Sciences, pp. 427 – 436.
Congalton, R. G., Oderwald, R. G., Mead, R. A. (1983) Assessing Landsat Classification Accuracy Using Discrete Multivariate Analysis Statistical Techniques, Photogrammetric Engineering and Remote Sensing, No. 49, pp. 1671-1678.
Li, H.B., Wu. J.G. (2004) Use and Misuse of Landscape Indices, Landscape Ecology, No. 19(4), pp. 389–399.
Dewan, A.M., Yamaguchi, Y. (2009) Using Remote Sensing and GIS to Detect and Monitor Land Use and Land Cover Change in Dhaka Metropolitan of Bangladesh during 1960-2005, Environ. Monit. Assess. No. 150, pp. 237-249. DiBari, J. (2007) Evaluation of Five Landscapelevel Metrics for Measuring the Effects of Urbanization on Landscape Structure: The Case of Tucson, Arizona, USA, Landscape Urban Plan. No. 79, pp. 308–313. Duda, R.O., Hart, P.E., Stork, D.G. (2000) Pattern Classification. A Wiley-Interscience Publication, Second Edition. Ebrahimpour-Masoumi, H. (2012) Urban Sprawl in Iranian Cities and Its Differences with the Western sprawl, SPATIUM, No. 27, pp.12-18. Fauth, P.T., Gustafson, E.J., Rabenold, K.N.
Lu, D., Mausel, P., Brondízio, E., Moran, E. (2004) Change Detection Techniques. International Journal of Remote Sensing, No. 25(12), pp. 2365-2401. Lu, D., Weng, Q. (2005) Urban Classification Using Full Spectral Information of Landsat ETM+ Imagery in Marion County, Indiana, Photogr. Eng. Remote Sens, No. 71(11), pp.1275–1284. Macleod, R.D., Congalton, R.G. (1998) A Quantitative Comparison of Change-Detection Algorithms for Monitoring Eelgrass from Remotely Sensed Data, Photogramm. Eng. Rem. Sens. No. 64, pp. 207–216. Mahesh, K. J., Garg, P.K., Deepak K. (2008) Monitoring and Modelling of Urban Sprawl Using Remote Sensing and GIS Techniques, International
Journal of Applied Earth Observation and Geoinformation, No. 10, pp.26–43. Mesev, V., Gorte, B., Longley, P.A. (2001) Modified Maximum-Likelihood Classification
T.V R. et al.: Monitoring spatial patterns of urban dynamics in Ahmedabad City, textile hub of India 2
Algorithms and Their Application to Urban Remote Sensing, in Donnay, J., Barnsley, M.J., Longley, P.A. (eds.), Remote Sensing and Urban Analysis. New York: Taylor & Francis Inc, pp. 69–86. Živanović Miljković, J., Crnčević, T., Marić, I. (2012) Land Use Planning for Sustainable Development of Peri-urban Zones, SPATIUM, No. 28, pp. 15-28. O’Neill, R.V., et al. (1988) Indices of Landscape Pattern. Landsc. Ecol. No.1, pp.153–162. Orville, R.E., et al. (2000) Enhancement of Cloud-toGround Lightning over Houston, Texas, Geographys. Res. Lett. No.28, pp. 2597–2560. Ramachandra, T.V., Bharath, A.H., Durgappa, D.S. (2012a) Insights to Urban Dynamics through Landscape Spatial Pattern Analysis,
Int. J Applied Earth Observation Geoinformation, No. 18, pp. 329-343.
and
Ramachandra. T.V., Bharath, H.A., Sreekantha S. (2012b) Spatial Metrics Based Landscape Structure and Dynamics Assessment for an Emerging Indian Megalopolis, International
Journal of Advanced Research in Artificial Intelligence, No.1(1), pp.48-57. Ramachandra, T.V., Bharath, H.A. (2012c) SpatioTemporal Pattern of Landscape Dynamics in Shimoga, Tier II City, Karnataka State, India,
International Journal of Emerging Technology and Advanced Engineering, No. 2(9), pp. 563-576. Rehm, E.M., Baldassarre, G.A. (2007) The Influence of Interspersion on Marsh Birdabundance in New York, Wilson Journal of Ornithology, No. 119, pp. 648–654. Saura, S., Castro. S. (2007) Scaling Functions for Landscape Pattern Metrics Derived from Remotely Sensed Data: Are Their Subpixel Estimates Really Accurate? ISPRS Journal of Photogrammetry & Remote Sensing, No. 62(3), pp. 201–216. Sudhira, H.S., Ramachandra, T.V., Jagdish, K.S. (2004) Urban Sprawl: Metrics, Dynamics and Modelling Using GIS, International Journal of Applied Earth Observation and Geoinformation, No. 5(1), pp. 29-39. Tang, J., Wang, L., Zhang, S. (2005) Investigating Landscape Pattern and its Dynamics in Daqing, China, Int. J. Remote Sens, No. 26, pp. 2259–2280. Turner, R.E., Rabalais, N.N., Justic, D., Dortch, Q. (2003) Global Patterns of Dissolved N, P and Si in Large Rivers, Biogeochemistry, No. 64(3), pp. 297–317. Wu, J. (2004) Effects of Changing Scale on Landscape Pattern Analysis: Scaling Relations. Landscape Ecology, No. 19, pp. 125–138. Zhang, Q., Wang, J., Peng, X., Gong, P., Shi. P. (2002) Urban Built-up Land Change Detection with Road Density and Spectral Information from Multi-Temporal Landsat TM Data, Int. J. Remote Sens. No.23, pp. 3057–3078.
Received June 2013; accepted in revised form March 2014
spatium 91