Biosensors
Vol. 13. No. 3 4 , pp. 4 3 9 4 4 9 , 1998 © 1998 Elsevier Science S.A. All rights reserved. Printed in Great Britain
& Bioelectronics
PII: S0956--5(~3(97 ) 0 ~ 9 4 - 8
ELSEVIER
0956-5663/98/$19.00
Monitoring specific interaction of low molecular weight biomolecules on oxidized porous silicon using ellipsometry Danny van Noort, Stefan Welin-Klintstr6m, Hans Arwin, Shahin Zangooie, Ingemar Lundstr6m & CarI-Fredrik Mandenius* Laboratory of Applied Physics, Department of Physics and Measurement Technology, Link6ping University, S58183 Link6ping, Sweden (Received 14 April 1997; revised form received 11 August 1997; accepted 12 August 1997)
Abstract: Porous silicon dioxide surfaces have been used for monitoring the
specific affinity binding of low molecular weight molecules to streptavidin. Streptavidin was immobilized to the porous silicon dioxide surface by spontaneous adsorption at pH 7.4. Binding of biotin and an oligopeptide synthesized by means of combinatorial chemistry were monitored with an in situ null ellipsometer. Measurements were also done with hydroxy-azobenzene-2-carboxylic acid and DL-6-8-thioctic acid amide. The performance of porous silicon dioxide as a potential surface in biosensor applications was compared with a planar silicon dioxide surface. Porous silicon dioxide showed a 10-fold amplification of the response compared to planar silicon dioxide. It was possible to monitor the binding of biotin and the oligopeptide in the concentration range 2--40/xM. A response time as low as 30 s was obtained for the oligopeptide at 40/xM. © 1998 Elsevier Science S.A. All rights reserved. Keywords: affinity biosensor, porous silicon, ellipsometry, immobilization, streptaindin
INTRODUCTION Optical biosensing is usually based on the interaction of light with biomolecules. So far, techniques such as surface plasmon resonance and ellipsometry have been focused mostly on interactions on a macromolecular scale, for example antigenantibody interactions and reactions involving nucleic acids (Turner et al., 1988). Very few
* To whom correspondence should be addressed. Email:
[email protected]
reports are available on the interaction of small molecules with biological receptors (Karlsson & Sffthlberg, 1995; Ohlson et al., 1997). In the search for potent low-molecular biostructures, for example oligopeptides or nucleotides useful as drug lead compounds, a profound need has emerged for rapid detection and screening methods that have the capacity to analyse thousands of compounds per day. These methods are sometimes referred to as high-throughput screening methods and often rely on miniaturization of analytical devices with multiplexing abilities (Jacobs & Fodor, 1994). Characteristic for these 439
D. van Noort et al.
analyses is that analytes exist at reasonably high concentration and without disturbing impurities, clearly in contrast to other applications to quantitative analysis where it is necessary to strive tbr lower detection limit and ability for handling complex impurity patterns. In order to detect binding of small molecules to a receptor protein, often with a ratio less than 1:100 in molecular weight, a sensitive detection method needs to be developed. Amplification methods on the surface can increase the sensitivity using, for example antibody-coated nanoparticles (Mandenius & Mosbach, 1988) or surface-enlarging layers of polymers (Mandenius et al., 1986; L0ffts & Johnsson, 1990). Here we demonstrate the advantage of using oxidized porous silicon as surface enlargement for the binding of receptor molecules. Although porous silicon has been used in combination with other biosensor applications (Laurell et al., 1995; Thust et al., 1996; Bjorklund et al., 1996), no previous use of these surfaces has been reported with surface optical biosensing. We have chosen here to use streptavidin as a model receptor since it has a high affinity for biotin (Kd ~ 10-~5 M), can bind up to four ligand molecules per streptavidin tetramer and the binding is undisturbed by harsh conditions (Green & Toms, 1973). In this study we compare a few principally different methods of producing biospecific surfaces. In addition, adsorption of four different lead compound analogues is studied.
MATERIALS AND METHODS
Materials The following chemicals and solutions were used in the experiments: streptavidin (molecular weight 60 000) dissolved in phosphate-buffered saline to a concentration of 3.3/~M (PBS; 0.15 M NaC1, 0.01 M NazHPO4.H20, 0-01 M KH2PO4, pH 7.4 at - 22°C), biotin, 4-hydroxyazobenzene-2-carboxylic acid (HABA) and DL-6-8-thioctic acid amide (DL-lipoamide), all dissolved in water to a concentration of 50/xM (Sigma Chemical Co., St Louis, MO). The oligopeptide AcAEFSHPQNTIEGRK-NH2 (Fig. 1) was obtained from Arris Pharmaceutical Co. (San Francisco, CA) and synthesized with a combinatorial chemistry method. Table 1 shows the molecular 440
Biosensors & Bioelectronics
weights and the affinity constants to streptavidin of the compounds investigated. Silicon wafers of p-type, (1 l l)-orientation and a resistivity of 0 . 0 1 - 0 . 0 2 ~ / c m for the porous surfaces were obtained from Okmetic OY (Finland). All chemicals used were of analytical grade.
Surface preparation Porous silicon films were prepared electrochemically by anodic etching (Bjorklund et al., 1997). Silicon wafers were cut in 1 × 3 cm pieces and placed vertically in an etch solution. The composition of the solution was three parts ethanol and two parts of 40% aqueous hydrofluoric acid solution (Merck). Anodization was performed at about 50 mA/cm 2 for 5-7 s using a Ptwire as a counter electrode. After anodization, the films were rinsed in ethanol and dried in nitrogen gas. Porous silicon films prepared in this way have a yellow-reddish colour. Furthermore, they are hydrophobic due to their SiH~ covered surfaces. In order to stabilize the porous structure, the samples were preoxidized at 300°C for 1 h and then heated at 800°C for an additional half an hour (also see Yon et al., 1987). Besides increasing the wettability, this treatment causes the porous silicon film to convert to a porous silicon dioxide film, with a thickness in the range of 2500-2700 A, and a porosity in the range of 50-60%. Three different methods were used to immobilize streptavidin on the solid support: (i) adsorption in situ in a cuvette of the ellipsometer system as described in the next section; (ii) adsorption from a droplet of streptavidin solution placed directly on the dry surface; or (iii) immobilization of streptavidin by crosslinking with glutardialdehyde as described below. The addition of analytes was done in situ in the cuvette. In the crosslinking experiment, a planar silicon sample with an oxide layer of 280 A was used. The silicon sample was cleaned at 80°C (5 min) with an ammonia/hydrogen peroxide/water solution (1:1:3), removing organic impurities. After this the sample was washed also at 80°C (5 min) with a hydrogen chloride/hydrogen peroxide/water solution (1:1:3) to render the surface hydrophilic. Streptavidin was first adsorbed at a concentration of 3/~M and then crosslinked by the addition of 2-5% glutardialdehyde. Subsequently, the sample
Biosensors & Bioelectronics
Monitoring specific interaction of low molecular weight biomolecules
Ac
Fig. 1. Structure of the peptide Ac-AEFSHPQNTIEGRK-NH2.
TABLE 1 The molecular weights of compounds and their affinity constants for streptavidin Lead compound
HABA DL-lipoamide Ac-AEFSHPQNTIEGRK-NH2 Biotin
Molecular Affinity weight constant (M)
242 205 1994 244
1.7 x 1.4 × 1"5 x 1-0 x
105* 106* 10st 10'st
*Ikariyama & Aizawa (1988). tArris Pharmaceutical (1996).
was rinsed in deionized water and dried in nitrogen gas.
Measurement method The ellipsometric measurements were performed at room temperature using a null-ellipsometer (model 436, Rudolph Research Co., N J) in the PCSA arrangement as shown in Fig. 2. The setup has been described in detail by Welin-KlintstrOm et al. (1993). The sample was immersed in a cuvette filled with deionized water or PBSbuffer, depending on the application. The volume
of the cuvette was 5 ml. A H e - N e laser with a wavelength of 632.8 nm was used and the angle of incidence was 67.6 ° . The polarizer and analyser azimuths were controlled by computer and their positions corresponding to the ellipsometric null condition were recorded every 5 s. From the analyser position we obtain to, the ratio of the amplitude change of components of the light, polarized parallel and perpendicular to the plane of incidence, whereas the polarizer reading is used to obtain the corresponding difference in phase shift, A. From tO and A, the refractive index and the thickness of a thin layer can in principle be calculated. In the most simple evaluation, the surface concentration can be obtained by multiplying the thickness by the density of the film material. However, to obtain the thickness for very thin films ( < 100 A), it is often necessary to assume a value for the refractive index due to high correlation with the thickness. In the present study the microstructure is very complicated and a simple optical model allowing a quantification of, for example, the film thickness and surface concentration, is not straightforward to define. We have therefore chosen to present the results directly in terms of the tO and A readings. Con-
Sample
V
Fig. 2. Schematic overview of a null-ellipsometer in a polarizer-compensator-sample-analyser (PCSA) arrangement. The function o f the quarter wave plate is to convert the linearly polarized laser light to circulary polarized light. The two unmarked components are diaphragms.
441
D. van Noort et al.
Biosensors & Bioelectronics
sidering the complexity of oxidized porous silicon, we believe that only a qualitative interpretation of the results is possible. Adsorption of streptavidin and biotin on the porous silicon dioxide and the non-porous silicon dioxide was monitored in the ellipsometer cuvette. Streptavidin was added either directly to the cuvette or adsorbed before immersing the surface in the cuvette as described in the previous section. After we knew the character of streptavidin binding to porous silicon dioxide surfaces, we adsorbed streptavidin to the surface before starting measurement on the binding of the analytes to this configuration. For each experiment a new surface was prepared. All the measurements were run in deionized water.
RESULTS AND DISCUSSION Detection of affinity binding of small molecules to receptor molecules requires better sensitivity of either the transducer and/or the biopart of the
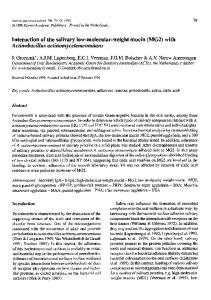
sensor system. Enlargement of the surface area was previously shown to be successful with, for example, dextran chips used with surface plasmon resonance spectroscopy (L0ffis & Johnsson, 1990). Here we investigated how an analogous technique can be carried out using porous silicon dioxide. The large specific surface area of freshly prepared porous silicon layers, larger than 200m2/cm 3 (Bomchil et al., 1983), implies a magnification of the amount of adsorbed species per unit area. However, due to the thermal treatment used here, a reduction of the surface area is probable since this procedure results in a growth of the porous matrix and an obstruction of the smaller pores. Fig. 3 shows a three-dimensional atomic force microscopy image of a porous silicon dioxide sample. The open surface structure of the sample is clearly seen in the picture. Fig. 4(a) shows a typical A response versus time after addition of streptavidin to a concentration of 33 nM to the ellipsometer cuvette for the two surfaces studied: the planar silicon dioxide and the porous silicon dioxide. Fig. 4(b) shows analogous curves for ~0. It can be seen
IJN 0,8 0,6 0,4 0,2
X 2
0.200 vM/div 30.000 nM/div
Fig. 3. Atomic force microscopy image of the porous silicon dioxide surface measured in tapping mode.
442
Biosensors & Bioelectronics
Monitoring specific interaction of low molecular weight biomolecules III
£
II
LI
planar silicon dioxide -2
-6
-8
porous silicon dioxide
-10 5
i
000
100190
i
I
15000
20000
'
I
I
25000
30000
35000
time [s]
(a) 3.0
porous silicon dioxide 2.52.01.5 L
"0
1.0
0.5
planar silicon dioxide Ill
II
I
0.0
-0.5
IW
o
o'oo
Io6oo
(b)
2o6oo 26oo
3ooo
time IS]
Fig. 4. (a) Change in A versus time for the adsorption of streptavidin to different surfaces: planar silicon dioxide, porous silicon dioxide. (b) Change in t~ versus time for the adsorption of streptavidin to different surfaces." planar silicon dioxide, porous silicon dioxide.
that the porous silicon dioxide surface gives a 10-fold larger response compared to the planar surface, but one order of magnitude slower. As a control experiment, diluted PBS buffer (100fold) was added separately and showed a drift in A and @ at less than 0.05°/h. A reference measurement in deionized water showed that porous silicon dioxide is stable under these conditions. Also, a control with biotin only revealed that no significant amount of biotin was
adsorbed to the surface. We can therefore conclude that the data presented are a result of binding of the receptor molecule to the surface or the analyte binding to the receptor molecule. The slower rate ~ f adsorption in the case of porous silicon dioxide is due to the long diffusion time for streptavidin to diffuse into the pores. The large difference in total response between the surfaces is due mainly to the porous surface allowing much more streptavidin to adsorb 443
D. van Noort et al.
Biosensors & Bioelectronics 184.4
biItin
184.3
184.2
rinsed .-o.
184.1
184.0
183,9 i
2000
0
40100
(a)
60100
8000
time [s] 20.66
biotin
20.64 20.62
~120160
rinsed
"I~
~
20.58 ~°
~
o ~
20.56 o
o
21000
• 4000
o
oo
e
20154 7
8OOO
~6000
time [s]
(b) 20.66
s
%o
20164 •
20.62
~
20.60
s+b
"
o~ °°°
°8
20.58
20.56
20.54
(c)
J
i
i
i
i
183.9
184.0
184.1
184.2
184.3
184.4
A [degrees]
Fig. 5. (a) ~ versus time f o r binding of biotin (2 I~M) to porous silicon dioxide with preadsorbed streptavidin. The arrows show when biotin was added and rinsed away. (b) tO versus time for the same experiment as in (a). (c) tO versus A f o r the same experiment as in (a). The s area represents streptavidin before biotin addition and the s + b area after biotin addition.
444
Biosensors & Bioelectronics
Monitoring specific interaction of low molecular weight biomolecules
0.0 -0.2 -0.4 -0.6
"O
.