WFL Publisher Science and Technology Meri-Rastilantie 3 B, FI-00980 Helsinki, Finland e-mail:
[email protected]
Journal of Food, Agriculture & Environment Vol.7 (3&4) : 120-125. 2009
www.world-food.net
Monitoring the change patterns of physicochemical properties of oil blend as function of storage time Mahsa Naghshineh 1, Abdul Aziz Ariffin 1*, Hasanah Mohd Ghazali 2, Hamed Mirhosseini 1, Ainie Kuntom and Abdulkarim S. Mohammad 2
3
1
Department of Food Technology, 2 Department of Food Science, Faculty of Food Science and Technology, Universiti Putra Malaysia, 43400 Serdang, Selangor, Malaysia. 3 Malaysian Palm Oil Board, Bandar Baru Bangi, 43000 Kajang, Selangor, Malaysia.*e-mail:
[email protected],
[email protected] Received 21 July 2009, accepted 28 September 2009.
Abstract The aim of this study was to investigate the effect of storage time, type and concentration level of frying oil on the physicochemical properties of oil blend during 8 consecutive week storage. The physicochemical properties of frying media, namely melting point, iodine value (IV), peroxide value (PV), anisidine value (AV), TOTOX value (TV) and free fatty acids (FFA), were considered as response variables. The results obtained from PV, AV and TV measurements indicated that the oil blend containing higher content of linolenic acid (C18:2) and lower percentage of oleic acid (C18:1) showed less stability to the oxidation. This was explained by the higher chemical stability of oleic acid towards oxidation both at ambient and elevated temperatures compared to polyunsaturated fatty acids. The prepared oil blends (POO:OO, 75:25 and 50:50) indicated higher PV (> 1.64 meq O2/kg) compared to control sample PV (0.8 meq O2/kg) in Week 0 of storage, while the increase in PV of control sample was found to be sharper compared to the prepared oil blends. In fact, the oil blend containing higher content of linolenic acid (C18:2) and lower percentage of oleic acid (C18:1) showed less stability to the oxidation. Thus, the sharper increase in PV of control sample was largely contributed to the high amount of linolenic acid. During 8 weeks storage, the melting point of control and oil blends (POO:OO, 75:25 and 50:50) increased, from 21.40 to 22.45, from 18.27 to 21.72 and from 14.51 to 19.41ºC, respectively. Thus, the highest and least changes in melting points were shown by oil Blend 2 (POO:OO, 50:50) and control sample. In most cases, the main effect of storage time and the interaction effect of storage time and type of frying oil showed the most significant (p < 0.05) effect and the least significant (p < 0.05) effect on physicochemical properties of frying media, respectively. This study suggests that the chemical stability of frying oil during storage depends not only on the saturated fatty acid content but also on the concentration level of monounsaturated and polyunsaturated fatty acids. Key words: Frying oil, oil blend, melting point, iodine value, peroxide value, anisidine value, TOTOX value, free fatty acid, linolenic acid, olive oil, oxidation.
Introduction Deep-fat frying is one of the oldest processes of food preparation and consists basically in the immersion of food pieces in hot oil. The aim of deep-fat frying is to seal the food by immersing it in the hot oil so that all flavors and the juices are retained by the crisp crust 1. Due to high frying temperature (150–200°C) and the presence of oxygen and steam released from food, the oil undergoes a series of chemical reactions that decomposes it to form a variety of volatile compounds, as well as monomeric and polymeric products 2. In particular, the oil degradation or oxidative rancidity occurred during frying results in the formation of polar compounds that are able to reduce the surface tension at the oil– food interface 3. Oxidative rancidity development has been recognized as the predominant cause of oil deterioration during frying process and storage period. Therefore, autoxidation in oils can neither be prevented by maintaining cool storage conditions nor by the exclusion of light 4. As a result of the oil deterioration, the oil sustains some physical changes: the colour darkens, the viscosity increases and smoke appears 5. Color is visually considered one of the most important parameters in the definition of quality of fried potatoes as the result of Maillard reaction that depends on the content of 120
reducing sugars and amino acids or proteins at the surface and the temperature and time of frying 6. Texture is also one of the critical sensory attributes of fried potato affecting its overall quality and acceptability 7. The texture of potato was found to be directly related to specific gravity, total solids, starch content, cell size, surface area and pectin 8. For potato chips, a very crispy texture is expected all way through since crispness shows high quality an indicator of freshness 9. Vegetable oil quality and stability are the main factors that influence consumer acceptability and market value. Usually many oils can be used for frying, e.g. palm oil, corn oil, cotton oil, soya oil and sunflower oil 10. Cottonseed, corn, peanut and olive oils are used as a stable source of polyunsaturated fatty acids because of their low linolenic acid content 11. Since the most appropriate frying oil should be low in free fatty acids and polar compounds, extra virgin olive oil is a very interesting option when looking for frying oil 12. Olive oil is unique among cooking oils because of its high monounsaturated fatty acid content and the presence of health-promoting micro-constituents, namely polyphenols, squalene and tocopherols 11, 13, 14. Blending of vegetable oils and fats has emerged as an economical
Journal of Food, Agriculture & Environment, Vol.7 (3&4), July-October 2009
way of modifying the physicochemical characteristics of vegetable oils and fats besides enhancement in oxidative stability14. Thus, the main objective of present work was to investigate the effect of storage time and type of oil, namely refined, bleached and deodorized (RDB) palm olein oil (100, 75 and 50% w/w) and olive oil (100, 75 and 50% w/w) on physicochemical properties of oil blends during 8 consecutive weeks of storage. Materials and Methods Materials: Refined, bleached and deodorized (RDB) palm olein oil was supplied by the Malaysian Palm Oil Board (MPOB, Selangor, Malaysia). Pure olive oil was purchased from a local supermarket (Selangor, Malaysia). Sodium metoxide and sodium hydroxide were supplied by Fisher Scientific (Pittsburgh, PA, USA). Acetic acid was obtained from BDH Ltd (Poole, UK). Ether, ethanol and diethyl ether were purchased from Merck (Darmstadt, Germany). All other chemicals used were either high-performance liquid chromatography (HPLC) or analytical grade. Preparation of oil blends: Two oil blends (POO:OO, 75:25 and 50:50) were prepared by mixing different concentration levels of palm olein oil (POO, 50 and 75% w/w) and olive oil (OO, 25 and 50% w/w). Pure RBD POO (100% w/w) was considered as a control sample. The samples were stored at the accelerated storage condition (60ºC). The sampling was performed once per week for 8 consecutive weeks of storage. Fatty acid composition: Fatty acid methyl esters (FAME) were prepared according to the analytical method provided by Palm Oil Research Institute of Malaysia 15. In this study, 50 mg of oil was dissolved into petroleum ether (0.8 ml) and sodium metoxide (1 M, 0.2 ml). The fatty acid composition was then analyzed by using a Hewlett-Packard 6890 GC (Wilmington, DE) equipped with a flame ionization detector (FID) and a polar capillary column BPX70 (0.25 mm × 30 m × 0.25 µm, SGE International Pty, Victoria, Australia). The oven temperature was programmed in two stages as follows: first, from 50 to 180ºC (8ºC/min), and then from 180 to 200ºC (5ºC/min). The carrier gas (i.e. helium) flow rate was 6.8 ml/ min. Standard methyl esters of fatty acids were used as authentic samples and peak identification was done by comparing relative retention times. Melting behaviour: The melting behavior of samples was investigated by using Perkin-Elmer differential scanning calorimetry (Perkin-Elmer Diamond DSC, Shelton, Connecticut, USA). The instrument was calibrated using indium and zinc. The purge nitrogen gas (99.99%) was used as a carrier gas with a flow rate of 100 ml/min. For thermal analysis, frozen oil (6±0.5 mg) was heated at 60°C in an oven until completely melted and then placed in an aluminium violate pan. The sample was then cooled to -60°C at the flow rate of 5°C/min and held for 2 min at -60°C. It was then subjected to the heating procedure ramped from -60 to 60°C at the normal flow rate of 5°C/min 16. The heating thermogram was recorded and consequently the offset (end), the onset and end of melting transition temperatures were tabulated.
in 15 ml of carbon tetrachloride and 25 ml of Wijs’ solution were added. After storing at room temperature in the dark for 1 h, the mixtures were reacted with 20 ml of 1 N potassium iodide and then titrated with 0.1 N sodium thiosulphate solutions 18. Peroxide, anisidine and TOTOX value: PV was evaluated following AOAC method (28.022,18) using 5 g of oil. It consisted of reaction in darkness of a mixture of oil and chloroform/acetic acid 2:3 (v/v) with saturated potassium iodide solution. The iodine formed was titrated with 0.1 N Na2S2O3. PV was expressed as milliequivalents of active oxygen per kilogram of oil (meqO2/kg) and calculated using the formula: PV (meqO2/kg) = (volume in ml of Na2S2O3) × (0.1 N) × (1000) × (g/oil). PORIM test methods 19 were used to determine p-anisidine values. The p-anisidine method was developed to replace a similar method, the benzidine test, because benzidine is a known carcinogen. The p-anisidine value is a measurement of aldehyde content in oil, principally 2,4-dienals and 2-alkenals. The sample (0.5-4.0 g) was dissolved and diluted to volume with isooctane in a 25 ml volumetric flask. The absorbance (Ab) of the solution was measured at 350 nm. Exactly 5 ml of the fat solution were transferred to a test tube and 5 ml of only the solvent were added to another test tube. One millilitre of p-anisidine reagent (2.5 g/l solution in glacial acetic acid) was added to each tube, and shaken. After exactly 10 min, the absorbance (As) of the solution in the first test tube was measured at 350 nm, using the solution in the second test tube as blank. P-AV= [25 (1.2 As- Ab)] / m The TOTOX (i.e. total oxidation products) value was introduced for the evaluation of refined oils. The p-AV is often used in the industry in conjunction with PV to calculate TOTOX value given as: TV = 2PV + p-AV 20. The reason for the multiplication of the PV by a factor 2 is that the PV has a more pronounced effect on the stability of refined oil than the AV. Free fatty acid (FFA): FFA was determined according to the PORIM test method 15. For measurement of FFA, 30 ml of the mixture solvent (ether/ethanol/water, 3:3:2 v/v/v) was used to dissolve 5 g of the sample and then titrated using 0.1 N sodium hydroxide solution 20. FFA was expressed as % oleic acid. Free fatty acid or (FFA) is given by FFA (%): 25.6 N V/W. Statistical analysis: The data were subjected to one and two way analysis of variance (ANOVA) to determine the significant (p < 0.05) main and interaction effects of independent variables namely storage time and oil blend formulation on the response variables studied. The physicochemical properties of oil, namely fatty acids composition (FAC), melting point, total polar compounds (TPC), IV, PV, AV and FFA, were considered as the response variables. The corresponding variables will be more significant (p < 0.05) if the absolute F ratio becomes larger and the p-value becomes smaller 21, 22. The measurements were carried out in duplicate or triplicate and reported as the mean of independent trials. The data analysis was performed using the Minitab software v. 13.2 (Minitab Inc., State College, PA, USA).
Iodine value: The IV of the samples was determined as described in the AOCS Method Cd 1-25 17. The sample (0.400 g) was diluted Journal of Food, Agriculture & Environment, Vol.7 (3&4), July-October 2009
121
32.08, respectively (Fig. 2). This observation confirmed that the control was more susceptible oil to the chemical oxidation at the accelerated temperatures during storage than the prepared oil blends. In general, the increase in the AV of all samples was observed with prolonging the storage time. This observation could be explained by the fact that the less stable primary oxidative products (i.e. hydroperoxides) decomposed to aldehydic compounds. It was found that the single and interaction effects of independent variables had the considerable (p < 0.05) effect on (Fig. 2). It was found that the single and interaction effects of
Peroxide value (meq O2/kg)
60 POO:OO (100:00) POO:OO (75:25)
50
Ag
POO:OO (50:50)
40 30 Ade
20
Ac
10 Ba
Ca
Acd Abc Aab
Ab Aab Aab
Abc
Bf Bd
Ae
Acd Abc
Ce
Ad Ad
Acd
Ah
ABe
Af
0
Ac
Bbc
Aa
0
1
2
3 4 5 Storage time (week)
6
7
8
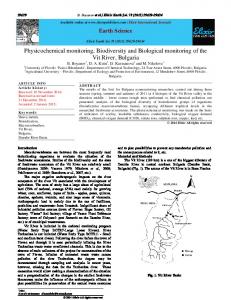
Figure 1. The changes in PV of frying media during storage. 40
POO:OO (100:00) POO:OO (75:25) POO:OO (50:50)
35
Ag Bc
Bc
Ce
30 Anisidine value
Results and Discussion Peroxide, anisidin and TOTOX value: The results showed that there was a significant difference (p < 0.05) between the PV of all the samples during 8 consecutive weeks of storage (Fig. 1). There was an initial sharp increase in PV from Week 0 to Week 7 in all samples; while the PV of all the samples decreased in last week of storage (Fig. 1). This observation could be explained by the fact that peroxides are unstable compounds and they will break down to carbonyl and aldehyde compounds 23. The increase in PV for control sample was more pronounced from Week 0 to Week 7 rather than from Week 7 to Week 8 (Fig. 1). As shown in Table 1, the prepared oil blends (POO:OO, 75:25 and 50:50) indicated higher PV (> 1.64 meq O2/kg) compared to control sample PV (0.8 meqO2/kg) in Week 0 of storage, while the increase in PV of control sample was found to be sharper compared to the prepared oil blends (Fig. 1). In fact, the oil blend containing higher content of linolenic acid (C18:2) and lower percentage of oleic acid (C18:1) showed less stability to the oxidation. Thus, the sharper increase in PV of control sample was largely contributed to the high amounts of linolenic acid. In this sense, the rate of oxidation is proportional to the degree of unsaturation 5. Linoleic acid has two double bonds and for that reason, POO must be more susceptible to oxidation compared to the oil blends containing lower linoleic content. The AV determination is an empirical test for assessing advanced oxidative rancidity of oils and fats 24. Anisidine value (AV) estimates the secondary oxidation products of unsaturated fatty acids, principally conjugated dienals, 2-alkenals and 2alkenals in animal fats and vegetable oils 25. Aldehydes are largely considered responsible for the off-flavors in fats and oils due to their low sensory threshold values 26. The AV test is particularly useful for abused oils of low peroxide value (PV) and for assessing the quality of highly unsaturated oils. The changes in the AV of samples during storage are shown in Fig. 2. As shown in Fig. 2, the AV of control sample increased from 0.35 to 11.92 from Week 0 to Week 7 of storage; while the AV of oil blends (POO:OO, 75:25 and 50:50) increased from 1.46 to 34.65 and 2.37 to 29.41, respectively. As demonstrated by Rossell 27, the AV should be less than 10 for good quality oil. Since oxidation is increased during storage, theoretically AV should also increase. These results were in agreement with this theory. At last week of storage, the AV of control reached 38.35, while the AV of prepared oil blends (POO:OO, 75:25 and 50:50) were found to be 35.91 and
Be Bd
25 20 15
Af
10
Cbcd Ab Ab Cbc 5 Ca Bb Bb Ac Ba Ab Ab 0 Aa
0
1
Ccd Ccd Bb Bb Ad
Ae
2 3 4 5 Storage time (week)
Cd
Bb Ae
6
7
8
Figure 2. The changes in AV of frying media during storage.
Table 1. The significance of each independent variable effect shown by F-ratio and p-value. Response variables
Independent variables Type of oil
Peroxide value [meq O2/kg] Anisidine value TOTOX value Free fatty acid [% oleic or palmitic acid] Iodine value [g I2/100 g oil] Melting point [°C]
P value F ratio P value F ratio P value F ratio P value F ratio P value F ratio P value F ratio
0.000 47.49 0.000 15.60 0.000 79.28 0.000 54.00 0.000 476.08 0.000 1322.47
Storage time
Interaction
0.000 309.57 0.000 4046.46 0.000 705.08 0.000 343.00 0.000 46.21 0.000 135.04
0.000 4.31 0.000 30.71 0.000 9.45 0.000 9.00 0.032 2.23 0.000 24.78
* Non-significant effect (p > 0.05).
122
Journal of Food, Agriculture & Environment, Vol.7 (3&4), July-October 2009
140
POO:OO (100:00) POO:OO (75:25)
TOTOX value
120
Ah
Ag
POO:OO (50:50)
Be
100
Bd Cf
80 Ae
60 Acd
40
0
Abcd Acd
Abc Bbc Bbc
Ab
20
Cf
Af
Ab
Ca
Ade
Acd Bd
Acd Ade
Bde
Be
Aab
Ba Aa
0
1
2
3 4 5 Storage time (week)
6
7
8
Figure 3. The changes in TV of frying media during storage.
Free fatty acid (% oleic or palmitic acid)
0.35
POO:OO (100:00) POO:OO (75:25) POO:OO (50:50)
0.30
Ci Ch
0.25
Bi
Cc
Cb
0.15
Bb
0.05
Cg
Cf
0.20
0.10
showed the highest chemical stability to oxidative rancidity during 8 week storage, while the control oil containing the least oleic acid content and highest concentration level of linoleic acid showed the least chemical stability during 8 week storage (Fig. 3). This observation could be because of the higher stability of oleic acid towards oxidation both at ambient and elevated temperatures compared to polyunsaturated fatty acids 29. Thus, the present study suggests that the chemical stability of frying oil during storage depends not only on the saturated fatty acid content but also on the mono- and polyunsaturated fatty acid contents.
Aa Aa Aa
Bc
Ab
Ac
1
2
Ce
Cd
Bg Ah
Be
Bd Ad
Ai
Bh
Bf Af
Ae
Ag
0.00 0
3
4
5
6
7
8
Storage time
Figure 4. The changes in FFA of frying media during storage.
independent variables studied had the considerable (p < 0.05) effect on AV. The results demonstrated that the storage time and type of frying media had the most and least significant (p < 0.05) powerful effect on AV (Table 1). The TV is a measure of total oxidation including primary and secondary products and therefore should increase during frying process. Nawar 30 reported that TV or total oxidation value may be used for assessment of oxidation of oils. The results obtained from TV determination are shown in Fig. 3. The same results as reported for PV and AV, the oil containing lower linoleic acid (C18:2) and higher oleic acid (C18:1) indicated the higher stability (i.e. lower TV) to the chemical oxidation or rancidity occurred during storage. As shown in Fig. 3, the TV of all samples was significantly (p < 0.05) increased during storage period. After the last week of storage, the TVs of the samples were 119.21, 105.23 and 90.91 for control and oil blends (POO:OO, 75:25 and 50:50), respectively. The results indicated that the TV was noticeably (p < 0.05) influenced by type of oil, storage time and their interaction. The single effect of storage time and its interaction with oil type showed the most and least significant (p < 0.05) effect on TV. During storage, the highest and least changes in TVs were exhibited by control sample and oil Blend 2 (POO:OO, 50:50), thus indicating the least and highest chemical stability shown by control sample and oil Blend 2 (POO:OO, 50:50) (Fig. 3). In fact, the oil Blend 2 (POO:OO, 50:50) containing the highest concentration level of oleic acid and least linoleic acid content
Free fatty acid (FFA): The FFA content resulting from the hydrolysis of triacylglycerol as well as further decomposition of hydroperoxides is a measure of the acidic components in the oil30. It is one of the most important indicators of oil deterioration. The changes in FFA content during 8 weeks storage are given in Fig. 4. There is a significant difference (p < 0.05) between the samples in term of FFA. The results indicated that FFA was significantly (p < 0.05) affected by all the independent variable effects. As shown in Table 1, storage time had the most considerable (p < 0.05) effect on FFA. Conversely, its interaction with frying oil type showed the least considerable (p < 0.05) effect on FFA. During 8 weeks storage, the FFA content of control and oil blends (POO:OO, 75:25 and 50:50) increased from 0.06% to 0.20, 0.23 and 30%, respectively (Fig. 4). During storage time, the least and highest changes in FFA values were observed by the control and the oil blend 2 (POO:OO, 50:50) (Fig. 4). According to Tan 31, the percentage of FFA is an indicator of the degree of hydrolysis of fats. Therefore, increase in FFA during storage time could be mainly due to the hydrolysis of the oils, although oxidative pathways can also result in the formation of free fatty acids. Iodine value (IV): The IV is a measure of unsaturation degree widely used to characterize fats and oils. A decrease in IV is consistent with decreasing the number of double bonds became oxidized. The changes in IV of all samples during 8 weeks storage are shown (Table 2). A decrease in IV was observed for all samples during storage time (Table 2). The decrease in IV increased with increase of time of storage. In general, all single and interaction effects of independent variables significantly (p < 0.05) affected the IV (Table 1). As shown in Table 1, the type of oil had the most significant (p < 0.05) effect on IV; while its interaction effect with storage time showed the least significant (p < 0.05) effect on IV. The changes in IV over 8 weeks of storage were and 48.69, 51.15 and 61.71 g of I2/100 g oil for control and oil blends (POO:OO, 75:25 and 50:50), respectively (Table 2). This observation could be attributed to the destruction of double bonds by the oxidation and/or polymerization. As stated by Naz et al. 32, oxidation, which consists of a complex series of chemical reactions, is characterized by a decrease in the total unsaturated content of the oil due to abstraction of hydrogen adjacent to double bond. Melting behaviour: The changes in melting point during 8 consecutive weeks of storage in accelerated condition are given in Table 2. This technique is used for studying various heatrelated phenomena in materials by monitoring associated changes in enthalpy. During 8 weeks storage, the melting point of control
Journal of Food, Agriculture & Environment, Vol.7 (3&4), July-October 2009
123
Table 2. The changes in physical properties of RBD palm olein and olive oil blends during storage (mean ± SD). Physical properties Week 0 Iodine value [g I2/100 g oil]
1 2 3 4 5 6 7 8 0
Melting point [°C]
1 2 3 4 5 6 7 8
Control (100)
Storage system (POO:OO) Ratio (75:25)
Aa Aab
57.39 ± 0.15
Ba
Aab
Bab
Aab
Bbc
Aabc
Bc
Abc
Bc
Ac
Bc
Aa
Ba
Aab
Bb
Abc
Bbc
Abc
Bbcd
Abc
Bcd
Ac
Bcd
Cb
19.39 ± 0.10 Bd
21.72 ± 0.11
POO Palm olein oil, OO Olive oil, SD Standard deviation, a,b,c,d,..h Significant difference at p < 0.05 within the group. at p < 0.05 between the groups.
and oil blends (POO:OO, 75:25 and 50:50) increased from 21.40 to 22.45, from 18.27 to 21.72 and from 14.51 to 19.41ºC, respectively. Thus the highest and least changes in melting points were shown by oil blend 2 (POO:OO, 50:50) and control sample (Table 2). In fact, the oil blend with highest IV (POO:OO, 50:50) showed the highest changes in melting point, while the control sample with the lowest IV exhibited the least changes in melting point (Table 2). This observation could be interpreted by the increase in the polyunsaturated to monounsaturated fatty acid ratio. The results indicated that melting point was significantly (p < 0.05) affected by all the independent variable effects. As shown in Table 1, type of frying media showed the most considerable (p < 0.05) effect on melting point; whereas the interaction effect of storage time and type of oil had the least significant (p < 0.05) effect on melting point. As illustrated by previous researchers 29, 30, the oxidation products, such as hydroperoxides, aldehydes, polar compounds, dimers and polymers increase during the storage. The presence of these compounds may also disturb the rearrangement of different polymorphic forms in oil. As their levels increase, such compounds would contribute to the changes in DSC cooling and melting curves. It is well known that the presence of free fatty acids, partial glycerides and oxidation products in oil, tends to shift the melting range to a lower temperature 16. The presence of oxidative decomposed products in oil also tends to shift the crystallization range to a lower temperature, thereby increasing the melting point 33. Conclusions The effect of storage conditions, namely oil blend formulation and storage time, on the physicochemical properties of control 124
Cb
19.31 ± 0.20
21.39 ± 0.09 Ac
22.45 ± 0.02
Cb
19.24 ± 0.21
21.36 ± 0.00
22.38 ± 0.00
Cb
19.22 ± 0.20 Bbcd
20.92 ± 0.09
22.17 ± 0.20
Cb
19.12 ± 0.00
20.90 ± 0.00 Abc
22.10 ± 0.19
Cb
18.86 ± 0.09
20.43 ± 0.20
22.08 ± 0.20
Cb
18.86 ± 0.09 Bb
20.06 ± 0.00
22.08 ± 0.00
Ca
14.51 ± 0.41
20.01 ± 0.10 Abc
22.03 ± 0.00
Bc
61.71 ± 2.02
18.27 ± 0.68
21.80 ± 0.20
Bc
63.56 ± 1.04 Bc
51.15 ± 1.48
21.40 ± 0.04
Bbc
64.99 ± 2.84
51.49 ± 1.94 Ac
48.69 ± 1.56
Bbc
65.24 ± 0.25
54.27 ± 0.56
50.09 ± 0.15
Babc
67.27 ± 2.10
54.33 ± 1.91
52.99 ± 0.86
Bab
69.23 ± 0.19 Bc
54.59 ± 1.61
53.47 ± 2.80
Cab
69.67 ± 0.00
55.46 ± 1.11 Aab
56.50 ± 0.42
Ca
71.03 ± 0.12
59.94 ± 1.01
56.85 ± 0.49
Ca
71.30 ± 0.14
60.98 ± 0.88
57.15 ± 0.07
Ratio (50:50)
Ba
64.65 ± 0.01
58.00 ± 1.41
Cb
19.41 ± 0.12 A,B,C
Significant difference
(POO) and oil blends (POO:OO, 75:25, 50:50) was investigated during 8 consecutive weeks. In general, the decrease in linoleic acid (C18:2) and/or increase in oleic acid (C18:1) resulted in significant (p < 0.05) increase in the chemical stability of frying media to the oxidative rancidity. The present results showed that the oil Blend 2 containing higher content of oleic acid (C18:1) and lower content of linoleic acid (C18:2) (POO:OO, 50:50) was found to be more stable during the storage time compared to the pure POO (100%) or oil blend 1 (POO:OO, 75:25). Thus, the present study offers that the chemical stability of oil to the oxidation or rancidity depends on not only the saturated fatty acid content but also on the mono- and polyunsaturated fatty acid contents. The present study suggested that with blending palm olein with other oils contain high amount of monounsaturated fatty acid, e.g. olive oil can produce the oil blend remained liquid at ambient temperature, thus indicating physically more stable frying medium than regular POO. References 1
Moreira, R. G., Palau, J. and Sin, X. 1995. Simultaneous heat and mass transfer during the deep fat frying of tortilla chips. J. Food Proc. Eng. 18:307-320. 2 White, J. P. 1991. Methods for measuring changes in deep-fat frying oils. J. Food Technol. 45:75-80. 3 Blumnthal, M. M. 1991. A new look at the chemistry and physics of deep-fat frying. J. Food Technol. 45:68-71. 4 Kristott, J. 2000. Fats and oils. In Kilcast, D. and Subramaniam, P. (eds). The Stability and Shelf-Life of Food. CRC Press, Boca Raton, Boston, New York & Washington DC, USA, pp. 279-309. 5 Paul, S. and Mittal, G. S. 1997. Regulating the use of degraded oil/fat in deep fat/oil food frying. Crit. Rev. Food Sci. Nut. 37:635-662. 6 Scanlon, M. G., Roller, R., Mazza, G. and Pritchard, M. K. 1994.
Journal of Food, Agriculture & Environment, Vol.7 (3&4), July-October 2009
Computerized video image analysis to quantify color of potato chips. Am. Potato J. 71:717-733. 7 Ross, K. A. and Scanlon, M. G. 2004. A fracture mechanics analysis of the texture of fried potato crust. J. Food Eng. 62:417-423. 8 Moyano, P. C., Troncoso, E. and Pedreschi, F. 2007. Modeling texture kinetics during thermal processing of potato products. J. Food Sci. 72:102-107. 9 Moreira, R. G., Sun, X. and Chen, Y. 1997. Factors affecting oil uptake in tortilla chips in deep fat frying. J. Food Eng. 31:485-498. 10 Valenzuela, B. A., Sanhueza, J. and Nieto, S. 2003. Antioxidantes naturales en alimentos funcionales. De la seguridad alimentaria a los beneficios en la salud. Gras Aceit. 54:295-303. 11 Boskou, D. and Visioli, F. 2003. Biophenols in table olives. In Vaquero, M. P., Garcia-Arias, T. and Garbajal, A. (eds). Bioavailability of Micronutrients and Minor Dietary Compounds. Metabolic and Technical aspects. Research Sign Post. 12 Yaghmur, A., Aserrín, A., Mizrahi, Y., Nerd, A. and Garti, N. 2001. Evaluation of argan oil for deep-fat frying. Lebensmittel-Wissenschaft und -Technologie 34:124-130. 13 Owen, R. W., Mier, W., Giacosa, A., Hull, W. E., Spiegelhalder, B. and Bartsch, H. 2000. Phenolic compounds and squalene in olive oils. The concentration and antioxidant potential of total phenols, simplephenols, secoiridoids, lignans and squalene. Food Chem. Toxicol. 38:647-659. 14 Warner, K. and Knowlton, S. 1997. Frying quality and oxidative stability of high-oleic corn oils. J. Am. Oil Chem. Soc. 74:1317-1321. 15 PORIM Test Methods 1995. Palm Oil Research Institute of Malaysia, Ministry of Primary Industries, Malaysia. 16 Che Man, Y. B. and Swe, P. Z. 1995. Thermal analysis of failed-batch palm oil by differential scanning calorimetry. J. Am. Oil Chem. Soc. 72:1529-1532. 17 AOCS 1998. Methods Ca 5a-40, Ca 6a-40, Cd 1-25, Ce 1-62. Official Methods and Recommended Practices of the American Oil Chemist’s Society, 5th edn. Champaign. 18 Chu, J. H., Sampson, C. R., Levine, A. S. and Fukada, E. 2002. The Joint Typhoon Warning Center Tropical Cyclone Best-Tracks, 19452000. NRL/MR/7540-02-16. 19 Shahidi, F. and Wanasundara, U. 2002. Methods for measuring oxidative rancidity in fats and oils. In Akoh, C. C. and Min, D. B. (eds). Food Lipids. Chemistry, Nutrition and Biotechnology. Marcel Dekker Inc., New York USA. 20 Foglia, T. A., Petruso, K. S. and Feairheller, H. 1993. Enzymatic interesterification of tallow sunflower oil mixtures. J. Am. Oil Chem. Soc. 70:281-285. 21 Mirhosseini, H., Tan, C. P., Hamid, N. S. A. and Yusof, S. 2008. Optimization the contents of Arabic gum, xanthan and orange oil affecting on turbidity, cloudiness, average particle size, polydispersity index and density in orange beverage emulsion. Food Hyd. 22:12121223. 22 Montgomery, D. C. 2001. Design and Analysis of Experiments. New York, USA, pp. 455–492. 23 Perkins, E. G. 1967. Formation of non-volatile decomposition products in heated fats and oils. Food Technol. 21:125-130. 24 Rossel, F. B. 1994. Measurement of rancidity. In Allen, J. C. and Hamilton, R. J. (eds). Rancidity in Foods. Elsevier Applied Science Pub., London, UK, pp. 27-30. 25 Augustine, M. A. and Chong, C. L. 1986. Measurement of deterioration in fats and oils. Food Tech. Malaysia 8:17-20. 26 Robards, K., Kerr, A. F. and Patsalides, E. 1988. Rancidity and its measurements in edible oils and snack foods a review. The Analyst 113:213-225. 27 Rossel, J. B. 1989. Measurement of rancidity. In Allen, J. C. and Hamilton, R. J. (eds). Rancidity in Foods. Elsevier Applied Science Pub., London, UK, pp. 27-30. 28 Nawar, W. W. 1985. Lipids. In Fennema, O. R.(ed.). Food Chemistry. New York, pp. 139-224. 29 Abdulkarim, S. M., Long, K., Lai, O. M., Muhammad, S. K. S. and
Ghazali, H. M. 2007. Frying quality and stability of high-oleic Moringa oleifera seed oil in comparison with other vegetable oils. Food Chem. 105:1382-1389. 30 Gan, H. L., Tan, C. P., Che Man, Y. B., NorAini, I. and Nazimah, S. A. H. 2005. Monitoring the storage stability of RBD palm olein using the electronic nose. Food Chem. 89:271-282. 31 Tan, Y. A. 1994. Analytical techniques in palm oil and palm kernel oil specifications. In Selected Readings on Palm Oil and Its Uses, Technical Committee of 1994 Palm Oil Familiarization Programme, Palm Oil Research Institute of Malaysia, Kuala Lumpur, Malaysia, pp. 78-90. 32 Naz, S., Siddiqi, R., Sheikh, H. and Sayeed, S.A. 2005. Deterioration of olive, corn and soybean oils due to air, light, heat and deep-frying. Food Res. Technol. 38:127-134. 33 Tan, C. P. and Che Man, Y. B. 1999. Differential scanning calorimetric analysis for monitoring the oxidation of heated oils. Food Chem. 67:177184.
Journal of Food, Agriculture & Environment, Vol.7 (3&4), July-October 2009
125