of specks of different colours in an image of a pulp ... designing the colour classification neural network. ..... tern Recognition Letters 1999; 20: 109â118. 3.
Neural Comput & Applic (2000)9:142–151 2000 Springer-Verlag London Limited
Monitoring the De-Inking Process through Neural NetworkBased Colour Image Analysis A. Verikas1,2, K. Malmqvist1, M. Bacauskiene2 and L. Bergman1 1
Centre for Imaging Science and Technologies, Halmstad University, Halmstad, Sweden; 2Department of Applied Electronics, Kaunas University of Technology, Kaunas, Lithuania
This paper presents an approach to determining the colours of specks in an image of a pulp being recycled. The task is solved through colour classification by an artificial neural network. The network is trained using fuzzy possibilistic target values. The number of colour classes found in the images is determined through the self-organising process in the two-dimensional self-organising map. The experiments performed have shown that the colour classification results correspond well with human perception of the colours of the specks. Keywords: Classification; Colour image processing; Fuzzy sets; Neural networks; Self-organising map
1. Introduction Colour image processing and analysis is increasingly used in industry, medical applications and other fields. Quality inspection, process control, material analysis, medical image processing are a few such examples [1–7]. It is obvious that the use of colour image processing in various fields of human activity will considerably grow in the near future. Therefore, the development of efficient computational models for real world problems is of crucial importance. One field of human activity with a rapidly growing potential use of colour image processing techniques is the paper and printing industries. This paper concerns the application of colour image processing and artificial neural network-based techniques in the Correspondence and offprint requests to: Antanas Verikas, Centre for Imaging Science and Technologies, Halmstad University, Box 823, S-301 18 Halmstad, Sweden. Email: antanas.verikas얀ide.hh.se
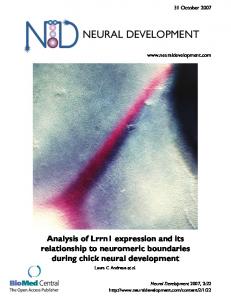
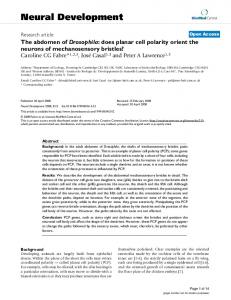
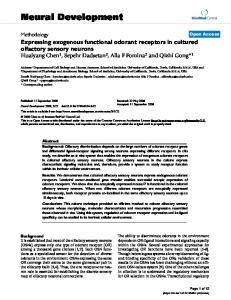
paper-making industry for monitoring of the deinking process. The aim of the work is to estimate the number of specks of different colours in an image of a pulp being recycled. Figure 1 shows an example of such an image. The need for such an analysis is twofold: first, in the ‘black-white’ analysis used today, the number of specks in the pulp may be underestimated; secondly, different colours may have different bleachability with different types of bleaching chemicals. Therefore, optimisation of the de-inking process may be possible by knowing the chromatic content of the pulp. The estimate is performed by classifying the colours of pixels of the image taken from a pulp sample. When solving a classification problem there are several choices of strategy, such as statistical, neural network or fuzzy sets. A combination of neural network and fuzzy set-based approaches has been
Fig. 1. An example of a pulp image.
Monitoring the De-Inking Process
adopted in this work. Artificial neural networks have proved themselves to be very useful in various applications, because they can represent a complex classification or mapping functions and discover the representations using powerful learning algorithms. An optimal set of parameters for defining the functions is learned by minimising an error functional. The fuzzy set-based approach provides a way for handling uncertainty and vagueness, as well as for dividing a problem into sub-problems [8–10]. There is one noteworthy problem that arises when designing the colour classification neural network. The problem is related to labelling the training data. It is not a trivial problem to assign labels for each pixel of a pulp image. It is not clear what labels pixels located on the borders of the specks should acquire. Besides, manual labelling is a very tedious procedure. In this work, we use an unsupervised training procedure that automatically performs fuzzy labelling of pixels used to train the network. This paper is organised as follows. In the next section, we briefly describe the colour space used. The method of intensity normalisation is given in Section 3. The tools and data are described in Section 4. A brief description of the network used is given in Section 5. The solution to the problem of data labelling is described in Section 6. The error function used to train the neural network is discussed in Section 7. Section 8 summarises the results of experimental investigations, and Section 9 presents the conclusions of the work.
2. Colour Space In general, colours differ in both chromaticity and luminance. A method of combining these variables is required in order to measure the difference between the colours. Colour image acquisition equipment such as a CCD colour camera obtains the RGB values, which can be directly used for representing colours in the RGB colour space. However, different acquisition equipment gives us different RGB values for the same incident light. One more drawback of the RGB colour space is that the metrics does not represent colour differences in a uniform scale, making it difficult to evaluate the similarity of two colours from their distance in the space. To meet the requirement of uniformity of distribution of colours, the Commission International de l’Eclairage (CIE) has recommended using one of two alternative colour spaces: the L*u*v* or L*a* b* colour space [11,12]. It is a common practice to use the L*a*b* colour space for describing absorb-
143
ing materials such as pigments and dyes. Several researchers have recently reported the superiority of the L*u*v* colour space over the L*a*b* space regarding uniformity and accuracy in colour gamut mapping [13,14]. Therefore, we used the L* u* v* colour space in all procedures that involve distance calculations. The L*u*v* colour space has an approximately uniform chromaticity diagram associated with it. To map the RGB values into the L*u*v* colour space, the RGB values are first transformed to the XYZ tristimulus values as follows: X = a11 R + a12 G + a13 B
(1)
Y = a21 R + a22 G + a23 B
(2)
Z = a31 R + a32 G + a33 B
(3)
with the coefficients aij being determined by a colourimetric characterisation of the hardware used. XYZ tristimulus values can describe any colour. It is often convenient to discuss ‘pure’ colour in the absence of luminance. For that purpose, the CIE defines x and y chromaticity co-ordinates: x=
X X+Y+Z
(4)
y=
Y X+Y+Z
(5)
A colour plots as a point in an (x, y) chromaticity diagram. The distribution of colours observed in the (x, y) chromaticity diagram is also non-uniform. A dominant wavelength correlates very non-uniformly with the perception of hue and excitation purity with the perception of saturation. Having XYZ tristimulus values, the L*u*v* colour space is defined as follows: L* = 116(Y/Yn)1/3 − 16, if Y/Yn ⬎ 0.008856 (6) L* = 903.3(Y/Yn), if Y/Yn ⱕ 0.008856
(7)
⬘ n
u* = 13L*(u⬘ − u )
(8)
v* = 13L*(v − v⬘n)
(9)
where the quantities u⬘, v⬘ and u⬘n, v⬘n are given by: u⬘ =
4X X + 15Y + 3Z
(10)
v⬘ =
9Y X + 15Y + 3Z
(11)
u⬘n =
4Xn Xn + 15Yn + 3Zn
(12)
v⬘n =
9Yn Xn + 15Yn + 3Zn
(13)
144
A. Verikas et al.
where Xn, Yn, Zn are the tristimulus values of X,Y and Z for the appropriately chosen reference white. It is clear from the formulae that the significance of a given difference in chromaticity is reduced, as the colour becomes darker. New measures are provided in the colour space, which correlate with hue and saturation more uniformly. For example, CIE hue-angle, Huv, and CIE u, v saturation, Suv [11]: Huv = arctan (v*/u*)
(14)
Suv = 13 [(u⬘ − u⬘n)2 + (v⬘ − v⬘n)2]1/2
(15)
The Euclidean distance measure can be used to measure the distance (⌬E) between the two points representing the colours in the colour space: ⌬Eⴱuv = [(⌬L*)2 + (⌬u*)2 + (⌬v*)2]1/2
(16)
To speed up the overall image analysis process, we use the colour space based on the colour difference signals f1, f2 and f3 when classifying colours by a neural network. The variables f1, f2 and f3 are obtained from R, G and B by performing a linear transform of the {R, G, B} vector [15]. The variables are given by: f1 = R ⫹ G ⫹ B, f2 = R ⫺ B and f3 = R ⫺ 2 G ⫹ B. The linear transformation RGB → f1f2f3 is much faster to perform than the nonlinear one RGB → L*u*v*.
3. Normalising Intensity The mode of intensity distribution of images recorded from different pulp samples may vary significantly. Some normalisation is, therefore, required to remove the variation. For that reason, the intensity of the images is linearly scaled to obtain a predefined value of the intensity mode. The actual value of the intensity mode is found from the smoothed intensity histogram. We perform the Gaussian convolution of a one-dimensional histogram signal f(x) to accomplish the smoothing. The convolution is given by [16]:
冕 册
F(x, ) = f(x)* g(x, ) =
冋
+⬁
f(u)
(17)
−⬁
1 −(x − u)2 exp du 1/2 (2) 22
with ‘*’ denoting a one-dimensional convolution and being the Gaussian deviation.
4. Tools and Data The equipment we use consists of a three-chip CCD colour camera, an X-Y board for scanning a pulp
sample, a frame-grabber, a PC, and software. The resolution used was such that an image consisting of 512 ⫻ 512 pixels was recorded from an area of approximately 1.0 ⫻ 1.0 mm2. A vast amount of training and validation data can be collected in our application. Computation time, however, severely limits the amount of data that can be used for designing the classification network. To collect more consistent training sets, which account for more variance with the same number of training samples, we perform condensation of training data by using a clustering technique. A set of pixels obtained from a colour image is condensed into a predefined number of clusters. Centres of the clusters thus obtained (‘generalised pixels’) make up the training and validation sets. Note that we remove outliers before the clustering starts. The data condensation is performed separately for every image used [17].
5. The Network Used The network used is a single hidden layer perceptron. Let oj(q) denote the output signal of the jth neuron in the qth layer induced by presentation of an input pattern x, and wij(q) the connection weight coming from the ith neuron in the (q − 1) layer to the jth neuron in the qth layer. Assume that x is an augmented vector, i.e. x0 = 1. Then oj(q) = f(netj(q))
冘
(18)
nq−1 (q) j
net
=
wij(q) oi(q−1)
(19)
i=0
where netj(q) stands for the activation level of the neuron, nq−1 is the number of neurons in the q − 1 layer and f (net) is a sigmoid activation function given by f (net) = 1/(1 ⫹ exp(⫺net)).
6. Data Labelling A common approach to determining the teaching signals is to assign a crisp target value to each training sample in the learning set Xl = {(x1, c1), (x2, c2) . . . (xN, cN)}, where (xn 苸 RK is the nth data sample, cn 苸 I = {1, 2, . . ., Q} is the class label, and Q is the number of classes. The target values tl, . . . , tn are encoded according to the scheme 1-of-Q, i.e. tnk = 1, if cn = k and tnk = 0, otherwise. The approach adopted in this paper assumes that the target values are encoded according to the
Monitoring the De-Inking Process
scheme Q-of-Q, i.e. the membership of each pattern in every class is considered. The membership degrees are used as the target values to train the network. A similar approach to neural network training has been taken by Banerjee et al. [18], Pal and Mitra [19] and Sarkar et al. [20]. 6.1. Procedure for Determining Target Values The target values are determined through the following seven-step procedure: 1. Evolve a globally ordered two-dimensional selforganising map [21] using u* and v* components of the generalised pixels. Use the topographic product to evaluate the ordering obtained in the map [22]. 2. Divide the map into Q−1 regions, where Q is the number of colour classes of the specks. Use a separate region for each chromatic colour class. Represent the ‘Black’ and ‘White’ colour classes by the same achromatic region. 3. Determine membership functions for each of the Q colour classes by analysing the regions of the 2D map. The ‘White’ and ‘Black’ colour classes acquire the same membership functions at this step. 4. Evolve a globally ordered one-dimensional map for the L* component of the generalised pixels mapped onto the achromatic region of the 2D map using frequency sensitive competitive learning [23]. 5. For each of the Q colour classes, determine membership functions on the axis of the CIE lightness variable L* [12] using information from the 2D and 1D maps. 6. Aggregate the membership functions obtained in steps 3 and 5. 7. Compute the membership degrees of each generalised pixel in every class using the aggregated membership functions. Use the membership degrees obtained as target values for training the network. Next, we briefly describe the main topics of the procedure. 6.2. Topographic Product Let nOk (j) denote the kth nearest neighbour of node j of the map with the distances measured in the output space. For example, the distance for the second nearest neighbour is given by
145
dO (j, nO2 (j)) =
dO(j, i)
min
(20)
O i苸OZ{j,n1 (j)}
Similarly, nIk (j) denotes the kth nearest neighbour of node j with the distances measured in the input space between the weight vectors wj and wnkI (j): dI (wj, wnI2(j)) =
min
dI(wj, wi)
(21)
I
i⑀OZ{j,n1(j)}
The following neighbourhood preservation measures the so-called topographic product can then be derived from the distances [22] Jp(k) =
1 M
冘 冉写 M
j=1
k
冊
1/2k
S1 (j, l)S2 (j, l)
l=1
(22)
where M stands for the number of nodes in the map, and S1 and S2 are given by S1(j, k) = S2(j, k) =
dI(wj, wnOk(j)) dI(wj, wnkI (j)) dO(j, n0k (j)) dO(j, nIk(j))
(23) (24)
The deviation of Jp above or below unity indicates whether the dimension of the map is too large or too small, respectively, for preserving neighbourhood relations. We use the Jp to ensure that the selforganising process ended in a globally ordered map. 6.3. Dividing the 2D Map into Regions In most of the runs performed, the globally ordered map nicely represented a cross-section of the L*u* v* colour solid in a way that the main diagonals of the map coincided with the basic hue-pairs, red and green, and yellow and blue. The opponent colours red-green and yellow-blue are often called basic hue-pairs. Having such a map, first we find the achromatic region by thresholding the map with some userdefined chroma C2uv = (uⴱ2 ⫹ vⴱ2)1/2 threshold. Regions of the basic hue pairs, red and green, yellow and blue are then easily found at the corners of the map. More colour classes can be introduced by splitting some of the regions, if large chromaticity variations are observed in the map. Each colour class thus defined is represented by several nodes (reference patterns) of the map. 6.4. Membership Functions on the 2D Map Let’s assume that the jth class is represented by Nj reference patterns (weight vectors). Let d(xn, wij) be
146
A. Verikas et al.
the distance between the nth input pixel xn and the ith weight vector of the jth class d(xn, wij) = (xn − wij)t ⌳ij (xn − wij), i = 1, 2, %, Nj where ⌳ij =
冋
(sij1)−1 % (sijm)−1
%
(25)
册
(26)
with sijk being the variance of the kth component of the data points for which the weight vector wij is the closest one, and Nj is the number of weight vectors representing the jth class. Let wkj be the closest weight vector to pixel xn amongst all the weight vectors representing the class Cj: k = arg
min
d(xn, wij),
j = 1, 2, %, Q
i=1,2,%,Nj
(27) where Q is the number of colour classes. We consider the colour classes as fuzzy sets. The membership degree of the pixel xn in the fuzzy set Cj is then given by the so-called -function. The function, being in the range [0,1], for xn 苸 RK is defined to be [24]: Cj(x ) = Cj (x , w , ␥ ) = ␥kj 2(1 − 储xn − wkj储/␥kj)2, for ⱕ 储xn − wkj储 ⱕ ␥kj 2 n
n
k j
k j
冦
1 − 2(储xn − wkj储/␥kj)2, for 0 ⱕ 储xn − wkj储 ⱕ
(28)
␥ 2
k j
with ␥ ⬎ 0 being the radius of the -function, 储x − wkj储 is the Euclidean norm, and wkj is the central point at which Cj, (wkj, wkj, ␥kj) = 1. The radii of the functions are found from the analysis of the 2D map. Let Xkj be a set of pixels for which the weight vector wkj is the closest one k j
n
d(xn, wil),
min
∀xn 苸 Xkj
i=1,%,k,%,Nl l=1,%,j,%,Q
(29) Then the radius ␥ is given by k j
␥kj = md + ␣sd where md =
Sd =
1 card{Xjk}
冋
冘
(30)
d(xn, wkj)
k x 苸Xj
(31)
n
1 card{Xkj) − 1
冘
n
{d(xn, wkj) − md}2 k
x 苸Xj
6.5. Membership Functions on the Axis of the CIE Lightness Variable L* Membership functions on the axis of the CIE lightness variable L* are defined as follows:
Cj (xn) =
White (xn) =
Black (xn) =
0, otherwise
k,j = arg
and ␣ is a constant. The radii used are large enough to create a considerable overlap between the membership functions centred on the neighbouring weight vectors representing different colour classes. On the other hand, the radii chosen are such that there is no overlap between the membership functions centred on two ‘most saturated weight vectors’ representing the opponent colours. We assume here that the basic hue-pairs, red and green, and yellow and blue have emerged on the u*v* map during the self-organising process.
册
1/2
(32)
1
冋
册
兩L − Lⴱj 兩 1+ qj ⴱn
冦
1, Lⴱn ⬎ LⴱWhite
冦
1, Lⴱn ⬍ LⴱBlack
1+
冋
1 ⴱ White
L
j 苸 Chromatic (33)
,
p
册
− Lⴱn
qWhite
p
, Lⴱn ⱕ LⴱWhite (34)
1 , Lⴱn ⱖ LⴱBlack (35) L − LⴱBlack p 1+ qBlack
冋
ⴱn
册
where the positive constants p and q are the fuzzy generators controlling the amount of fuzziness in the set, Lⴱn is the lightness value of the pixel xn, Lⴱj is the reference value of the lightness variable L* for the jth class, j is the standard deviation of the lightness variable in the jth class, and Chromatic is the set of chromatic colour classes. The parameters Lⴱj and j are found in the following way. For the chromatic colour classes, the parameters depend upon the pixel xn being analysed and the statistics of the 2D map. Let us assume that wkj is the closest weight vector to the pixel xn amongst all the weight vectors representing the class Cj in the 2D map, i.e. k is given by Eq. (27). Then Lⴱj and j are set to the mean value and standard deviation, respectively, of the lightness component of the training pixels mapped onto the weight vector wkj at the end of the training process. LⴱWhite and LⴱBlack acquire the value of the largest and the smallest weight vector, respectively, of the
Monitoring the De-Inking Process
147
1D map. Since we use the frequency sensitive learning, the weight vectors of the 1D map are approximately equally probable. The weight vectors of the map are visualised as a ‘grey bar’. The transition point between the ‘White’ and ‘Black’ parts of the 1D map is found by visual inspection of the grey bar or by analysing the variation coefficient of the L* component of the pixels mapped onto the different weight vectors. Since the weight vectors of the map are approximately equally probable and the chromatic pixels are not used in the training process, the weight vectors located around the transition point exhibit larger values of the variation coefficient than the other weight vectors. White and Black are then calculated from the lightness values of the pixels mapped onto the ‘White’ and ‘Black’ parts of the 1D map, respectively. Note that only pixels mapped onto the achromatic region of the 2D map are used in these calculations.
The aggregated membership functions Cj (xn) are obtained by applying the t-norm operator to the functions Cj (xn) and Cj (xn) defined on the 2D map and the axis of the lightness variable L*, respectively. For example, Red (xn) = t{Red (xn), Red (xn)}, where t is the t-norm operator. The algebraic product has been adopted as the t-norm operator in this application. Next, the membership values are normalised to occupy the unit interval [0,1]:
Cj (xn) − min max − min
, j = 1, 2, %, Q
(36)
where
min = min Cj(xn)
(37)
max = min Cj (xn)
(38)
j=1,2,%,Q
and j=1,2,%,Q
This implies that the membership assignment is possibilistic [8,20]. Finally, in the last step, the contrast within the set of membership values Cj (xn) is increased, i.e. the ambiguity in making a decision about the targets is decreased: Cj (xn) =
再
2[Cj (xn)]2, 1 − 2[1 − Cj (xn)]2
We use the error back propagation algorithm to train the network. The network is trained by minimising the weighted sum squared error augmented with the additional regularisation term E(w) =
(39) for 0 ⱕ Cj (xn) ⱕ 0.5 , j = 1, 2, %, Q otherwise
The c (x)s are the target values used to train the network.
1 2 +
冘再 冘 冘 N
Q
vn
n=1 Nw
(oj(L)n (w) − tnj)2
j=1
冎
(40)
w2i
i=1
where Q is the number of classes, N is the number of training samples, Nw is the number of weights in the network, wi is the ith weight of the network,  is the regularisation coefficient, and vn is the error weight for the nth input pattern. The error weight vn is given by N Qcard{Ck}
(41)
k = arg max {nCi}
(42)
vn =
6.6. Aggregating the Membership Functions
Cj (xn) =
7. Error Function
i=1,%,Q
where card{Ck} is the cardinality of the fuzzy set Ck
冘 N
card {Ck} =
n Ck
(43)
n=1
We assume that the occurrence of each class in operation is equally likely, but the cardinalities of the fuzzy sets representing the training data from the different classes may differ significantly. The following motivation can then be given for the use of the error weight vn. Lowe and Webb have shown that if a network with nonlinear hidden and linear output nodes is trained with a 1-of-Q target coding to minimise squared error, the weights chosen in the first layer projects the training patterns by a nonlinear transformation into a distribution at the output of the hidden nodes so as to maximise a criterion given by [25,26] J = Tr{SBS+T}
(44)
⫹ T
where S is the pseudo-inverse of ST. The matrices ST and SB are interpreted as being the total and weighted between class covariance matrices of the hidden neuronal outputs ST = ZZT
(45)
SB = ZDTDZT
(46)
where Z is the mean-subtracted set of the hidden neuronal outputs and D is the mean-subtracted set
148
A. Verikas et al.
of target patterns of the training set. For the 1-ofQ target coding the matrix SB is given by [25]
冘 Q
SB =
N2k (z¯k − z¯) (z¯k − z¯)T
(47)
k=1
where Nk is the number of patterns in class Ck, z¯k and z¯ are the mean value of the vector of the hidden neuronal outputs over patterns in class k and over all patterns in the training set, respectively. As can be seen from the SB equation, networks trained with a 1-of-Q target coding bias strongly in favour of classes with largest membership. To reduce the biasing, the error weight vn was included into the error function.
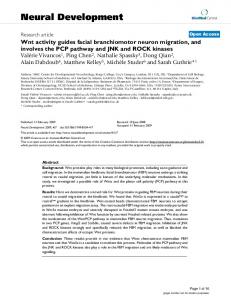
8. Experimental Tests 8.1. Data for Training the Classification Network In this study, we used 56 images recorded at three different steps of the de-inking process. After the condensation process [17] (the clustering process) we obtain a set of generalised pixels. Each generalised pixel represents a cluster of primary pixels. The generalised pixels representing ‘large’ clusters are further used as a learning set Xl to train the classification network. We consider a cluster ⍀i as being large if card{⍀i} ⬎ ␦large
(48)
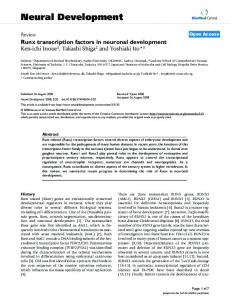
where card{⍀i} is a cardinality of the set ⍀i and ␦large is a threshold. The value of ␦large = 20 has been used in the experiments. 3305 generalised pixels were obtained after the condensation process. Figure 2 shows the distribution in the u*v* plane
Fig. 2. Distribution of the generalised pixels in the u*v* plane at the beginning of the de-inking process.
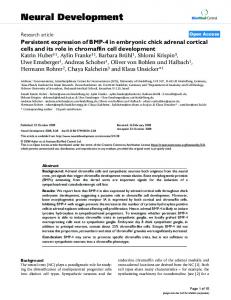
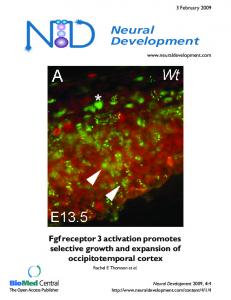
of the generalised pixels obtained after the clustering of 24 images recorded at the beginning of the deinking process. As can be seen from the figure, the red region of the colour space is much more occupied by the generalised pixels than the green one. Most of the generalised pixels are situated in the red-blue region of the colour space. 8.2. Self-organising Map (SOM) We used the 2D SOM network with 7 ⫻ 7 nodes and the 1D SOM with 16 nodes to obtain the fuzzy target values for training the classification network. In most of the runs performed, we have obtained the globally and locally ordered 2D map. The main diagonals of the map coincided with the basic huepairs, red and green, and yellow and blue. Figure 3 displays the colour ordering obtained in the 2D SOM when learning process has converged. The achromatic region found is shown in the uniform grey. The ordered SOM greatly simplifies the task of assigning class labels to the weight vectors (reference patterns) of the map. For example, the three nodes at the right bottom corner of the map stand for the Green colour class. Due to overrepresentation of the red region in the training set, the red colour dominates in the map obtained. For that reason, the achromatic region has been moved aside from the centre of the map. 8.3. Classification After some analysis of the 2D SOM, the number of colour classes was chosen to be equal to six.
Fig. 3. An example of a thresholded 2D map.
Monitoring the De-Inking Process
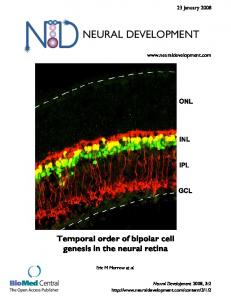
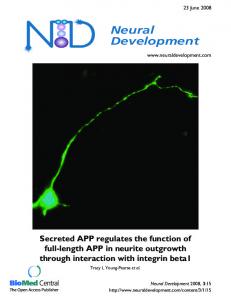
Fig. 4. Examples of pulp images before and after the classification.
149
150
A. Verikas et al.
White, Black, Blue, Yellow, Red and Green were the colour classes used. After some experiments, the network with six nodes in the hidden layer was adopted for the application, and the fuzzy generators were set to the values q = 2 and p = 3. Figure 4 displays four pulp images before and after the classification. The visual inspection of the classification results has shown that the results obtained correspond well with the human perception of colours of the specks in the original images. We have also experimented with a 1-of-Q colour encoding scheme defined by the following selector function with range in the class label set I = {1, 2, . . ., Q} S(xn) = arg min Cj (xn)
(49)
j=1,%,Q
where Ci (xn) is given by Eq. (39). The target vector t(xn) is then given by tnk =
再
1, if k = S(xn) 0, otherwise
,
k = 1, %, Q
(50)
The colour classification results obtained based on the 1-of-Q colour encoding scheme were less robust and much more sensitive to the composition of the training set.
9. Conclusions We have presented a technique for finding colour specks in an image of a pulp being recycled. A feedforward artificial neural network is used to solve the task. The network is trained using fuzzy possibilistic target values. Therefore, a tedious and time consuming procedure of exact data labelling is not required for accomplishing the training process. The experiments performed have shown that the colour classification results obtained from the neural network correspond well with the human perception of colours of the specks. In the data set analysed, most of the specks occupied the red-blue region of the u*v* plane. Only a fraction of the specks detected could be considered as possessing a black colour. Acknowledgements. We gratefully acknowledge the support we have received from The Foundation for Knowledge and Competence Development. We also thank two anonymous reviewers for their valuable comments on the manuscript.
References 1. Barni M, Cappellini V, Mecocci A. Colour-based detection of defects on chicken meat. Image & Vision Computing 1997; 15: 549–556
2. Kankanhalli MS, Mehtre BM, Huang HY. Color and spatial feature for content-based image retrieval. Pattern Recognition Letters 1999; 20: 109–118 3. Mansfield JR, Sowa MG, Payette JR, Abdulrauf B, Stranc MF, Mantsch HH. Tissue viability by multispectral near infrared imaging: A fuzzy C-means clustering analysis. IEEE Trans Medical Imaging 1998; 17(6): 1011–1018 4. Nakano K. Application of neural networks to the color grading of apples. Computers and Electronics in Agriculture 1997; 18: 105–116 5. Verikas A, Malmqvist K, Malmqvist L, Bergman L. A new method for colour measurements in graphic arts. Color Research & Application 1999; 24(3): 185–196 6. Waxman AM, Seibert M, Gove AN, Fay DA, Cunningham RK, Bachelder IA. Visual learning of objects: Neural models of shape, color, motion and space. In: Zurada JM, Marks RJ, Robinson CJ (eds). Computational Intelligence Imitating Life, IEEE Press, 1994, pp 237–251 7. Xu L, Jackowski M, Goshtasby A, Roseman D, Bines S, Yu C, Dhawan A, Huntley A. Segmentation of skin cancer image. Image & Vision Computing 1999; 17: 65–74 8. Klir GS, Yuan B. Fuzzy sets and Fuzzy Logic – Theory and applications. Prentice-Hall, Englewood Cliffs, 1995 9. Yager RR, Zadeh LA (eds). Fuzzy Sets, Neural Networks and Soft Computing. Van Nostrand Reinhold, 1994 10. Zimmermann HJ. Fuzzy Set Theory and its Applications, Kluwer Academic, 1996 11. Hunt RWG. Measuring colour. Ellis Horwood, 1991 12. Wyszecki G, Stiles WS. Color Science. Concepts and Methods, Quantitative Data and Formulae, 2nd edn. John Wiley & Sons, 1982 13. Granger EM. Is CIE L*a*b* good enough for desktop publishing? Light Source, Inc. San Rafael, CA, USA, http://www.Is.com/support/cielab.html 14. Katoh N, Ito M, Ohno S. Three-dimensional gamut mapping using various color difference formulae and color spaces. Journal of Electronic Imaging 1999; 8(4): 365–379 15. Verikas A, Malmqvist K, Bergman L. Colour image segmentation by modular neural network. Pattern Recognition Letters 1997; 18: 173–185 16. Witkin AP. Scale space filtering: a new approach to multi-scale description. Ullman S, Richards W (eds). Image Understanding, Ablex Publishing, 1984, pp 79–95 17. Verikas A, Malmqvist K, Bergman L, Signahl M. Colour classification by neural networks in graphic arts. Neural Computing & Applications 1998; 7: 52–64 18. Banerjee M, Mitra S, Pal SK. Rough fuzzy MLP: Knowledge encoding and classification. IEEE Trans Neural Networks 1998; 9: 1203–1216 19. Pal SK, Mitra S. Multilayer perceptron, fuzzy sets and classification. IEEE Trans Neural Networks 1992; 5: 683–697 20. Sarkar M, Yegnanarayana B, Khemani D. Backpropagation learning algorithms for classification with fuzzy mean square error. Pattern Recognition Letters 1998; 19: 43–51 21. Kohonen T. Self-organisation and associative memory. Springer-Verlag, 1988
Monitoring the De-Inking Process
22. Bauer HU, Pawlezik KR. Quantifying the neighbourhood preservation of self-organizing feature maps. IEEE Trans Neural Networks 1992; 3: 570–579 23. Verikas A, Malmqvist K. Increasing colour image segmentation accuracy by means of fuzzy postprocessing. In: Proceedings of the IEEE International Conference on Artificial Neural Networks, ICANN-95, vol. 4, Perth, Australia, 1995, pp 1713–1718 24. Pal SK, Pramanik PK. Fuzzy measures in determining
151
seed points in clustering. Pattern Recognition Letters 1986; 4: 159–164 25. Lowe D, Webb AR. Optimised feature extraction and the Bayes decision in feed-forward classifier networks. IEEE Trans Pattern Analysis and Machine Intelligence 1991; 13: 355–364 26. Webb AR, Lowe D. The optimised internal representation of multilayer classifier networks performs nonlinear discriminant analysis. Neural Networks 1990; 3: 367–375