Tropical Medicine and Infectious Disease Perspective
Monitoring the Path to the Elimination of Infectious Diseases John M. Drake 1,2,3, * 1 2 3 4 5
*
and Simon I. Hay 4,5
Odum School of Ecology, University of Georgia, Athens, GA 30602-2202, USA Center for the Ecology of Infectious Diseases, University of Georgia, Athens, GA 30602-2202, USA Department of Zoology, University of Oxford, Oxford OX2, UK Institute for Health Metrics and Evaluation, University of Washington, Seattle, WA 98121, USA;
[email protected] Big Data Institute, Li Ka Shing Centre for Health Information and Discovery, University of Oxford, Oxford OX3 7LF, UK Correspondence:
[email protected]; Tel.: +1-706-583-5539
Received: 2 March 2017; Accepted: 21 June 2017; Published: 26 June 2017
Abstract: During the endgame of elimination programs, parasite populations may exhibit dynamical phenomena not typical of endemic disease. Particularly, monitoring programs for tracking infection prevalence may be hampered by overall rarity, the sporadic and unpredictable timing and location of outbreaks, and under-reporting. A particularly important problem for monitoring is determining the distance that must be covered to achieve the elimination threshold at an effective reproduction number less than one. In this perspective, we suggest that this problem may be overcome by measuring critical slowing down. Critical slowing down is a phenomenon exhibited by nonlinear dynamical systems in the vicinity of a critical threshold. In infectious disease dynamics, critical slowing down is expressed as an increase in the coefficient of variation and other properties of the fluctuations in the number of cases. In simulations, we show the coefficient of variation to be insensitive to under-reporting error and therefore a robust measurement of the approach to elimination. Additionally, we show that there is an inevitable delay between the time at which the effective reproduction number is reduced to below one and complete elimination is achieved. We urge that monitoring programs include dynamical properties such as critical slowing down in their metrics for measuring achievement and avoid withdrawing control activities prematurely. Keywords: bifurcation delay; critical slowing down; elimination; endgame; smallpox
1. Introduction Eradication of an infectious disease is the ultimate success in public health [1]. Smallpox is the only infectious disease of humans to have been eradicated to date [2]. Significant, albeit fragile, progress has been made toward the eradication of polio [3], dracunculiasis [4], and yaws [5]. Moreover, local elimination plans are ongoing for malaria [6], lymphatic filariasis [7,8], measles [9], rubella [10], onchocerciasis [11,12], schistosomiasis [13], and trypanosomiasis [14]. Epidemiology, surveillance, and the changing effectiveness of control actions all present unique “end game” challenges in eradication and elimination efforts [1,15]. A particularly intractable problem has been maintaining the political will to continue interventions as the number of new cases declines, partly because of the declining marginal returns on investment when measured in terms of the reduction in cases and partly because of the difficulty of monitoring sparsely occurring disease episodes among largely inaccessible populations [14,16,17]. If surveillance systems for these diseases could identify the approach to ultimate elimination, in contrast to merely marginal declines in the number of new cases, philanthropic funders, public health officials, and others might be better armed Trop. Med. Infect. Dis. 2017, 2, 20; doi:10.3390/tropicalmed2030020
www.mdpi.com/journal/tropicalmed
Trop. Med. Infect. Dis. 2017, 2, 20
2 of 7
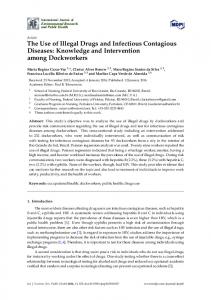
to both justify and target efforts during the “longest last mile,” especially if it can be shown that the tipping point has been crossed and all that remains is to sustain the gains already achieved and allow transmission to run its course [18–20]. Here we propose a new approach to monitoring the path to elimination, based on recent developments in the theory of leading indicators for dynamical transitions [21]. Leading indicators are statistical patterns exhibited by certain complex systems as they approach a tipping point between alternative states, primarily due to critical slowing down, in which the tendency for a dynamical system to return to its steady state is increasingly weakened [21]. In epidemiology, endemism and disease-free status are alternative states, with the vaccination threshold acting as the tipping point between [22]. Although not all switching among alternative states is preceded by leading indicators [23], the transcritical bifurcation that occurs in disease elimination does, implying that the sequence of case reports will contain statistical signatures of the approach to elimination [22,24]. Thus, leading indicators based on critical slowing down may provide a means to measure how successful elimination efforts have been, particularly by indicating if the tipping point has already been crossed or is close at hand [24]. Distinguishing these conditions is clearly important for policy. If the threshold has already been crossed, elimination only requires that the current policy be maintained while transient chains of transmission are allowed to peter out; alternatively, if the threshold is near but not yet crossed, then increases in effort or pulse interventions such as supplementary vaccination campaigns may be required to push the contagious process over the tipping point. Our previous studies developed the theory of critical slowing down in disease transmission systems [22,24], but did not address practical issues such as under-reporting or extrapolating from measured signals to predict the time of threshold crossing. Smallpox illustrates the potential of this theory for monitoring progress toward disease elimination. Smallpox is an acute and often lethal infection, and was globally eradicated in the wild in 1977 [2]. Nation states differed in both the delivery of vaccination and the speed of elimination, but it was frequently on the time scale of decades, with a rapid decline followed by a long tail. Presumably, the vaccination threshold was crossed sometime before or during the decline phase. The simple question is, when? 2. Model We illustrate critical slowing down in smallpox elimination with a simple model of transmission and vaccination (Figure 1). This model begins in the endemic state and evolves stochastically assuming a policy of newborn vaccination beginning in year 350. Vaccination programs are imperfect and require time to ramp up. To realistically represent the roll-out of a vaccination campaign, we assumed that disease prevalence and immunity at the start of the simulation was at the natural endemic equilibrium. Vaccine coverage started at zero and increased asymptotically toward 96% (Figure 1). The time the vaccination threshold was crossed is plotted as a vertical dashed line. As expected, before vaccination begins, the dynamics fluctuate around an endemic equilibrium. During the campaign, the number of cases declined, crossing the deterministic vaccination threshold in year 381. The pathogen was not eliminated until much later. This long tail is an example of bifurcation delay. Both the approach to the tipping point (dashed line in Figure 1) and the transmission tail are of interest. From a health policy standpoint, the distinction between these two—and the ability to recognize which phase one is in—is key. If vaccination coverage can be maintained long enough once the threshold has been reached, then elimination is sure to occur eventually. By contrast, if the threshold has not been reached, then elimination is very unlikely and any stochastic extinction that may occur is in a fragile state that can be reversed at any time. During the time between crossing the threshold and elimination, it is important not to reduce vaccination pressure, since ceasing vaccination during this period would allow the disease to return to pre-threshold levels and the gains of the campaign will have been wasted despite having achieved the necessary coverage to ensure elimination.
Trop. Med. Infect. Dis. 2017, 2, 20 Trop. Med. Infect. Dis. 2017, 2, 20
3 of 7 3 of 7
Figure 1. 1. Simulation Simulation of of smallpox smallpox elimination elimination through through vaccination. vaccination. The The gray gray line line shows shows the the number number Figure of infected infected individuals individuals over over time. time. The The blue blue line line shows shows vaccination vaccination coverage, coverage, which which approaches approaches aa of maximum at 0.96. The green line shows the deterministic equilibrium that would be achieved the maximum at 0.96. The green line shows the deterministic equilibrium that would be achieved ifif the vaccination rate was held constant and the time-dependent value. Disease dynamics are given by vaccination rate was held constant and the time-dependent value. Disease dynamics are given by aa stochastic SIR SIR model model with with states states S, S, I,I, and and RR for for the the number number of of susceptible, susceptible, infected, infected, and and immune immune stochastic persons, respectively; dS/dt = μ(S + I ++ R)(1−ρ) − βSI/(S + I + R) ξSR)− –μS, persons, respectively; mean meanfield fieldequations equations dS/dt = µ(S I + R)(1− ρ) − βSI/(S + –I + ξSdI/dt − µS,= βSI/(S + I + R) + ξS − μI − γI, and dR/dt = γI + μ(S + I + R)(ρ) − μR; and parameters for transmission β= dI/dt = βSI/(S + I + R) + ξS − µI − γI, and dR/dt = γI + µ(S + I + R)(ρ) − µR; and parameters for 0 (γ + μ) ≈ 121.7, recovery γ = 365/12 ≈ 30.4, demography μ = 1/60, externally acquired infection ξ R transmission β = R0 (γ + µ) ≈ 121.7, recovery γ = 365/12 ≈ 30.4, demography µ = 1/60, externally= 0.001, speed of vaccination outofσ vaccination = −0.05, maximum vaccination = 0.96, and acquired infection ξ = 0.001,roll speed roll outpossible σ = −0.05, maximumcoverage possibleavaccination time thatavaccination s =vaccination 100. All rates are in Theinfunction = a(1 − exp[σ(t coverage = 0.96, and begins time that begins s =units 100. of Allyears. rates are units ofρ(t) years. The function− s)]) =isa(1 the time-dependent vaccination rate. Total population sizepopulation in this simulation 100,000 ρ(t) − exp[σ(t − s)]) is the time-dependent vaccination rate. Total size in thiswas simulation individuals. Solutions were obtained using the adaptive tau-leaping algorithm [25]. Parameters was 100,000 individuals. Solutions were obtained using the adaptive tau-leaping algorithm [25]. follow Ferguson al. [26]. et al. [26]. Parameters followetFerguson
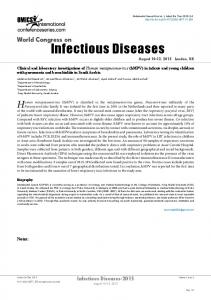
Both the approach to the tipping point (dashed line in Figure 1) and the transmission tail are of Next, we consider whether these phases can be distinguished in data that can be derived from interest. From a health policy standpoint, the distinction between these two—and the ability to surveillance. To reflect real-world data collection, we first aggregated simulated cases to annual recognize which phase one is in—is key. If vaccination coverage can be maintained long enough once reporting intervals. Recent theoretical developments predict that the coefficient of variation in the the threshold has been reached, then elimination is sure to occur eventually. By contrast, if the number of cases in a moving window should be a sensitive and specific indicator of the approach to the threshold has not been reached, then elimination is very unlikely and any stochastic extinction that vaccination threshold [22]. Indeed, calculating the coefficient of variation (CV; the ratio of the standard may occur is in a fragile state that can be reversed at any time. During the time between crossing the deviation to the mean) in a moving window over the annualized simulated cases in Figure 1 shows a threshold and elimination, it is important not to reduce vaccination pressure, since ceasing characteristic dynamical pattern: (i) stationary fluctuations in the pre-campaign era, (ii) substantial and vaccination during this period would allow the disease to return to pre-threshold levels and the gains sustained rise in CV beginning with the start of the elimination campaign during the approach to the of the campaign will have been wasted despite having achieved the necessary coverage to ensure vaccination threshold, (iii) erratic fluctuations following the achievement of the vaccination threshold but elimination. preceding elimination, and (iv) a final decline as the pathogen approaches complete elimination (Figure 2). Next, we consider whether these phases can be distinguished in data that can be derived from Of course, if one has perfect case reporting, then it is simple enough to inspect the number of case surveillance. To reflect real-world data collection, we first aggregated simulated cases to annual reports over time to determine that the elimination campaign is continuing to realize results—although reporting intervals. Recent theoretical developments predict that the coefficient of variation in the it is important to note that this will not tell us if the vaccination threshold has been reached. In order number of cases in a moving window should be a sensitive and specific indicator of the approach to to determine if our method works with incomplete case reporting, we looked at case reports that were the vaccination threshold [22]. Indeed, calculating the coefficient of variation (CV; the ratio of the binomial samples of 95%, 50%, 10%, and 5% of the true number of cases in each year. Surprisingly, standard deviation to the mean) in a moving window over the annualized simulated cases in Figure despite the fact that case reports differ by three orders of magnitude and themselves contain no 1 shows a characteristic dynamical pattern: (i) stationary fluctuations in the pre-campaign era, information about the true prevalence in the population, the statistical signals indicating the approach (ii) substantial and sustained rise in CV beginning with the start of the elimination campaign during the approach to the vaccination threshold, (iii) erratic fluctuations following the achievement of the
Trop. Med. Infect. Dis. 2017, 2, 20
4 of 7
to the vaccination threshold were practically indistinguishable (Figure 3a). This result shows that Trop. Med. Infect. Dis. 2017, 2, 20 4 ofit7 may be possible to monitor the path to elimination by taking new approaches to processing surveillance data, even if threshold they are subject to a significant amount Details of these simulations vaccination but preceding elimination, and of (iv)under-reporting. a final decline as the pathogen approaches are provided in online supplementary material. complete elimination (Figure 2).
Figure 2. 2. Statistical to the the vaccination vaccination thresholds thresholds in in simulated simulated smallpox smallpox Figure Statistical signal signal of of the the approach approach to elimination. Contagion systems exhibit critical slowing down in the approach to a tipping point such elimination. Contagion systems exhibit critical slowing down in the approach to a tipping point such as as the vaccination threshold. The coefficient of variation in a moving window provides the vaccination threshold. The coefficient of variation in a moving window provides a measurement ofa measurement of this slowing down. calculated this statistical signature by first the magnitudeof ofthe thismagnitude slowing down. We calculated thisWe statistical signature by first detrending with a detrending with a one-sided filter and then computing the coefficient of variation in a moving one-sided filter and then computing the coefficient of variation in a moving window of 30 observations. window of shows 30 observations. This figure this statisticalwith signal beginofincreasing with thetoonset This figure this statistical signal shows to begin increasing thetoonset vaccination and rise of vaccination and to rise dramatically as the approach to the vaccination threshold (vertical dramatically as the approach to the vaccination threshold (vertical dashed line) is approached.dashed line) is approached.
These results show that critical slowing down accompanies the approach to the vaccination Of course, if one has perfect case reporting, then it is simple enough to inspect the number of threshold and is detectable using very simple statistical tests. We also tested if the timing of the case reports over time to determine that the elimination campaign is continuing to realize results— vaccination threshold itself is identifiable using these methods. Motivated by the theoretical prediction although it is important to note that this will not tell us if the vaccination threshold has been reached. that the coefficient of variation would diverge at the vaccination threshold [22], we approximated the In order to determine if our method works with incomplete case reporting, we looked at case reports moving window signal with the hyperbolic equation wt = a/(t − c) + b, where wt is the calculated that were binomial samples of 95%, 50%, 10%, and 5% of the true number of cases in each year. value of the signal at time t, a is a fit coefficient that governs the speed of divergence, b is a fit coefficient Surprisingly, despite the fact that case reports differ by three orders of magnitude and themselves corresponding to the baseline value of w, and c is the location of the threshold. To test this model, we contain no information about the true prevalence in the population, the statistical signals indicating simulated 1000 realizations of the epidemic model in Figure 1. We then automated the estimation of the approach to the vaccination threshold were practically indistinguishable (Figure 3a). This result the threshold by fitting a, b, and c by nonlinear least squares to data for each simulation from its start shows that it may be possible to monitor the path to elimination by taking new approaches to until the point it reached 75% of its maximum value. The estimated time that the threshold would be processing surveillance data, even if they are subject to a significant amount of under-reporting. crossed was slightly biased and independent of the level of under-reporting (Figure 3b). We suspect Details of these simulations are provided in online supplementary material. the bias evident in Figure 3b is due to the approximation wt = a/(t − c) + b. Accordingly, we consider These results show that critical slowing down accompanies the approach to the vaccination the observed bias (