Monitoring the Quality of Outsourced Software Tobias Kuipers
Joost Visser
Gerjon de Vries
Software Improvement Group The Netherlands Email:
[email protected]
Software Improvement Group The Netherlands Email:
[email protected]
Software Improvement Group The Netherlands Email:
[email protected]
Abstract—Outsourcing application development or maintenance, especially offshore, creates a greater need for hard facts to manage by. We have developed a tool-based method for software monitoring which has been deployed over the past few years in a diverse set of outsourcing situations. In this paper we outline the method and underlying tools, and through several case reports we recount our experience with their application.
Monitor
Software Annual Report
Board
Quarterly Iteration
IT Management
Montly Iteration
Project Management
Generated Documentation
Software Engineers
I. I NTRODUCTION Outsourcing of application development or maintenance brings about an interesting dilemma. One the one hand, outsourcing promisses cost reduction and increased focus on core business. The vendor organization specializes in software engineering capabilities and realizes scaling benefits. On the other hand, the loss of technical expertise at the client organization leads to loss of control over the quality of the delivered product which, in turn, leads to loss of efficiency and increased costs. To prevent that costs, deadlines, and functionality slip out of control, the remote management of outsourced projects must be grounded in factual technical knowledge of the outsourced system. Is there a way out of this dilemma? In this paper, we argue that this outsourcing dilemma can be resolved by performing tool-assisted monitoring of the quality of outsourced software. Such software monitoring is a highly specialized activity that supports IT management by translating technical findings to actionable recommendations. To avoid the need for in-house technical know-how, this highly specialized activity of monitoring outsourced software can in turn be outsourced to a third, independent party. We have developed a tool-based method for software monitoring which has been deployed over the past few years in a diverse set of outsourcing situations. In this paper we outline the method and underlying tools, and through several case reports we recount our experience with their application. The paper is structured as follows. Section II provides a global overview of the tool-based method for software monitoring that we have developed previously [1]. Section III high-lights the tools that support the method, while Section IV focusses on the quality model it employs. In Section V, we share our experiences with applying the method in the form of three case reports. These reports cover various application scenarios and various software technology platforms. The paper is concluded in Section VI, where we summarize our contributions and reflect on lessons learned and on the value of software monitoring on a more generalized level.
Source code
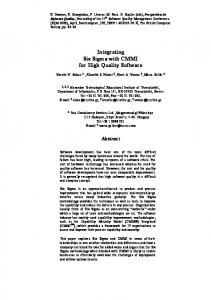
Fig. 1. The various deliverables of software monitoring and their relationships to management levels. On the basis of source code analysis, insight in the technical quality of software systems or entire portfolios is provided at regular intervals to project managers, IT management, and general management.
II. S OFTWARE M ONITORING Previously, we have developed and described a tool-based method for software monitoring which consists of a cycle of activities designed to drive continuous improvement in software products and processes [1]. An overview of the method is provided in Figure 1. A. Source code analysis The basis of monitoring is the frequent analysis of all source code in an automated manner. We have developed a suite of tools, dubbed the Software Analysis Toolkit (SAT), which contains components for parsing, flow analysis, and metric extraction for a wide range of programming languages. The SAT has been designed to be highly scalable and highly customizable. It is suitable for processing software portfolios of many millions of lines of code. We continuously extend the SAT with support for further languages. A dynamic web portal with all extracted software metrics is available to all stake holders in the system or portfolio. B. Scope The scope of software monitoring is flexible, both in duration and in the number of systems being monitored. In some cases, only a single system is monitored, but more commonly all systems with a particular technology footprint (e.g. mainframe systems, or .Net systems) are under scrutiny. When the scope extends to all systems, we use the term software portfolio monitoring. In some cases, monitoring is
er mb
ry
De
ce
Jan ua
Software Annual Report Summarizing
Monthly Iteration Apply SAT
Fig. 2.
Quarterly Iteration Evaluation, interpretation, illumination, recommendation
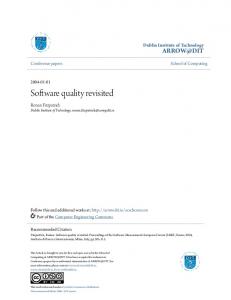
The various nested iterations of software monitoring.
initiated at the start of system development, and ended at first delivery. In other cases, systems are monitored in their maintenance or renovation phase. C. Deliverables The information extracted from source code is combined with information obtained from secondary sources, such as documentation and interviews with stake holders. On the basis of this combination, insight into the software is provided to various levels of management at different frequencies. With high frequency (typically monthly), fairly detailed information about individual systems is communicated to project managers. With medium frequency, more aggregated information is presented and discussed at the level of overall IT management. With low frequency, the monitoring information of an entire year is compressed into an annual software report, to be presented at board level. Note that the various deliverables are not limited to simply communicating measurement values. The results of source code analysis are interpreted by experts, followed by evaluation and recommendations. Where feasible, targets are set for quality improvement. Thus, a significant consultancy effort is mounted to incorporate the lessons to be learned from software measurements into the software management processes. Below we discuss the various iterations and their deliverables in more detail. D. Iterations The three nested iterations of the monitoring methodology are illustrated in more detail in Fig. 2. Though the typical duration of the shortest iteration is one month, shorter and longer time spans are also used. The yearly iteration is optional, and is typically used only when a significant part of the software portfolio is being monitored. 1) Monthly iteration: In the inner iteration, the Software Analysis Toolkit is applied to the selected software systems or entire portfolio, resulting in a large number of basic facts
about the code. These facts include metrics, dependency information, and detected violations of programming conventions or standards. All these facts are collected into a data repository. From this repository, reports are generated that present the facts in a human digestible fashion. This means that the data is appropriately grouped and filtered, and visualized in graphs and charts that meet the information needs of assessment experts, project managers, and other stake holders. 2) Quarterly iteration: Every three months, the technical data gathered in the inner iterations is interpreted and evaluated by assessment experts. Also, the data is related to other information elicited in workshops and interviews. The findings are presented to IT management together with recommendations about how to react to the findings. By interpretation, we mean that various selections of the data are combined and contrasted to discover for instance trends, correlations, and outliers. For example, based on the fact that certain modules have exceeded a certain complexity threshold, an assessment expert might hypothesize that these modules implement several related functions in a tangled fashion. He might discover that the database dependency information for these modules corroborates his hypothesis. Finally, he may take a small sample from these modules, inspect their code and verify that his hypothesis is indeed true. By evaluation, we mean that the expert makes value judgments about the software system or portfolio. The judgments are based on best practices reported in the literature, on published quality standards, comparisons with industry best and average, and so on. In Section IV, we provide further insight into the structured method we use for software quality evaluation according to the ISO/IEC 9126 software product quality model [2]. The evaluation and interpretation of technical data, as well as elicitation of IT-related business goals are instrumental in the most important element of the quarterly iteration: the drafting of recommendations. These recommendations are of various kinds. They can be detailed, short-term recommendation, such as redesigning a particular interface, migrating particular persistent data from hierarchical to relational storage, or upgrading a particular third-party component. On the other hand, some recommendations may have a more general, long term character, such as integrating two functionally similar, but technically distinct systems, or reducing the procedural character of the object-oriented portions of the portfolio. The deliverable of the quarterly iteration is a presentation of findings, evaluation, and recommendations to IT management in a workshop dedicated to that purpose. 3) Annual iteration: Every year, the deliverables of the monthly and quarterly iterations are summarized in an Annual Software Report. The intended audience of this report is the general management of the company, which is not necessarily IT-savvy. For this reason, the software engineering experts that compile the report need to be able to explain IT issues in layman’s terms. In addition to the summaries of the monthly and quarterly iterations, the Annual Software Report may include IT-related financial information, if available in sufficient detail.
external and internal quality
III. T OOL BASIS functionality
In this section we provide a brief discussion of the tool support for source code analysis on which the monitoring approach is based. The tools offer three overall pieces of functionality: gathering source code, performing static analysis on the code, and visualizing the analysis results. The components that implement analysis and visualization are frameworks into which various subcomponents can be inserted that implement individual analysis and visualization algorithms. A repository that persistently stores all information extracted from the sources is shared by the components for gathering, analysis, and visualization. A. Source Manager Source code files can be brought into the system in different ways. In some cases, a connection is made to the versioning system of the client, such that the upload procedure is fully automatic. In other cases, the technical situation or client preferences do now allow full automation. For these cases, a secure upload facility is provided which can be operated by the client via a standard web browser. B. Analysis Components Once source code files have been uploaded to the system, they will be analyzed statically by the analysis framework. Which analyses are available for the various source files depends on the specific client configuration. Analysis components vary in their degree of sophistication and generality. Some components are applicable only to certain types of files. For instance, a component of control-flow reconstruction may implement an algorithm that works only for ANSI-Cobol-85. Other components are applicable more generally. For instance, a component for counting lines of code and comment could work for any language that employs one of the common comment conventions. The amount of source code in a typical software portfolio ranges between 1 million and 100 million lines of code. Processing this code to obtain the basic monitoring data should under no circumstance take more than a few hours. The computational complexity of the implemented algorithms should be kept within bounds. In this sense, the analysis components must be scalable. C. Visualization components Basically, two categories of visualizations are available: charts and graphs. Both are highly parameterizable. We are not only interested in presenting data about software at a particular moment. We need to visualize the evolution of the software throughout time. Of course charts can be used for this purpose, where one of the axes represents time. Another instrument is the use of animations.
portability reliability
suitability accuracy interoperability security
maturity fault tolerance recoverability
maintainability usability
efficiency
understandability
time behaviour
learnability operability attractiveness
resource utilisation
analysability changeability stability testability
adaptability installability co-existence replacability
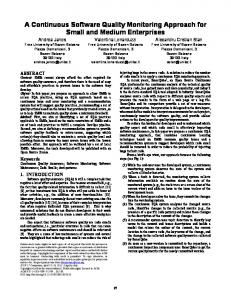
Fig. 3. Breakdown of the notions of internal and external software product quality into 6 main characteristics and 27 sub-characteristics (the 6 so-called compliance sub-characteristics are not shown). In this paper, we focus on the maintainability characteristic and its 4 sub-characteristics of analyzability, changeability, stability, and testability.
IV. A PRACTICAL MODEL OF TECHNICAL QUALITY The ISO/IEC 9126 standard [2] describes a model for software product quality that dissects the overall notion of quality into 6 main characteristics: functionality, reliability, usability, efficiency, maintainability, and portability. These characteristics are further subdivided into 27 sub-characteristics. This breakdown is depicted in Fig. 3. Furthermore, the standard provides a consensual inventory of metrics that can be used as indicators of these characteristics [3], [4]. The defined metrics provide guidance for a posteriori evaluation based on effort and time spent on activities related to the software product, such as impact analysis, fault correction, or testing. Remarkably, ISO/IEC 9126 does not provide a consensual set of measures for estimating maintainability on the basis of a system’s source code. Over the course of several years of management consultancy grounded in source code analysis, we have started to formulate a software quality model in which a set of well-chosen sourcecode measures are mapped onto the sub-characteristics of maintainability according to ISO/IEC 9126, following pragmatic mapping and ranking guidelines [5]. We briefly present this model. A. Mapping source code properties quality aspects The maintainability model we have developed links systemlevel maintainability characteristics to code-level measures in two steps. Firstly, it maps these system-level characteristics to properties on the level of source code, e.g. the changeability characteristic of a system is linked to properties such as complexity of the source code. Secondly, for each property one or more source code measures are determined, e.g. source code complexity is measured in terms of cyclomatic complexity. Our selection of source code properties, and the mapping of system characteristics onto these properties is shown in Fig. 4. The notion of source code unit plays an important role in various of these properties. By a unit, we mean the smallest piece of code that can be executed and tested individually. In Java or C# a unit is a method, in C a unit is a procedure. For a language such as COBOL, there is no smaller unit than a program. Further decompositions such as sections or paragraphs are effectively labels, but are not pieces of code that are sufficiently encapsulated to be executed or tested individually.
very high 11%
duplication
x
x x
x
very high 2%
moderate 13%
unit testing
x
high 7%
high 16%
unit size
analysability changeability stability testability
complexity per unit
volume
ISO/IEC 9126 maintainability
source code properties
x
x
x
x x
Fig. 4. Mapping system characteristics onto source code properties. The rows in this matrix represent the 4 maintainability characteristics according to ISO/IEC 9126. The columns represent code-level properties, such as volume, complexity, and duplication. When a particular property is deemed to have a strong influence on a particular characteristic, a cross is drawn in the corresponding cell. .
The influence of the various source code properties on maintainability characteristics of software is as follows: • Volume: The overall volume of the source code influences the analysability of the system. • Complexity per unit: The complexity of the code units influences the system’s changeability and its testability. • Duplication: The degree of source code duplication influences analysability and changeability. • Unit size: The size of units influences their analysability and testability and therefore of the system as a whole. • Unit testing: The degree of unit testing influences the analysability, stability, and testability of the system. This list of properties is not intended to be complete, or provide a watertight covering of the various system-level characteristics. Rather, they are intended to provide a minimal, noncontroversial estimation of the main causative relationships between code properties and system characteristics. Intentionally, we only high-light the most influential causative links between source code properties and system characteristics. For instance, the absence of a link between volume and testability does not mean the latter is not influenced at all by the former, but rather that the influence is relatively minor. B. Ranking For ranking, we use the following simple scale for each property and characteristic: ++ / + / o / - / --. For various codelevel properties we have defined straightforward guidelines for measuring and ranking them. As an example, consider the property of complexity. The complexity property of source code refers to the degree of internal intricacy of the source code units from which it is composed. Since the unit is the smallest piece of a system that can be executed and tested individually, it makes sense to calculate the cyclomatic complexity on each unit. To arrive at a meaningful aggregation of the complexity values of the various unit of a system, we take the following categorization
low 59% moderate 14% low 78%
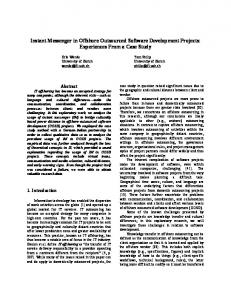
Fig. 5. Distribution of lines of code over the four complexity risk levels for two different systems. Regarding complexity, the leftmost system scores -- and the rightmost system scores -.
of units by complexity, provided by the Software Engineering Institute, into account [6]: CC
1-10 11-20 21-50 > 50
Risk evaluation simple, without much risk more complex, moderate risk complex, high risk untestable, very high risk
Thus, from the cyclomatic complexity of each unit, we can determine its risk level. We now perform aggregation of complexities per unit by counting for each risk level what percentage of lines of code falls within units categorized at that level. For example, if, in a 10.000 LOC system, the high risk units together amount to 500 LOC, then the aggregate number we compute for that risk category is 5%. Thus, we compute relative volumes of each system to summarize the distribution of lines of code over the various risk levels. These complexity ‘footprints’ are illustrated in Fig. 5 for two different systems. Given the complexity footprint of a system, we determine its complexity rating using the following schema: rank ++ + o --
maximum relative LOC moderate high very high 25% 0% 0% 30% 5% 0% 40% 10% 0% 50% 15% 5% -
Thus, to be rated as ++, a system can have no more than 25% of code with moderate risk, no code at all with high or very high risk. To be rated as +, the system can have no more than 30% of code with with moderate risk, no more than 5% with high risk, and no code with very high risk. A system that has more than 50% code with moderate risk or more than 15% with high or more than 5% with very high risk is rated as --. For example, the system with the leftmost complexity profile of Fig. 5 will be rated as --, since it breaks both the 15% boundary for high risk code and the 5% boundary for very high risk code. The rightmost profile leads to a - rating, because it breaks the 0%, but not the 5% boundary for very high risk code. Similar rating guidelines have been defined for other source code properties. Details can be found elsewhere [5]. The
boundaries and thresholds we defined are based on experience. During the course of evaluating numerous systems, these boundaries turned out to partition systems into categories that corresponded to expert opinions.
Lines of code 90000 80000 70000
C. Practicality of the quality model
60000
Our quality model exhibits a number of desirable properties. • The measures are mostly technology independent. As a result, they can be applied to systems that harbour various kinds of languages and architectures. • Each measure has a straightforward definition that is easy to implement and compute. Consequently, little up-front investment is needed to perform the measurement. • Each measure is simple to understand and explain, also to non-technical staff and management. This facilitates communication to various stake holders in the system. • The measures enable root-cause analysis. By giving clear clues regarding causative relations between code-level properties and system-level quality, they provide a basis for action. Due to these properties, the model has proven to be practically usable in the context of software monitoring.
50000 40000 30000 20000 10000 0 r1
r2
r3 C
Stored procs
r4
Scripts
Fig. 6. System volume in lines of code for the latest 4 releases (Case V-A). Duplication [%] 60
50
40
V. C ASE STUDIES 30
Over the past few years, we have applied software monitoring in a wide range of management consultancy projects. In this section, we share some of our experiences in three anonymized case reports. A. Curbing system erosion during maintenance An organisation has automated a part of its primary business process in a software system some 10 to 15 years ago. A party that currently plays no role in the maintenance of the system built it. Over time, maintenance has passed through a number of organisations. The system is currently being operated and managed in a location in central Europe, and being maintained in South East Asia. The system owner (business requirements developer) is in a different location in western Europe. The system owner periodically requests specific features to be added to the system, and from time to time the system needs to be adapted to a changing hardware environment. We were asked to monitor the maintenance of the system in order to improve management’s control over the technical quality of the software and the associated costs of the maintenance process. As a result of the monitoring activity, we had accurate insight into various system parameters, among which its volume. In Fig. 6, the volume of the system, measured in lines of code, is plotted for the 4 latest releases of the system, separated into C code, stored procedures (PL/SQL), and scripts. Note that an increase in the volume of C code of about 35% occurred between release r1 and release r2. Such increases are normal in development situations, but in the current maintenance situation, where the system had been more or less stable for a number of years, this amount of growth is remarkable. When we asked the various parties involved with the system what
20
10
0 r1
r2
r3 C
Fig. 7.
Stored procs
r4
Scripts
Code duplication for the latest 4 releases (Case V-A).
could explain this growth, we were met with blank stares; nobody could come up with a reason why the system was growing so much. Another parameter that we monitored is the amount of code duplication in the system. This is expressed as a percentage of code lines. A code line counts as duplicated when it participates in a block of code of at least 6 lines that occurs more than once. Apart from some compensation for spacing issues, we count exact duplicates. For the same 4 releases, the measurement values are plotted in Fig. 7. As it turned out, the unexplained growth of the C code between release r1 and release r2 was accompanied by an increase in duplication that was even more pronounced. After some further investigation the underlying cause was identified: from version r1 to r2 a particular piece of hardware was upgraded for some installations of the system. As a result, the driver for that hardware needed to be changed as well. Since the old driver was still needed for the old piece of hardware, the driver was copied completely, and a few minor changes were made to it to facilitate the new hardware. Although there may have been a reason for copying initially
8000
7000
6000
5000 deleted
4000
added changed unchanged
3000
total 2000
1000
0
-1000
r1
r2
Fig. 8. Code modifications on the file level, between two versions (Case V-B).
(shorter time to market, a belief that this was a temporary solution), it will be a burden to maintenance cost in the long run. As the charts show, the initial copying was not subsequently cleaned up in later versions of the system. The fundamental problem, of course, was that no explicit decision was ever made: the developers took this course of action because they felt this was the best, easiest, or quickest way to satisfy a particular change request, but they did not take into account the consequences to the overall system health. By analysing the numbers, and showing the result of the action on the complete code base, we provide both developers and management with the data needed to make an informed, explicit decision regarding the future of the system. In this case, actions were planned in subsequent releases to curb system erosion by refactoring the code such that the introduced duplication was eliminated again. B. Systems accounting from code churn An organisation was building an information system to automate its primary business process. System development was done on three sites on two continents. Requirements gathering and management was done on another two sites in two different countries. An estimated 25 subcontractors were involved in the project, with an estimated 240 people. The perception of higher management was that a significant part of the 240 people involved were developing code on a dayto-day basis. We were asked to monitor the technical quality of the system. When we analysed the system, it turned out to be quite large. It was developed in a modern object-oriented language, and consisted of about 1.5 million lines of code divide over about 7000 files. Based on software productivity statistics [7], a system of this volume, built with this technology, corresponds to about 170 man years, as a rough estimate. The technical quality of the system, judged on the basis of indicators such as modularization, complexity, duplication, etc. did not reveal any major risks, though several points for improvement were identified. Since the system was several years old already, strong doubt arose whether for a system of this size and quality the staffing
of 240 people was justified. To answer this question from management we made an in-depth comparison of two versions of the system, separated by about one year. The overall volume of the system, its complexity, duplication, and other indicators turned out to have been more or less stable over that period. Still, many modifications had been made. We charted those modifications in terms of file creations, deletions, and modification, as can be seen in Fig. 8. When a file was copied, the copy was adapted, and the old file was removed, we counted this as a single file modification. Based on our measurements, it turned out that the amount of change over that year was nowhere near the productivity that one may expect from a 240 people effort. Perhaps 50 would have been more realistic. After we reported our findings, an investigation was started to establish how many staff members were actually active as software developers, to find out what exactly the other people on the project were doing, and what sources of overhead could be eliminated. This investigation led to a restart of the project with less than 30 people, of which about 18 are actively developing software. Development of the system has been brought back to a single location. Requirements gathering is still done at a different location, but people responsible for the requirements spend at least three days a week at the development location. After the restart, the productivity of the project grew in absolute terms. We were told that the project was delivering more functionality (defined in terms of feature requests or change requests) per time unit with 30 people than they were with 240 people. In retrospect this is not as surprising as it seems. It is widely acknowledged that adding more manpower to a software project does not make it necessarily more productive [8]. In addition, dividing resources over a multitude of locations was identified as a major source of overhead and waste. What was surprising to us is that our technology apparently can be used for what we call ‘systems accounting’. Using a very technical (and not very sophisticated) measure, we were able to see right through the 25 subcontractors and the 240 people. In this case, software monitoring at the system level and fact-based interaction with high-level management proved to be decisive in radically improving efficiency. C. Learn from failure, measure for success We were asked to monitor the development of an eCommerce platform for a large bank in the Netherlands. This platform was built from scratch as a replacement for a functionally identical platform which failed in the rollout phase. Because of the earlier failure, the bank and its (new) outsource party decided to use our monitoring service in order to gain insight into the technical quality of the new software. Their key targets for this new project were to realize low costs of maintenance and operation. At the start of the second attempt, we performed an assessment on the code base of the first attempt, which led us to attribute the failure to several factors, including:
eServices
Voortgang/LOC Voortgang/LOC high 1%
very high 12%
very high 0%
moderate 5%
high 18%
low 57%
Dummy
moderate 13% Old
Java
Java
Config
Config
New
eServices
eServices Oude 395,615 eServices
Other
48,441 24,122 0
395,615
100000
200000
300000
400000
CodeCode Duplicatie Duplicatie
Fig. 10. Complexity profiles for both the failed project and the new project (Case V-C). The former system scores --, while the new system scores ++.
Java
48,441 24,122
low 94%
500000
149,713
600000
149,713
Fig. 9. Volume measurements in lines of code for both the failed project and the new project (Case V-C).
An overly complex design that ambitiously tried to generalize the e-Commerce platform so that it could handle future markets. • A design that tried to solve possible performance issues a priori by using a complex distributed J2EE EJB-based architecture. • A lack of (automatic) unit tests and integration tests. Java Java Config Config Learning from these lessons, a set of contrasting goals were set for the new project: 33 33 • A minimalist design that focused only on the eServices current eServices 2 2 product line. 57 Oude eServices Oude eServices • A lightweight approach to system architecture. Fig. 11. Duplication measurements23in lines of code 23 for both the failed project and the new project (Case V-C). • A test-driven approach, by focusing on automated system and unit tests. Continuous monitoring of the source code base was put into while towards the end of the project, this measure stabilizes. place from the start of the new project. For Java code, the final value is excellent, but for non-Java Our monitoring of volume indicators demonstrated that the code duplication is still too high. new approach resulted in a much leaner system. Fig. 9 shows We also measured several coding standards, including: measurements of the lines of code for both the old and new • Double checked locking: 60 instances in the old system system. The measurements are split out between Java code and and 0 in the new. The double checked locking construct other kinds of code, which include HTML, XML, and SQL. introduces a bug in thread synchronization code. As the charts show, the new system was significantly smaller • String reference equality: 22 vs. 0. String reference than the old one (about 7,5 times smaller). Over the period of equality is often a bug introduced by inexperienced 14 months, the volume increase of the new system was almost programmers; the equals method should be called instead. linear, indicating constant productivity throughout that period. • Too generic error handling constructs: 2141 vs. 17. The The new approach also paid off demonstrably in terms 17 cases in the new code were manually checked, and did of quality indicators such as complexity and duplication. not introduce risks (false positives), while sampling the The complexity profiles of both old and new system are 2141 violations in the old code revealed actual problems. shown in Fig. 10. Using the quality model of Section IV, the old system is rated on complexity as poor (--), while Monitoring also revealed that test code was being written, with the new system is rated as excellent (++). The duplication a test coverage stable at about 60% throughout the course of measurements are shown in Fig. 11. The new system contains the project. higher duplication in non-Java code (33%) than in Java code In this case, monitoring helped to reduce the size and (2%), but significantly less than the old system for both kinds increase the technical quality of the new system. Surprisingly, of code (23% and 57%). The timelines reveal that at the start the much simpler (non-distributed) architecture of the new of the project, duplication was low and relatively unstable, system performed much better than the original. Also the •
Dummy
Old
Java
New
Other
0
10
20
30
40
50
60
57
resulting system proved to be much easier to tweak for specific performance issues. In contrast to the previous attempt, this system was successfully concluded and taken into production.
by third-party monitoring of the technical quality of the outsourced software.
VI. C ONCLUSION
Software monitoring, though supported by tools, standards, and models, is a creative process that needs continuous improvement and calibration. Our quality model is still fairly young, and will be further refined based on our experience with its application. Also, changes in the maturity of the software industry will call for adaptation of rating guidelines, application of more sophisticated metrics, and perhaps other analysis instruments. In particular, we are keeping a close watch on developments in the area of analyzing and visualizing software evolution. We collect a extensive set of measurement data in the course of our monitoring and assessment activities. We are currently consolidating this data into a benchmarking data base that will allow well-founded comparisons of systems on the level of source code properties as well as system-level quality aspects.
A. Contributions Some years ago, we developed our tool-based method for software monitoring [1] and introduced it into the market. Since then, we have applied the method in a wide range of circumstances. On the technological side, we have monitored systems built in modern object-oriented languages, as well as classical mainframe languages. On the organizational side, we have acted on behalf of both clients and providers of application outsourcing services (but never both at the same time, naturally). In terms of software life-cycle, we have monitored both system maintenance and development from scratch. More recently, we have used our experience in software monitoring as well as in software risk assessment [9] to draft a practical model for measuring the technical quality of software products [5]. This model has been instrumental for the abstraction and aggregation of source code analysis results necessary for translation of technical findings into management-level notions. In this paper, we have summarized both the monitoring approach and the quality model, and presented them for the first time in combination. Moreover, we have shared our experience of applying the approach and the model in a range of application outsourcing situations. The cases reported include maintenance as well as development situations, various technology mixes, and a variety of organizational contexts. B. Lessons learned Among the lessons learned from these cases and others not reported here, are the following: • Simple measures, but well-chosen and aggregated in meaningful ways, are effective instruments for software monitoring. • The simultaneous use of distinct metrics can be used to zoom in on root causes of perceived quality or productivity problems. • The gap between technical and managerial realities can be bridged with a practical software product quality model. • Monitoring helps to curb system erosion in maintenance situations. • Monitoring code churn allows ‘systems accounting’. • Monitoring helps to achieve clear productivity and quality targets. • The chances of success of software development projects are influenced positively by software monitoring. In the introduction, we indicated that software monitoring, when executed by a third party, can resolve a dilemma that arises from application outsourcing. Indeed, the paradox of removing technical know-how from the organization to an outsourcing party while needed that knowledge to manage the relationship to that party, can in our experience be solved
C. Future work
R EFERENCES [1] T. Kuipers and J. Visser, “A tool-based methodology for software portfolio monitoring.” in Proceedings of the 1st International Workshop on Software Audit and Metrics, SAM 2004, In conjunction with ICEIS 2004, Porto, Portugal, April 2004, M. Piattini and M. Serrano, Eds. INSTICC Press, 2004, pp. 118–128. [2] ISO, ISO/IEC 9126-1: Software Engineering - Product Quality - Part 1: Quality Model. Geneva, Switzerland: International Organization for Standardization, 2001. [3] ——, “ISO/IEC TR 9126-2: Software engineering - product quality - part 2: External metrics,” Geneva, Switzerland, 2003. [4] ——, “ISO/IEC TR 9126-3: Software engineering - product quality - part 3: Internal metrics,” Geneva, Switzerland, 2003. [5] I. Heitlager, T. Kuipers, and J. Visser, “A practical model for measuring mainainability,” 2007, draft, April 30. [6] C. M. Software Engineering Institute, “Cyclomatic complexity – software technology roadmap,” http://www.sei.cmu.edu/str/descriptions/cyclomatic.html. [7] Software Productivity Research LCC, “Programming Languages Table,” Feb. 2006, version 2006b. [8] F. Brooks, The Mythical Man-Month: Essays on Software Engineering. Addison-Wesley Publishing, 1975. [9] A. van Deursen and T. Kuipers, “Source-based software risk assessment,” in ICSM ’03: Proceedings of the International Conference on Software Maintenance. Washington, DC, USA: IEEE Computer Society, 2003, p. 385.