has become an important tool to monitor and ..... ionospheric tomography in monitoring the tempo- ..... Xia C L, Wan W X, Yuan H, Zhao B Q and Ding F 2005.
Monitoring the three-dimensional ionospheric electron density distribution using GPS observations over China Wen Debao1,2 Yuan Yunbin1 and Ou Jikun1 1
Key Laboratory of Dynamic Geodesy, Institute of Geodesy and Geophysics, Chinese Academy of Sciences, 340 Xudong Road, Wuhan 430 077, China. 2 Graduate School of Chinese Academy of Sciences, Beijing 100 039, China.
In this paper, an IRI model assisted GPS-based Computerized Ionospheric Tomography (CIT) technique is developed to inverse the ionospheric electron density (IED) distribution over China. Essentially, an improved algebraic reconstruction technique (IART) is first proposed to reconstruct the ionospheric images with high resolution and high efficiency. A numerical experiment is used to validate the reliability of the method and its advantages to the classical algebraic reconstruction technique (ART). This is then used to reconstruct the IED images using the GPS data in China. The variations of the IED during magnetically quiet and disturbed days are reported and analyzed here. Reconstructed results during magnetically quiet days show some prominent ionospheric features such as the development of equatorial anomaly and the tilt of ionization crest. Meanwhile, ionospheric storm phase effects and disturbed features can also be revealed from the reconstructed IED image under storm conditions. Research shows that the positive storm phase effects usually happen in southern China, and the negative storm phase effects mainly occur in northern China. The equatorial anomaly crest moved to the north in the main phase of the storm. Ionosonde data recorded at Wuhan station provides the verification for the reliability of GPS-based CIT technique.
1. Introduction The ionosphere is one of the main error sources in GPS positioning and navigation (Yang and Zhang 2005). On the other hand, however, GPS has become an important tool to monitor and investigate ionospheric activities and properties. It is well known that the horizontal structure of the ionosphere can be studied well by using TEC data from ground GPS data. But these data are disadvantageous while studying the vertical variations of ionospheric structure since all of TEC values are derived from the ionospheric models based on the single-layer concept (Otsuka et al 2002; Afraimovich et al 2004). This assumption is only an approximation to the reality and physically untrue (Gao and Liu 2002). For this reason, some data from traditional ground-based
instruments, such as ionosondes and incoherent scatter radars (ISRs), have been used to investigate the vertical variation of the ionosphere in the past. These ground-based instruments’ measurements are however restricted to either the bottom side ionosphere (ionosonde) or the lower part of the topside ionosphere (which is the part of the ionosphere between 500 km and 800 km), such as ground-based ISRs measurements. In addition, ground-based instruments have a limited area of coverage since they are too expensive to put them in networks. So it is difficult to study the largescale ionospheric structure using the forementioned ground-based instruments. However, imaging the IED of all scales and dimensions is indispensable for scientific studies and potential applications. To obtain the vertical structure of the ionosphere on a large scale, Austen et al (1986) first proposed
Keywords. Atmospheric sciences, geophysics, remote sensing; GPS; computerized ionospheric tomography (CIT); ionospheric electron density; total electron content (TEC); ionosonde; equatorial anomaly. J. Earth Syst. Sci. 116, No. 3, June 2007, pp. 235–244 © Printed in India.
235
236
Wen Debao et al
the CIT technique and demonstrated its feasibility to reconstruct IED distribution by using TEC data. From then on, tomographic reconstruction of IED has become a popular and successful means of studying the large-scale ionospheric structure. In the past, ionospheric tomography was primarily applied to image the IED by using the data of polar orbiting satellite such as Navy Navigation Satellite System (Austen et al 1988; Raymund et al 1990; Na and Lee 1991; Fremouw et al 1992; Raymund 1995). Although these studies are useful for understanding the basic ionospheric structure, only a two-dimensional ionospheric image can be reconstructed since the ground receivers are usually installed along a fixed longitude chain. Kunitsyn et al (1997) first confirmed the feasibility of applying the CIT technique to reconstruct the three-dimensional ionospheric structure by using a high-orbit satellite system such as GPS since it is capable of providing a detailed structure of the entire ionosphere. Since then, the GPS-based CIT technique has been widely used to investigate the temporal and spatial variations of ionospheric structure (Hajj et al 1994; Hasen et al 1997; Hajj and Romans 1998; Howe et al 1998; Rius et al 1998; Ruffini et al 1998; Hernandez-Pajares et al 1998, 2000; Gao and Liu 2002; Mitchell and Spencer 2003; Bust et al 2004; Liu 2004; Yin and Mitchell 2005; Ma and Maruyama 2005; Yizengaw et al 2005; Jin et al 2006; Wen et al 2007). It is well known that the variations of the IED over China are complicated since China spans a large range in both longitude and latitude directions (Yuan and Ou 2001, 2002; Huo et al 2005). The Crustal Movement Observation Network of China (CMONOC) has been established and currently 25 stations (to be increased to 260 in the second stage) are operational (Yuan and Ou 2002). It provides high precision dual-frequency GPS data for studying the ionospheric activities over China. Since the receiver network spans a wide range of latitude and longitude, the overlapping TEC measurements from the ground-based GPS observations are insufficient for CIT technique. This makes it difficult to interpolate the data before the IED images are generated. Therefore, an IRI modelassisted GPS-based CIT technique is developed to compensate for the insufficiency of ground-based TEC measurements. To reconstruct the IED distribution over China with high temporal and spatial resolution and high efficiency, a new CIT algorithm is proposed and validated in this paper. This is then used to reconstruct the IED distribution, and the first tomographic results of the IED distributions under magnetically quiet and storm conditions are reported and analyzed. Some prominent features of the ionospheric structure can be seen from the
reconstructed IED images. Verification is provided by comparing the tomographic reconstruction profiles with those obtained from ionosonde at Wuhan station.
2. Basic method of tomographic inversion 2.1 Derivation of slant TEC (STEC) The derivation of STEC is commonly made using the pseudo ranges and phase measurements of the dual-frequency GPS signals. Since GPS phase measurements are less affected by multipath effects (Jakowski et al 1996), the accuracy of the STEC derived from differential phases (STECph ) is higher than that of the STEC derived from differential pseudo ranges (STECco ). Because of the ambiguity in GPS phase measurements, STECph only provides the relative changes of ionospheric TEC. On the other hand, although P code pseudo ranges are sensitive to multipath effects, STECco values are absolute. Taking into account the above facts, an absolute STEC with improved accuracy may be obtained by introducing an additive term BL . It can be formulated as: STEC = STECPh + BL .
(1)
If N measurements are obtained during a satellite pass, BL can be modeled by (Yuan and Ou 1999; Ma and Maruyama 2005; Yizengaw et al 2005) � �N 2 i=1 (STECCoi − STECPhi ) . (2) BL = N
2.2 Tomographic formulation Ionospheric STEC is defined as the line integral of IED along the ray path from satellite to receiver, it can be expressed as: � (3) STEC = N e (�r, t) ds, l
where N e is the IED at a point in the ray path l from satellite to receiver, and �r is the position vector of the point. The CIT technique applies STEC to invert IED. To simplify IED inversion, the imaged region of the ionosphere is first discretized into some small pixels in a selected reference frame. Within each pixel, the electron density can be assumed to be constant. The STEC along the ray path can then be represented as a finite sum of shorter integrals
Monitoring the three-dimensional ionospheric electron density distribution along segments of the ray path length (Jin et al 2006). Mathematically this can be written as: STECi =
n �
Aij xj + ei ,
i = 1, 2, . . . , m.
(4)
j=1
The matrix notation of the above equation can be expressed by: ym×1 = Am×n xn×1 + em×1 ,
(5)
where n is the number of pixels in the image, m is the number of STEC measurements, y is a column vector of the m known STEC measurements, A is an m × n matrix with Aij being the length of ray i traversing through pixel j, x is a column vector consisting of all the unknown electron density parameters in all pixels, and e is a column vector associated with the discretization errors and measurement noises. To ensure a high-quality image and physical sense of the reconstruction, it is necessary to estimate the error vector. In this work, the error vector is estimated using the following equations: � �2 �m �m � (k+1) (k+1) = yi2 , (6) yi − yi e i=1
(k+1) yi
=
n �
i=1
(k+1) Aij xj ,
(7)
j=1
where yi is the ith row of the column vector y, (k+1) is the jth member of the vector of pixels xj x(k+1) , k is the number of changes to x.
3. IART algorithm To solve equation (5), a tomographic algorithm is required to determine the unknown electron density distribution. Various inversion algorithms have been developed since Austen et al (1986) first proposed the CIT technique. One of the most common algorithms is the ART algorithm. Its inversion procedure can be described as follows: x(k+1) = x(k) + λk (yi − ai x(k) ).
(8)
In equation (8), the column vector λk composing of all relaxation parameters is given as: (9) λk = γ · aTi (ai aTi ) where ai represents the ith row vector of projection matrix A in equation (5), γ is fixed in the tomographic inversion. From equation (8) and
237
equation (9), it can be seen that column vector λk is the key issue for the ART algorithm. The effective determination of the column vector λk is useful to perform the inversion of the IED with high resolution and high efficiency. According to equation (9), the column vector of the relaxation parameters only depends on γ since row vector ai does not change during the inversion. It is noted that column vector λk composed of small relaxation parameters may usually weaken the noise (i.e., GPS observation error, various approximations and assumptions made on the projection operator, quantization noise arising from discretization, etc.) influence on the ART-based reconstruction, but the cost are the computational efficiency. Therefore, it is necessary to improve the ART algorithm in order to reconstruct ionospheric images over China with high resolution and high efficiency, which is required by the related application and research. For this reason, it is necessary that all relaxation parameters in vector λk should become gradually smaller with the increase of the number of iterations, and the convergence can be accelerated. To satisfy the above demands, in this work, the column vector of all relaxation parameters can be improved for the ART as follows:
� (10) λk = gk ai · gk ,
T where gk = g1k , g2k , . . . , gnk and gik = aij xkj . Using this improvement, the relaxation parameter for each pixel can be adaptively adjusted as the estimated ionospheric electron density values obtained in the last iteration, and the noise influence can be gradually weakened since the relaxation parameter adaptively decreases with the increase of the iterative number. Thus, the adaptive adjustment of the relaxation parameters can improve computational efficiency and imaging quality of the ART algorithm.
4. Numerical simulation of new algorithm In order to verify the reliability of the IART and its advantages to the classical ART algorithm, a test scheme is devised in which a set of simulated IED distribution generated from the IRI2001 model (Bilitza 2003) is applied to obtain TEC measurements needed by CIT technique. The simulation procedure is summarized as follows: • In a selected reference frame and time period, the actual positions of GPS satellites and ground receivers are used to create the projection matrix A.
238
Wen Debao et al
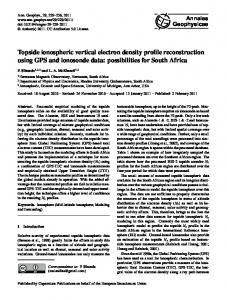
Figure 1. Contour plots of the modeled and reconstructed IED distributions along east longitude 106◦ (a) Simulated IED distribution with the IRI2001 model. (b) Reconstructed IED distribution from twelve iterations of the IART algorithm. (c) Reconstructed IED distribution from twenty iterations of the ART algorithm. (The IED is in unit of 1011 e/m3 .)
• The IED value at the center of each pixel is generated from the IRI2001 model and considered as the mean IED value of the corresponding pixel. The simulated time period is 01:30-02:00 UT, 8 July 2002. The discrete density distributions are represented by xsimu , and then the simulated TEC values ysimu without noise are computed by using the following equation: ysimu = A · xsimu .
(11)
• Practically, a small amount of random noise esimu should be added to the simulated TEC values ysimu . One can then obtain: ynois = ysimu + esimu .
(12)
Note that the maximum noise is restricted to 4% of the average of the simulated TEC values ysimu in this work. Using the above simulated TEC data (ynois), the IED distribution is reconstructed by using the IART algorithm and the ART algorithm, respectively. Figure 1(a) illustrates the simulated IED distribution using the IRI2001 model at 01:30– 02:00 UT on 8 July 2002 along east longitude 106◦ . For the simplicity of description, in the following section, one-iteration means that all available ray paths are used to update the reconstruction once. Figure 1(b) and 1(c) shows the reconstructed IED images both of twelve-iteration results of the IART algorithm and twenty-iteration results of the ART algorithm after the iterations have converged. Comparing figure 1(b) with figure 1(a), it can be seen that the ionospheric structure is reconstructed very well. The maximum value of IED errors, which is the difference between the inverted electron densities within all pixels and the corresponding sim3 ulated electron densities, is 1.72 × 10¹⁰ e/m , and 3 the minimum IED error is −1.47 × 10¹⁰ e/m , while 3 the average IED error is −2.65 × 10⁹ e/m , which is very small compared to the typical peak density
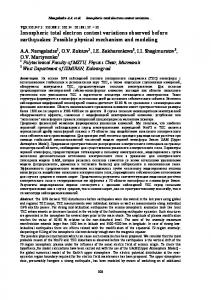
Figure 2. A comparison of the differences between the reconstructed IED distribution and that obtained from the IRI2001 model. 3
of 1.03 × 10¹² e/m . The statistical results demonstrate that the IED reconstruction has been carried out with high accuracy. This confirms the feasibility of reconstructing IED using IART. From figure 1(b) and 1(c), one can see that the convergence of the IART algorithm is faster than that of the ART algorithm. This demonstrates that the computation efficiency of the IART is higher than that of ART. Figure 2 compares the difference between the electron density distributions obtained from the two algorithms and that obtained from IRI2001 model. In this figure, blue line represents the difference between the inverted electron density distribution of the IART algorithm and that obtained from the IRI2001 model, and red line represents the difference between the inverted electron density distribution of the ART algorithm and that
Monitoring the three-dimensional ionospheric electron density distribution
239
Figure 3. Reconstructed IED images over China on 16 August 2003 derived from GPS data of CMONOC. The time for each panel is given at the top right corner. (The unit of the color bar is 1011 el/m3 .)
obtained from the IRI2001 model. From this figure, it can be seen that the inversion accuracy of the IART is higher than that of the ART. According to the results of numerical experiment, one can see that the IART is superior to the ART in performing CIT technique.
5. Results and analyses 5.1 GPS data Dual frequency GPS carrier phase data of 23 ground stations of the CMONOC network are used. These 23 CMONOC stations include: BJFS, CHUN, DLHA, DXIN, GUAN, HLAR, JIXN, KMIN, LHAS, LUZH, QION, SUIY, TAIN, TASH, URUM, WUHN, WUSH, XIAA, XIAG, XIAM, XNIN, YANC, and YONG. The sample interval is 30 s, and the elevation cut-off angle of 10◦ is adopted. The time series of the IED distribution over China are obtained using the improved CIT reconstruction algorithm mentioned above. When the CIT technique is performed by using ground-based GPS data, the horizontal ray paths are usually absent due to the geometry of GPS ray paths. However, the horizontal rays are very important to improve the vertical resolution of the reconstructed images. The absence of horizontal ray paths often makes the vertical resolution of the inverted IED profiles very limited. In recent years, the arisen occultation technique can provide the horizontal ray paths needed by IED reconstruction. To cope with the above limitation to some extent,
CHAMP occultation observations are incorporated into this work. The GPS/CHAMP data used in our work are listed in detail as follows: • RINEX file for orbits for the topside ionosphere and plasmasphere; decoded low rate CHAMP data with sample rate of 10 seconds. • CHAMP orbit files: rapid science orbit. • RINEX files for occultation ray path, decoded medium rate CHAMP data with 1 Hz sample rate. Since the CHAMP occultation plane may not be in the same plane as the GPS-to-ground receiver plane, to assimilate the related groundbased TEC data and space-based CHAMP occultation TEC data into the CIT model, the imaged region is divided into some small three-dimensional pixels. Its resolution is 30 km in vertical direction, while 0.5 degree is adopted in latitude and longitude direction. At the beginning of the assimilation process, the IRI2001 model was used to initialize the described pixel structure. Using the IART algorithm, a series of iterative process is then carried out to modify the IED value inside the pixels crossed by both the CHAMP-GPS radio links and ground-based GPS radio links. 5.2 Tomographic results 5.2a Reconstructed images during magnetically quiet periods Due to the quiet geomagnetic activity, the dualfrequency GPS data on 16 August 2003 are used to
240
Wen Debao et al
Figure 4. Tomographic images of ionospheric electron density at the longitude–latitude plane associated with different heights at 15:00 LT. The height for each panel is given at the top right corner. (The unit of the color bar is 1011 e/m3 .)
study the effects of hourly variations of the electron densities from 00:00 to 24:00 in Beijing time (BT). Some snapshots of the IED estimations are shown in figure 3. Each snapshot is plotted with respect to latitude and height at the meridian plane of east longitude 114◦ . The IED is expressed in units of 3 1011 e/m . Comparing all subfigures in figure 3, it can be seen that the peak height of the IED gradually ascends from 300 km to 400 km during the time period from 03:00 to 11:00 BT, and then it falls to 300 km at 19:00 BT. But at 23:00 BT, the peak height also ascends to 370 km. This roughly reflects typical characteristics of the vertical variations of the IED for the day over China. Meanwhile, from figure 3, it can be seen that an enhancement of the IED appears after the sunrise in the snapshot at 07:00 BT, and an equatorial anomaly crest then appeared at north latitude 22◦ at 11:00 BT with a 3 peak density of 1.24×10¹² e/m , and the tilting feature of the ionization crest can also be seen in this snapshot. As time evolves, the crest continues to be at the same latitude position, but a characteristic anomaly core, which is defined as the region having 80% to 90% of the crest value, is fully developed 3 with a peak density of 1.95× 10¹² e/m at 15:00 BT and there is also a hint of the tilt of ionization
crest. The gradient of the crest is reduced comparing with a tilting feature shown in the snapshot at 15:00 BT. At 19:00 BT, the peak density of 3 the anomaly crest is decreased to 1.51 × 10¹² e/m , but it does not show any tilt. In the last snapshot, it can be seen that the equatorial anomaly crest of the ionosphere does not occur. According to figure 3, it can also be found that the inverted IED values grow from small to large first, and then fall from large to small, which is consistent with the normal change laws in daytime and night-time over China as well as the fact that the characteristics of IED depend mainly on the dark solar activity. Figure 4 shows the variations of IED at longitude–latitude plane of different heights at 15:00 LT. The first panel (figure 4a) corresponding to the altitude of 100 km illustrates that the peak density of the ionosphere occurs at around north latitude 13◦ , and the core region nearly extends to the whole longitude range. In the second panel (figure 4b), the peak density occurs at around north latitude 25◦ , but the core region is reduced. Its longitude range is from east longitude 80◦ to east longitude 100◦ . Comparing with results shown in the second panel, in the following subfigures, it can be
Monitoring the three-dimensional ionospheric electron density distribution
241
Figure 5 provides the comparisons of the reconstructed electron density profiles with those obtained from both the IRI2001 model and ionosonde data recorded at Wuhan station. In this figure, the vertical profiles at east longitude 114◦ and north latitude 30.5◦ have been plotted. The comparisons show that tomographically reconstructed density profiles have agreed well with those obtained from the IRI2001 model and ionosonde data recorded at Wuhan station as a whole, and the profile of tomographic reconstruction is comparatively close to that obtained from ionosonde data, especially in the peak height. The excellent agreement between these independently measured data and the tomographically reconstructed density profiles, as shown in the examples in figure 5, confirms the capability of ionospheric tomography in monitoring the temporal and spatial variation of the ionospheric electron density. 5.2b Ionospheric images under disturbed conditions
Figure 5. A comparison of the tomographically reconstructed electron density profiles with those obtained from both ionosonde station at Wuhan and the IRI2001 model.
seen that the longitude range of the core region gradually extends as the altitude increases. Up to the altitude of 500 km, the core region also nearly extends to the whole longitude range. However, the ionization crest tends to be moved to the eastward and the southward side in figure 4(c–i). In the last panel, the crest is pointed at around north latitude 16◦ and east longitude 130◦ . From figures 3 and 4, one can also see that there are larger differences between the characteristics of the IEDs in mid-latitude and low-latitude areas, and the values of IED over northern China are smaller than those over southern China as a whole. This indicates a strong correlation of the variation of IED with latitude.
To further demonstrate the performance of the GPS-based CIT technique, GPS data under magnetically disturbed conditions should be used to perform the inversion of the IED over China. The selected GPS data correspond to the observations on 18 August 2003 in this work. Interest is focused on this day since a severe geomagnetic storm event occurred on 18 August 2003. The Storm Sudden Commencement (SSC) occurred at 14:21 UT on 17 August 2003. During this storm, the planetary geomagnetic � activity indices KP reached the extreme values Kp = 52+. The 3hourly KP is enhanced from the middle of August 17 and reached 7+ at 18:00 UT on 18 August 2003. The minimum disturbance storm-time (Dst) value reaches −168 nT at 16:00 UT. To illustrate the ionospheric features under magnetically disturbed condition, GPS observations on the 17 and 19 August 2003, which are magnetically quiet days, are used to compare the variation of the ionospheric structure on the storm day. Figure 6 shows the variations of the IED with altitude and latitude at 21:00 BT (13:00 UT) during the magnetically active period on 18 August 2003 and magnetically quiet period on 17 and 19 August 2003. Comparing figure 6(a) with figure 6(b), one can see that IED in F region was enhanced between north latitude 10◦ and north latitude 35◦ during the geomagnetic storm on 18 August 2003, and the positive storm phase effects appeared. The maximum enhancement of the IED occurred between north latitude 15◦ and north latitude 25◦ with a value of 2.6 times. The negative storm phase effect of the ionosphere however
242
Wen Debao et al
Figure 6. Two-dimensional images of IED over China at 13:00 UT on magnetic quiet days (figure 1(a) and figure 1(c)) and magnetic storm days (figure 1(b)). (a) August 17, 2003, (b) August 18, 2003 and (c) August 19, 2003. (The unit of electron density is 1011 e/m3 .)
appeared latitudinally from north latitude 35◦ to north latitude 55◦ . The reconstructed results show that the storm phase effects are latitude dependent. Similar characteristics of the geomagnetic storm can also be found in other time periods during the storm day. In figure 6(b), a disturbed structure of the ionosphere over China occurred on the day. Meanwhile, one can see that the ionospheric equatorial anomaly still existed, and the equatorial anomaly crest moved to north latitude 27◦ , and then the crest of anomaly structure moved back to the original geographic locations at 21:00 BT (13:00 UT) on 19 August 2003 (figure 6c). 6. Discussion and conclusion In this paper, to reconstruct the ionospheric imaging with high temporal-spatial resolution and high computational efficiency, an improved ART algorithm is proposed. A numerical experiment has been carried out in order to verify its feasibility and reliability and its advantages to the ART algorithm. Simulated results demonstrate that the IART is superior to the classical ART in the computational efficiency and reconstructed accuracy. Combining this method with the GPS data from the CMONOC under magnetically quiet and storm days, three-dimensional ionospheric images over China are first reconstructed with unprecedented details. From the tomographic images during the magnetically quiet days, two prominent features (e.g., equatorial anomaly and the tilting of the ionization crest) of the ionosphere over China can be seen. The observed tilt of the anomaly crest is consistent with recent simulation studies (Balan and Bailey 1995; Bailey et al 1997) which predict that the anomaly crest occurs at lower latitudes with increasing altitude. Meanwhile, one can see that ionospheric storm phase effects and disturbed features can be clearly revealed from the tomographic images under storm conditions.
Past data, such as those obtained from ionosondes, did not provide spatial resolutions comparable to that which is now capably provided by images reconstructed tomographically from TEC data. Using such tomographic images, the development of equatorial anomaly during the magnetically quiet days may be observed. Although empirical ionospheric models such as the IRI2001 model are very useful for giving diurnal variations of the ionosphere, they can only give the monthly average behavior of the ionosphere. Therefore, the results depart from the true diurnal variation of the ionosphere. In addition, empirical ionospheric model cannot reveal the disturbed features under storm conditions. Reconstructed results during magnetically quiet and storm days show that GPSbased CIT technique can not only be used to map three-dimensional density profile in a short period of time but also the disturbed structure of the ionosphere over China. To reveal the ionospheric disturbed feature over China, Xia et al (2005) use the GPS observations of 12 ground stations from CMONOC to study the development of equatorial anomaly under storm days. In their study, they use the TEC technique to reflect the development of equatorial anomaly. Because of the reason described in section 1, their results are only used to study the horizontal variation of anomaly structure. In comparing their results with that of this work, one can see that the tomographic images can reflect the development of the anomaly structure in full dimensions under storm condition. In this work, a comparison study has also been carried out to verify the reliability of the tomographically reconstructed results. The availability of ionosonde data recorded at Wuhan station provides the verification for the reconstructed results. It indicates that the GPS observation data of the CMONOC has the potential for significant improvement in the understanding of the ionosphere over China and complements the
Monitoring the three-dimensional ionospheric electron density distribution disadvantages of the study done over several decades using ionosonde data in the China region. The reconstructed results indicate that GPS-based CIT technique is capable of providing valuable experimental support for understanding the complex behavior of low latitude F region. It can be seen that the number of CMONOC GPS observation stations is increasing and becomes more evenly distributed. In addition, space-based GPS data is also becoming more and more abundant, with GALILEO and other global navigation satellite systems to be implemented. All of these will facilitate better opportunities to further investigate the properties of the ionosphere. So, it is intended that the GPS-based tomography method will play a significant role in many application fields that need high accuracy ionosphere correction or other related services, such as geodesy, GPS/GNSS high precision positioning and surveying, satellite altimetry, communication and navigation.
Acknowledgements The authors would like to thank data center of the Crustal Movement Observation Network of China for providing the ground-based GPS tracking station data. Professor Libo Liu from the Institute of Geology and Geophysics of Chinese Academy of Sciences is also specially thanked for providing ionosonde data. ISDC GFZ provided the CHAMP occultation measurements. This research is supported by the National Science Fund for Distinguished Young Scholars of China (Grant No. 40625013) and the National Natural Science Foundation of China (Grant No. 40674012 and No. 40474009). Lastly, we specially thank Dr Huo Xingliang from the Institute of Geodesy and Geophysics for providing the data of the instrumental bias.
References Afraimovich E L, Astafieva E I and Voyeikov S V 2004 Isolated ionospheric disturbances as deduced from global GPS network; Ann. Geophys. 22 47–62. Austen J R, Franke S J and Liu C H 1986 Applications of computerized tomography techniques to ionospheric research; In: Radio beacon contribution to the study of ionization and dynamics of the ionosphere and corrections to geodesy (ed.) A Tauriainin (Finland: Oulu) pp. 25–32. Austen J R, Franke S J and Liu C H 1988 Ionospheric imaging using computerized tomography; Radio Sci. 23 299–307. Bailey G J, Balan N and Su Y Z 1997 The She− eld University plasmasphere ionosphere model – A review; J. Atmos. Sol. Terr. Phys. 59 1541–1552.
243
Balan N and Bailey G J 1995 Equatorial plasma fountain and its effects: Possibility of an additional layer; J. Geophys. Res. 21 21,421–21,432. Bilitza D 2003 Internation Reference Ionosphere; http://nssdc.gsfc.nasa.gov/space/model/ionos/iri.html. Bust G S, Garner T W and Gaussiran T L 2004 Ionospheric data assimiliation 3 dimensional (IDA3D): a global, multisensor, electron density specification algorithm; J. Geophys. Res. 109 doi: 10.1029/2003JA010234. Fremouw E J, Secan J A and Howe B M 1992 Application of stochastic inverse theory to ionospheric tomography; Radio Sci. 27 721–732. Gao Y and Liu Z Z 2002 Precise ionospheric modeling using regional GPS network data; J. GPS 1 18–24. Hajj G A, Ibanez-Meier R, Kursinski E R and Roman L J 1994 Imaging the ionosphere with the Global Positioning System; Int. J. Imag. Syst. Technol. 5 174–184. Hajj G A and Romans L J 1998 Ionospheric electron density profiles obtained with the global positioning system: results from the GPS/MET experiment; Radio Sci. 33 175–190. Hansen A J, Walter T and Enge P 1997 Ionospheric correction using tomography; In: Proceedings of the institute of navigation; GPS-97, pp. 249–257. Hernandez-Pajares M, Juan J M and Sanz J 1998 Global observation of ionospheric electronic response to solar events using ground and LEO GPS data; J. Geophys. Res. 103 20,789–20,796. Hernandez-Pajares M, Juan J M and Sanz J 2000 Application of ionospheric tomography to real-time GPS carrier-phase ambiguities, at scales 400–1000 km and with high geomagnetic activity; Geophys. Res. Lett. 27 2009–2012. Howe B M, Runciman K and Secan J A 1998 Tomography of the ionosphere: Four-dimensional simulations; Radio Sci. 33 109–128. Huo X L, Yuan Y B, Ou J K, Wen D B and Luo X W 2005 The diurnal variations, seminal annual and winter anomalies of the ionospheric TEC based on GPS data in China; Prog. Nat. Sci. 15 56–60. Jakowski N, Sardon E, Engler E, Jungstand A and Klahn D 1996 Relationship between GPS-signal propagation errors and EISCAT observations; Ann. Geophys. 14 1429–1436. Jin S G, Park J U, Wang J L, Choi B K and Park P H 2006 Electron density profiles derived from ground-based GPS observations; J. Nav. 59 395–401. Kunitsyn V E, Andreeva E S and Razinkov G O 1997 Possibilities of the near-space environment radio tomography; Radio Sci. 32 1953–1963. Liu Z Z 2004 Ionosphere tomography modeling and applications using Global Positioning System (GPS) measurements; Ph.D thesis, Calgary University, Calgary, Canada. Ma X F and Maruyama T 2005 Three-dimensional ionospheric tomography using observation data of GPS ground receiver and ionosonde by neural network; J. Geophys. Res. 110 doi: 10.1029/2004JA010797. Mitchell C N and Spencer P S 2003 A three-dimensional time-dependent algorithm for ionospheric imaging using GPS; Ann. Geophys. 46 687–696. Na H and Lee H 1991 Orthogonal decomposition technique for ionospheric tomography; Int. J. Imag. Syst. Technol. 3 354–365. Otsuka Y, Ogawa T, Saito A, Tsugawa T, Fukao S and Miyazaki S 2002 A new technique for mapping of total electron content using GPS network in Japan; Earth Planets Space 54 63–70. Raymund T D, Austen J R, Franke S J, Liu C H, Klobuchar J A and Stalker J 1990 Application
244
Wen Debao et al
of computerized tomography to the investigation of ionospheric structure; Radio Sci. 25 771–789. Raymund T D 1995 Comparisons of several Ionospheric Tomography Algorithms; Ann. Geophys. 13 1254–1262. Rius A, Ruffini G and Cucurull L 1998 Improving the vertical resolution of ionospheric tomography with GPS occultation; Geophys. Res. Lett. 24 2291–2294. Ruffini G, Flores A and Rius A 1998 GPS tomography of the ionospheric electron content with a correlation function; IEEE. T. Geosci. Remote. 36 143–153. Wen D B, Yuan Y B, Ou J K, Huo X L and Zhang K F 2007 Ionospheric temporal and spatial variations during the 18 August 2003 storm over China; Earth Planets Space 59 313–317. Xia C L, Wan W X, Yuan H, Zhao B Q and Ding F 2005 Analysis of the intense magnetic storm of July 2000 and of October 2003 using the technique for nowcasting of GPS TEC data; Chinese J. Space Sci. 25 259–266. Yang Y and Zhang S 2005 Adaptive fitting of systematic errors in navigation; J. Geodesy 79 43–49.
Yizengaw E, Dyson P L, Essex E A and Moldwin M B 2005 Ionosphere dynamics over the southern Hemisphere during the 31 March 2001 severe magnetic storm using multi-instrument measurement data; Ann. Geophys. 23 707–721. Yin P and Mitchell C N 2005 Use of radio occultation data for ionospheric imaging during the April 2003 Disturbances; GPS Solu. 9 156–163. Yuan Y B and Ou J K 1999 The effects of instrumental bias in GPS observations on determining ionospheric delays and the methods of its calibration; Acta Geodaetica et Cartographica Sinica 38 110–114. Yuan Y B and Ou J K 2001 The first study of establishing China grid ionospheric model; In: Proceedings of Institute of Navigation, ION GPS-2001, Salt Lake City, September, pp. 2516–2524. Yuan Y B and Ou J K 2002 Differential Areas for Differential Stations (DADS): A new method of establishing grid ionospheric model; Chinese Sci. Bull. 47 1033–1036.
MS received 7 September 2006; revised 16 December 2006; accepted 8 January 2007