Aug 7, 2010 - gas slugs occurring every 90 to 100 s [Johnson et al., 2004; ..... Jeff Johnson, Matthew Patrick and Jeff Witter, for helping in the data acqui-.
GEOPHYSICAL RESEARCH LETTERS, VOL. 37, L15303, doi:10.1029/2010GL043516, 2010
Monochromatic infrasonic tremor driven by persistent degassing and convection at Villarrica Volcano, Chile M. Ripepe,1 E. Marchetti,1 C. Bonadonna,2 A. J. L. Harris,3 L. Pioli,2 and G. Ulivieri1 Received 8 April 2010; revised 25 May 2010; accepted 8 June 2010; published 7 August 2010.
[1] Infrasonic data collected at Villarrica volcano (Chile) in March 2009 show a sustained, continuous, infrasonic oscillation (tremor) with a monochromatic low frequency content at ∼0.75 Hz. This tremor is extremely stable in time both at the summit and at a distal (∼4 km) small aperture array. Infrasonic tremor is characterized by discrete high amplitude bursts with a cyclic recurrence time of ∼40 s and is well correlated (0.93) with seismic tremor. These new data are compared with previous datasets collected in 2002 and 2004 during different levels of activity. All data show the same persistent infrasonic tremor and have the same strong correlation with seismic tremor. The stability and correlation of infrasonic and seismic tremor indicate the existence of a sustained and continuous process, which we suggest is related to the gravity‐driven bubble column dynamics responsible for conduit convection. Citation: Ripepe, M., E. Marchetti, C. Bonadonna, A. J. L. Harris, L. Pioli, and G. Ulivieri (2010), Monochromatic infrasonic tremor driven by persistent degassing and convection at Villarrica Volcano, Chile, Geophys. Res. Lett., 37, L15303, doi:10.1029/2010GL043516.
amplitude is modulated by emergent transients lasting 150 m, with activity associated with the continuous degassing process being characterized by gas bursting and explosive activity from vents that are 5 to 20 m in diameter [Gurioli et al., 2008; Palma et al., 2008], as well as by occasional lava lake activity [Witter et al., 2004]. [3] Measurements of SO2 flux at Villarrica by Witter et al. [2004] and Palma et al. [2008] indicate a highly variable SO2 flux with mean values of ∼200 t/d. Witter et al. [2004] suggest that the persistent (excess) degassing is consistent with magma column convection. Seismic activity at Villarrica is quite well described and consists mostly of persistent seismic tremor [Fuentealba et al., 2000; Ortiz et al., 2003; Calder et al., 2004; Palma et al., 2008], with a frequency content of 0.9 to 2.3 Hz [Fuentealba et al., 2000]. The
1 Dipartimento di Scienze della Terra, Università di Firenze, Florence, Italy. 2 Section des Sciences de la Terre et de l’Environnement, Université de Genève, Geneva, Switzerland. 3 Laboratoire Magmas et Volcans, Université de Blaise Pascal, Clermont‐Ferrand, France.
Copyright 2010 by the American Geophysical Union. 0094‐8276/10/2010GL043516
[5] Geophysical experiments at Villarrica volcano were performed during three field surveys in December 2002, November 2004 and March 2009 [Johnson et al., 2004; Gurioli et al., 2008]. As part of these campaigns, seismic, infrasonic and thermal sensors were installed on the crater rim to provide an integrated analysis of the degassing activity (Figure 1). During the December 2002 experiment, data were collected continuously at the summit for a 10‐day‐long period. Instead, during the November 2004 and March 2009 experiments, summit‐based acquisition periods lasted between 3 and 6 hours. At the same time, seismic and infrasonic stations located at the base of the volcano (∼4 km from the vent) ran for 6–9 days. In March 2009 infrasound was also recorded using a four‐element infrasonic array with an aperture of 170 m. This was deployed at an elevation of ∼1500 m. a.s.l. on the north‐west flank of the volcano at a distance of ∼4 km from the summit crater (Figure 1). [6] Pressure sensors deployed both on the summit and at distal stations consisted of All Sensors pressure transducers in March 2009, with a sensitivity of 25 mV/Pa and resolution of 0.02 Pa in the 0.1–50 Hz frequency band. In November 2004, MKS differential pressure transducers were used, with a sensitivity of 38 mV/Pa in the 0.01–50 Hz frequency band, with electret microphones having a nominal sensitivity of 7 mV/Pa being deployed in December 2002. While seismic signals were recorded in 2004 and 2009 with a Guralp CMG 40T (30 s) broad‐band seismometer, in 2002 a vertical short‐period Mark (1 s) seismometer was deployed at the summit crater.
L15303
1 of 6
L15303
RIPEPE ET AL.: INFRASONIC TREMOR AT VILLARRICA VOLCANO
L15303
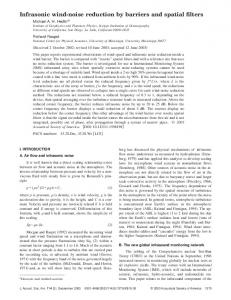
Figure 1. (a) Map of Villarrica showing the position of the stations deployed during the three field experiments, and the number of detections (log scale) of coherent infrasound across the 2009 array (06‐11/03/2009) as a function of multi‐channel semblance (ray) and infrasonic back‐azimuth, showing that infrasound is coming from the summit of Villarrica (∼140°N). Pictures of the summit crater at Villarrica during the (b) 2002, (c) 2004 and (d) 2009 experiments taken from the rim. [7] The level of the free surface during each experiment was ∼60 m below the crater rim in November 2004, and somewhat deeper (>150 m) in November 2002 and March 2009 (Figure 1). Degassing and explosive activity were also very different between the three periods. November 2004 was a period of relatively high activity [Palma et al., 2008], characterized by mild Strombolian explosions and lava spattering from a ∼20 m wide vent [Shinohara and Witter, 2005; Gurioli et al., 2008]. While gas bursting and emissions of scoria and bombs that rose and fell within the crater characterized activity in December 2002, degassing in March 2009 was weak with no visible or audible explosions.
3. Monochromatic Infrasonic Tremor [8] During the March 2009 experiment, the small‐aperture infrasonic array detected a persistent low frequency (from 0.5 to 2 Hz) infrasonic signal characterized by a sustained, monochromatic (0.75 Hz) oscillation with a large amplitude modulation (Figure 2a). This signal was highly coherent across the array (Figure 2a) and the multi‐channel semblance analysis [Ripepe and Marchetti, 2002] revealed that all of the infrasonic energy (>0.3 Hz) arrived from the direction of the summit (Figure 1a). The infrasonic waveforms recorded by the summit system were near‐perfectly correlated (>0.98), in the 0.3–3 Hz band, with the data from the array at a distance of ∼4 km (Figure 2a). The high correlation between the two stations demonstrates that the monochromatic spectrum of this persistent infrasonic oscillation is not due to an
atmospheric path effect, but is generated by the shallow system (conduit) dynamics. Waveforms recorded at 200 m and 4000 m show a time delay consistent with a sound speed of 340 m/s and an amplitude decay explained by geometric spreading (1/r). This shows that infrasound can maintain unaltered information (Figure 2a) on the source process when collected at a distance of several kilometers from the vent, and suggests that infrasonic activity at Villarrica can be easily monitored from a few kilometers. [9] This infrasonic oscillation (tremor) was continuously recorded during the entire six‐day‐long duration of the 2009 experiment, showing no significant frequency changes, harmonics or gliding effects (Figure 2b), as have been observed at Arenal [Hagerty et al., 2000]. From this point of view infrasonic tremor recorded at Villarrica is somewhat unique and indicates a highly stable source process. To explore this spectral stability, we analyzed the infrasonic records collected during the experiments of December 2002 and November 2004. Once corrected for the frequency response of the different pressure sensors used during the experiments, spectral analysis revealed that also in 2002 and 2004 infrasound was characterized by a similar low frequency signal with the same monochromatic behavior (Figure 2b). The spectral peak was at 0.75 Hz in 2002 and ∼1 Hz in 2004.
4. Seismo‐acoustic Tremor [10] Seismic data collected at the summit during the three experiments show mostly tremor (Figure 2a) with a stable
2 of 6
L15303
RIPEPE ET AL.: INFRASONIC TREMOR AT VILLARRICA VOLCANO
L15303
Figure 2. One‐hundred‐second‐long samples of infrasonic data recorded in 2009 at the summit of Villarrica (prs) and seismo‐ acoustic data recorded by the four‐elements of the array (p1‐p4) and co‐located seismometer (ew). (a) Infrasonic data are 0.3– 3 Hz band‐pass filtered and summit infrasound is delayed by 11.8 s. Power spectral density for (b) infrasonic and (c) seismic data sets recorded at the summit during 2009 (red), 2004 – reduced by a factor of 10 ‐ (blue) and 2002 (black). Tremor recorded at the distal station (∼4 km) shows a peaky spectrum (dashed line) concentrated in the low (0.6 to 3 Hz) frequency band. spectral content within two major spectral bands spanning the 0.6 to 3 Hz and 5 to 10 Hz ranges (Figure 2c). However, at the distal stations the high‐frequency component is lost (Figure 2c) and tremor is characterized by the low‐frequency content (0.6–3 Hz), which typically dominates the volcano‐ seismicity at Villarrica [Fuentealba et al., 2000] and falls within the same frequency range (0.5–2 Hz) of the infrasonic tremor. Spectral amplitude also varies according to the intensity of the observed activity, being larger during the relatively vigorous explosive (or degassing) phase of November 2004, and lower in March 2009 and December 2002 when the free surface was relatively deep inside the conduit and activity levels were lower (Figure 1b and 1d). This is a quite well‐ known behavior at Villarrica [Palma et al., 2008] and other open‐vent volcanic systems characterized by persistent magma degassing such as Stromboli, Etna and Masaya [e.g., Ripepe et al., 1996, 2001; Métaxian et al., 1997]. Spectral stability and amplitude changes of the low‐frequency component point to a stationary source intimately related to the dynamics of the magma degassing in the shallow system.
5. Seismo‐Acoustic Periodic Energy Oscillation [11] At a longer time scale of hours to days, the amplitude of the low‐frequency (