Monthly Output Index for the U.S. Transportation Sector
KAJAL LAHIRI*, HERMAN STEKLER**, WENXIONG YAO*, and PEG YOUNG***
* University at Albany - SUNY ** George Washington University *** Bureau of Transportation Statistics
Correspondence Address: Prof. Kajal Lahiri, Economics Department, University at Albany SUNY, Albany, NY 12222. Email:
[email protected]. Tel: (518) 442 4758.
1
ABSTRACT We develop a monthly output index of the U.S. Transportation sector over 1980:1-2002:4 covering air, rail, water, truck, transit and pipeline activities. Separate indexes for freight and passenger are also constructed. Our total transportation output index matches very well with the annual transportation output figures produced by the Bureau of Labor Statistics (BLS) and the Bureau of Economic Analysis (BEA). The strong cyclical movements in the transportation output appear to be more synchronized with the growth slowdowns rather than full-fledged recessions of the U.S. economy. The index has led the turning points of the six NBER-defined growth cycles over the period with an average lead-time of 6 months at peaks and 5 months at troughs.
2
INTRODUCTION In this paper we develop an index of monthly economic activity for the transportation sector of the U.S. economy. In contemporary business cycle analysis, output is one of the four coincident economic indicators of the overall economy. Output refers to the physical quantity of items produced, as distinct from sales value, which combines quantity and price. In our context, transportation output measures freight movements and passenger travel by different transportation modes, i.e., subsectors of the transportation sector. There is, however, no unique indicator to measure the output of the transportation sector, on a monthly basis. The Bureau of Economic Analysis (BEA) and Bureau of Labor Statistics (BLS) of the federal government produce output measures for the transportation sector, but only on an annual basis. Unlike the manufacturing sector, the Federal Reserve Board (FRB) does not produce an index of production for service industries like the transportation sector. Even though there has been considerable development of NBER type indicator analysis for the whole economy, little work has been done in developing sectoral indicators. While Layton and Moore (1989) have developed leading indicators for the service sector, there has been no monthly index of output for particular service industries. In order to construct a monthly index of output for the transportation sector, it is, first, necessary to determine the constituent parts of the industry. We do that in the next section. Then we discuss the output data that are available for each of these components of the transportation sector. We will also explore possible use of the output index in business and growth cycle analysis. The newly developed output index will be compared against the annual transportation output figures produced by BEA and BLS.
3
COMPONENTS OF THE TRANSPORTATION SECTOR Our definition of the industry is based on the North American Industrial Classification System (NAICS). This definition will also conform to the Transportation Satellite Accounts (TSAs) associated with the National Income and Product Account (NIPA). So far, however, TSAs are only available for the years 1992 and 1996. Even though the transportation activities in general include House Production of Transportation Services (HPTS) through user-operated automobiles, and in-house as well as forhire transportation by commercial establishments, in this study we only consider for-hire commercial activities for lack of available monthly data on the other two components. Official data on transportation services, defined in either SIC or NAICS, are confined only to establishments that provide passenger and/or freight transportation services for a fee. Neither in-house transportation nor HPTS are counted in.1 Although market activities by NAICS-defined establishments do not cover 100% of the transportation activities, it is nevertheless the most informative component of transportation sector. For-hire transportation is defined to include the following subsectors: Air Transportation, Rail Transportation, Water Transportation, Truck Transportation, Transit and Ground Passenger Transportation, and Pipeline Transportation. While these sectors are representative of economic activity in the transportation industry, and are closely associated with the sectors in the satellite NIPA, there is, nevertheless, a problem that has to be noted. These series do not include all of the subsectors that constitute the for-hire portion of the transportation sector of the economy. The
1
Han and Fang (2000) and Chen et al. (2003) have shown the importance of in-house and household components respectively, but their estimates are currently annual. Arguably, these two components should be included as part of the transportation output as and when their monthly measures are developed.
4
subsectors that are included in NAICS for transportation sector but are excluded here are: Scenic and Sight-seeing Transportation, Support Activities for Transportation, Postal Service, and Couriers and Messengers. The industries that are included correspond to NAICS codes 481 - 486, which cover 89.7% - 93.9% of the total transportation during 1980 - 2000 according to “gross product by industry” published in Survey of Current Business (November, 2001). Nevertheless a monthly useful index of economic activity in the transportation sector can be derived from these series, because the subsectors that they represent constitute a significant portion of the entire industry. Moreover, the transportation subsectors that we are using to construct the index of transportation output account for a substantial portion of U.S. GDP. The aggregate value of forhire transportation accounted for 3.1% and 3.0% of GDP in 1992 and 1996 respectively, (Fang et al. 1998, 2000).2 Given the critical role that transportation plays in facilitating economic activity between sectors and across regions, index of its output can potentially be an important indicator for either the current or future level of general economic activity, see Ghosh and Wolf (1997).
DATA The total Transportation Output Index was developed from eight series. Five of these series measure the level of activity in the freight component of the industry. The remaining three measures the level of passenger transportation services. The series used to measure the freight component of transportation services activity were: trucking tonnage, air revenue ton miles, rail revenue ton miles,3 a waterway tonnage indicator, and pipeline movements of petroleum products
2
These numbers and other measures on the importance of transportation were derived from the value added of the industry. Using different concepts about the scope of the transportation industry would yield different measures of its importance, varying anywhere from 3.09% (Transportation GDP) to 16.50% (Transportation-driven GDP). See Han and Fang (2000). 3 The monthly Rail revenue passenger miles data were obtained by interpolating the quarterly figures. We are now working on weekly railroad data on carloads and intermodal traffic to construct monthly series. These figures will be
5
and natural gas. Similarly, the passenger output index was constructed from three series: air revenue passenger miles, rail revenue passenger miles,4 and national transit Ridership. The sources and characteristics of all of these series are provided in the Appendix 1.5 With the exception of the pipeline data, all of the data were available from 1980:1-2002:4. The pipeline data were available from 1985:1 onward. The series that we use to measure pipeline transportation is constructed from data on movements of crude oil & petroleum products, consumption of natural gas, and the field production in Alaska. Crude oil & petroleum products are moved between different Petroleum Administration for Defense Districts (PADDs), while natural gas is delivered to final users. The Alaska field production of crude oil & petroleum products is added because it almost never enters the PADD system.6 This addition accounts for the movement within Alaska along the Trans-Alaska Pipeline from the North Slope to the port of Valdez. However, movements of crude oil & petroleum and natural gas are measured in different units. The first is measured in millions of barrels per day while natural gas is measured in cubic feet. It is possible to combine them by converting both to tons (or Btu’s) with physical conversion factors.7 Then the converted tonnage of petroleum and natural gas are added together as the measure of total movements by the pipelines. Just as with the other series, these figures are converted into index number form with 1996 = 100.
used to update the index. 4 Due to a change in data collection procedure, Rail revenue passenger mile (RPM) values during 1980:1-1985:12 were unusable. The RPM values for these months were backcasted based on regression of rail RPM on rail Revenue Passenger (RP), Rail_RPM = -27991243.120 + 51725.329*Rail_RP - 0.485*Rail_RP2, estimated over 1986:12002:4. Adjusted R2 = 0.562. 5 The transit data is monthly, but is available only on a quarterly basis. 6 Alaskan petroleum used to be mostly consumed within Alaska or other PADD 5 regions due to an export ban. This ban was lifted in the early 1990s, and now most of it is exported to Japan. 7 The conversion factors were obtained from the Department of Energy (DOE). They are presented in the Appendix 1. DOE actually has two types of conversion factors, one based on Btu’s and one based on mass. Both yield similar estimates.
6
In constructing the index, the weights were adjusted for the years in which the pipeline data were not available. Each series was then seasonally adjusted using the Census X-11 program.8 We used the econometric software EViews (version 3.1) for the purpose. Since all of these series measure real quantities, no price deflation was required.
INDEX CONSTRUCTION Weights for the Components Series The total output of this industry is an aggregate of real output generated by each of the components. The data from the eight series were used to construct the Transportation Output Index. Each of these series represents the output quantity of a subsector of the transportation sector. Therefore, each of these series was converted into index number form with 1996 =100. In order to construct the Transportation Output Index, ImA (superscript, A, denotes “aggregate”, and subscript, m, denotes the month), for the entire transportation sector, the indexes of these subsectors were combined by assigning weights to each of the components. The weights measure the relative importance of each transportation subsector to the entire sector. They are also interpreted as “price” of services provided by different transportation modes for quantity indexes. While there are several different ways of measuring the relative importance of each subsector, we used value added weights from NIPA. In our context, the value added weights are more appropriate than gross output because transportation is an intermediate sector whose economic contribution is only the difference in values of goods in the process of transportation. This exactly conforms to the concept of GDP. These weights were obtained from the annually updated “gross product by industry” table published in Survey of Current Business (November 2001). We
8
The X-11 program was originally developed by Shiskin, Young and Musgrave (1967).
7
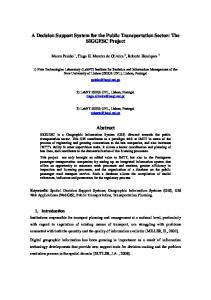
disaggregated airlines and railroads weights into their respective freight and passenger components by using the ratios of their operating revenues for the particular year. The historic annual weights are depicted in Figure 1 for each component of the Transportation Output Index. From the graph, it is clearly seen that, since 1981, air passenger, which dominates the airline industry has an increasing weight relative to other subsectors, and railroad freight, which dominates rail transportation has a decreasing weight. From 1980 to 2000, the weights for airline industry and railroad transportation changed from 18.8% to 33.0%, and 21.5% to 8.1%, respectively. The trucking has the maximum weight among all subsectors throughout the period, always in excess of 40.0%. The weights for the others (i.e., rail passenger, air freight, pipelines, water transportation and public transit) were always below 8.0% and changed little over this period. The graph also reflects the fact that economy has become less freight-intensive in that the total weight for freight movements relative to the total transportation activities has steadily shrunk from 72.3% to 61.1% in past two decades. Fisher-ideal Index Given the weights, component series are aggregated into one single index using different index methods. Economic theory indicates that the preferred measure of quantity change is a geometric mean of the Laspeyres index and the Paasche index. This results in the so-called Fisher-ideal quantity index. Fisher-ideal index is one of the “superlative” aggregate indexes, which means current-weighted, while the other two are fixed-weighted using weights in a single period. The use of fixed-weighted measures of quantity index, such as those derived from Laspeyres quantity index may result in a “substitution bias” that causes an overstatement of output growth for periods after the base year and an understatement of growth for periods before the base year, see Landefeld and Parker (1995) for further explanation. The tendency of “substitution bias” reflects 8
the fact that those commodities for which output grows rapidly tend to be those for which prices change less proportionately. Although this bias may be small enough to be safely ignored for shorter sample periods, the output measures derived from a fixed-weighted index can become increasingly subject to “weighting effects” as the time between weighting period and the current period lengthens. A similar but opposite problem occurs with the other type of fixed-weighted index, the Paasche quantity index, which uses current period prices as weights. The Fisher-ideal index registers changes that fall between those from Laspeyres and Paasche indexes, and is a chain index. Because of many advantages, BEA has been publishing NIPA with this new methodology since 1996 (Landefeld and Parker, 1995). The Board of Governors of Federal Reserve Board has also adopted the Fisher-ideal formula in constructing the Industrial Production Index (Corrado, Gilbert and Raddock, 1997) since mid 1990s. Conceptually our transportation output measure is very similar to FRB’s Industrial Production Index in the sense that both of them measure the physical production of a sector. The new formula for the growth of monthly transportation indexes is given by I I
A m A m −1
=
∑ I j
∑ I j
jm
P
jm − 1
P
jy ( m − 6 )
* jy ( m − 6 )
∑ I ∑ I j
j
jm
P P
jm − 1
(1)
jy ( m + 6 )
, jy ( m + 6 )
where Ijm is output index in subsector j in month m; Pjy(m) is the value added weight for subsector j in year y. The subscript, y(m), denotes “year containing month m.” The Transportation Output Index (Fisher-ideal) uses annual outputs weighted by previous, current and next year prices. To compute output quantity index as a chain-typed annually weighted Fisher index, we require unit value added for both current and the next year. While the table for “gross product by industries” is published usually in the November issue of Survey of Current Business each year, the estimates
9
for recent periods were obtained in two steps. First, industry producer prices (PPI) for each subsector of transportation (for Transit, we used consumer price index of intracity transportation because PPI is not available for this subsector) that BLS produces on a monthly basis, were extrapolated to obtain the annual averages for the current year (i.e., 2002) and the next year (i.e., 2003). Second, the unit value-added measures were extrapolated based on these annual averages of industry PPIs. The Transportation Output Index, as well as its freight and passenger components subtotals, is computed as the cumulative product of a monthly series of these growth estimates from 1980:1 onward. For I0A = 100 in the base year,
I
A m
=
I I
A m A m −1
×
I I
A m −1 A m −2
×" ×
I I
A 1 A
× 100
.
(2)
0
Figure 2 compares the Fisher-ideal index of total transportation output with its alternative index computed from the linked-Laspeyres.9 They are found to be almost identical. Any difference would arise from the weights they are using. As seen from Figure 1, the weight on the largest component, trucking, has been pretty stable in the sample period, which limits any potential substitution bias. The Federal Reserve Board also found a similar result when they recomputed their Industrial Production Index using the Fisher-ideal index (Corrado, Gilbert and Raddock, 1997).10 However, because of its potential advantages, the transportation indexes derived from Fisher-ideal quantity index will be used for our analysis throughout this paper.
9
The standard formula for linked-Laspeyres quantity index is ImA = Σ Im.p0 / Σ I0.p0 where p0 is the price in the base period. (Note that we set I0 = 100.) It shows changes in physical movements in the transportation sector with prices held fixed at base year values, which is 1996 here (Corrado, Gilbert and Raddock, 1997). Since the public transit subsector is often supported by public subsidies, its value added figures are sometimes negative. As a result, we had to calculate the weight assigned to this sector as the average of the ratio of its output to the total transportation industry output for 1996. For airlines and railroads we determined the relative amount of operating revenue obtained from transporting passengers and freight to disaggregate the weight into passenger and freight. The weights for the Laspeyres index are obtained from 1996 TSA (Fang et al., 2000) and presented in Table 1. 10 We thank Professor Ariel Pakes of Harvard University for an illuminating discussion on this finding.
10
THE CHARACTERISTICS OF THE INDEX Classical Business Cycles The monthly values of the resulting indexes for the period 1980:1 - 2002:4 are tabulated in Appendix 2. The Total Transportation Output Index, the Freight Transportation Output Index and the Passenger Transportation Output Index are presented in Figures 3a - 3c. Dark shaded areas represent the NBER-defined recessions for the U.S. economy and lightly shaded areas represent the NBER-defined growth cycle recessions for the U.S. economy. These indexes are all based on the seasonally adjusted component series that are individually graphed in Appendix 1. Certain characteristics of these indexes should be noted. First, all of them show strong upward trends with the Total Transportation Output Index showing a compounded annual growth rate of 2.65% during 1980:1 - 2001:8. Both the Passenger Index and Freight Index also grew over this period, with rates of 3.19% and 2.56%, respectively. The reason we only compared the growth rates up to 2001:8 is because the event of 9/11 affected drastically the passenger component of the transportation sector. The indexes also display declines in their values reflecting the economic recessions of the 1981:7 - 1982:12, 1990:7 - 1991:3, and 2001:3 – 2001:11. Sharp downward movements are also observed in both the Freight Index and the Passenger Index with the impact of 9/11 most pronounced in the Passenger Index. Overall, the cyclical movement of the Freight Index dominates that in the Total Transportation Output Index. The peak (trough) is defined to have occurred when the Transportation Output Index reached the highest (lowest) point of its cyclical fluctuations, which would exclude some temporary positive (negative) irregular disturbances from consideration. We followed the NBER dating algorithm described in Bry and Boschan (1971, Chap 2) to identify each of the peaks and
11
troughs. The algorithm uses a series of rules to distinguish the real peaks and troughs from spurious ones. For instance, a movement from a peak to a trough (phase) cannot be shorter than six months and a complete cycle must be at least fifteen months long. Using these criteria, the cyclical turning points of the Total Transportation Output Index together with the NBER business and growth cycle chronologies are reported in Table 2. From this table, we find that cyclical peaks in the Transportation Output Index occurred prior to the economic recessions of 1981:7 1982:12 and 2001:3 – 2001:11. Depending on how one identifies the Index’s cyclical peak in the 1988 - 1991 period, we define the peak in the Index to have occurred in 1988:2, nearly 29 months prior to the 1990:7-1991:3 economic recession. After 1988:2, the growth in the Index had stagnated. The Index got a monthly surge in 1988:12, followed by a period of steady decline. Following the Bry-Boschan censoring rule of identifying real peaks, we regard 1988:12 as a temporary disturbance. The transportation sector started to recover from 1989:7, but its growth was interrupted in 1990:8, which is one month after the beginning of the economic recession. The Index started to move up at about the same time as the economic recovery after 1991:3. The Total Transportation Output Index clearly peaked 16 months prior to the beginning of the latest recession. It appears that the Transportation Output Index had started to move up in 2001:6, but the events of 9/11 have distorted the data. September 2001 also marks the lowest point in aggregate transportation activity since its last peak in November 1999, and is roughly coincident with the recently announced trough of November 2001 for the latest economic recession. The Index has been recovering since then, albeit, with interruptions. Overall, the Transportation Output Index led the three peaks with a considerable lead-time (median 16
12
months);11 the signals for recovery were almost contemporaneous. The index would have given two false signals for economic recessions in 1984:8 and 1994:12. However, they were really not false in the sense that these peaks were followed by growth recessions in the economy. Hence, the strong cyclical movements in the transportation output appear to be more synchronized with the growth slowdowns rather than full-fledged recessions of the U.S. economy. This also suggests that the cyclical movements in these indexes foreshadow the growth cycles of the economy more consistently than the business cycles. Thus, the newly constructed transportation output index can be very useful in monitoring the fluctuations in general economic activity from the perspective of transportation. When we look at the freight and passenger transportation indexes separately in Figures 3b and 3c, we find that the cyclical movements in the Total Transportation Output Index are mostly determined by the movements in freight. Freight transportation index reached its peak and trough during the same months as the Total index during the recession of 1981:7 - 1982:11. The Passenger transportation index, on the other hand, did not have the corresponding cyclical movements during this period. The freight transportation activities dominated the transportation sector in the early 1980s. During the economic recession of 1990:7 to 1991:3, the peak of the Freight index occurred two months before that of the Total index, while the Passenger index started to decline in 1990:9 which is one month after the peak of the economy. A similar phenomenon occurred during the latest recession. The peak of the Freight index occurred at about the same time as the Total index, but with a much deeper amplitude. The Passenger index reached its peak 12 months later.
The event of 9/11 had more profound impact on passenger
11
During 1953-1982, the average lead-time of composite index of 11 leading indicators (CLI) relative to the NBERdefined reference cycles is 9.7 months at peaks and 4.6 months at troughs; see Table 11.4 in Zarnowitz (1992).
13
transportation than on freight transportation. As a result, the total index mimics the movement in the passenger index more closely during this recessionary episode than in previous occasions. The sequence of peaks and troughs in these indexes and their relationship to business cycles in the economy can actually reflect some interesting underlying linkages. Freight movements adjust early to the demand or supply shocks in the economy; these adjustments or fluctuations across different sectors can eventually lead to a full-fledged recession, or be limited to sectoral cycles. Passenger transportation activities are affected when the state of overall economy has changed due to demand shocks, especially in a recession. The last two recessions seem to follow this stylized scenario. Since every recession is caused by a mixture of different demand and supply factors, the relative movements in passenger and freight indexes may not always follow the above sequence. Overall, turning points in the Total Index stay between those of its two components, but the turning points of the total index tend to be closer to those of the Freight Index. Growth Cycles The growth cycles are periods when the economy undergoes alternating periods of decelerations and accelerations of growth that often do not develop into full-fledged recessions, see Zarnowitz (1992, Chapters 7 and 8) and Zarnowitz and Ozyildirim (2002). Growth cycles are less well known compared with classical business cycles, and they usually cover both full-fledged business cycles and growth slowdowns. Technically, the growth cycle refers to the cyclical component of a typical time series, which is the deviation of seasonally adjusted series from its estimated trend. Over our sample period, there were six such episodes in the overall economy, four of which
14
include the recessions of the period. They are all clearly discernable with major downswings in the Total Transportation Output Index in Figures 3a-3c. Depending on the method of estimation of the trend from a time series, growth cycles could be different. The conventional NBER algorithm to estimate the secular trend and identify the growth cycles is the Phase Average Trend (PAT) method (Boschan and Ebanks, 1978). The PAT starts with determining preliminary turning points based on the deviation from 75-month moving average (first approximation) of a deseasonalized time series. Then values at the turning points are averaged to obtain “phase averages” (each phase is defined on two turning points). The 3-item moving averages of these phase averages are subsequently computed to obtain the socalled “triplets”. The midpoints of the triplets are connected, and the connected level series is further adjusted to match the level of the original series. Then a 12-month moving average (second approximation) of the adjusted series yields the estimated secular trend.12 With the estimated trend, the NBER growth cycles are defined based on the deviation of the deseasonalized series from PAT. We then compare the growth cycles of the Transportation Output Index obtained using PAT to the NBER growth cycle chronology. The growth cycles of the Transportation Output Index together with its smoothed version are pitted against the NBER-
12
Since the calculation of PAT can be tedious, a good alternative would be the use of H-P filter (Hodrick and Prescott, 1997). H-P filter chooses the trend value St of the deseasonalized data Yt to minimize: 2 T T −1 . The penalty parameter λ controls the smoothness of the series. ( − ) + λ (( − )−( − )) 2
∑ y t =1
t
s
t
∑ s t=2
t +1
s
t
s
t
s
t −1
The larger the value of λ is, the smoother will be the trend. Currently, H-P filter can be implemented using most econometric softwares (such as EViews). Zarnowitz and Ozyildirim (2002) point out that the selection of the trend is inevitably associated with considerable arbitrariness, which has long been a source of puzzle in the literature of growth cycle. However, they found that estimated trends are generally similar between PAT and H-P filter when the value of λ is around 108,000 for monthly data, and PAT is superior to its alternatives in the matter of details. Consistent with their finding, with the value of λ=108,000, the two estimated trends based on PAT and H-P filter were very similar, as depicted in Figure 4. By its very nature, however, PAT attributes a somewhat bigger part of the cyclical movements to trend.
15
defined growth cycles for the overall economy in Figure 5. The smoothing was done using a filter developed by Statistics Canada (Hertzberg and Beckman, 1989). We find that the Total Transportation Output Index led the growth cycle consistently with average lead times of 6 at peaks and 5 months at troughs. Only for the economic slowdown of 1995:1 - 1996:1, the Transportation Output Index was roughly coincident both at the peak and the trough. Figure 5 also reveals slowdowns in the transportation sector during 1992:7 - 1993:8 and 1997:10 – 1998:8, which were not followed by corresponding slowdowns in the overall economy. The slowdown of 1992:7 - 1993:8 was mainly due to a sharp decline in air passenger travel at that time. The slowdown of 1997:10 – 1998:8 was rather short and shallow compared to others. Except for these caveats, our Transportation Output Index gave correct signals for all economy-wide slowdowns of the period. A look at the Freight Index and Passenger Index suggests that the classical business cycle and growth cycle characteristics of transportation output is mainly due to its freight component, and its passenger component do not show a consistent lead-lag relationship with economy reference cycle. We should, however, point out that the lead-time analysis presented above does not take into account either the lag involved in obtaining the data necessary to construct the series or the necessity of employing a filter rule that by its very nature involves a delay in identifying a turn. It is necessary to develop some filter rule (e.g., three consecutive decline rule for signaling a downturn) that would enable analysts, in real time, to distinguish between the irregular movements and the true signals of cyclical turns.13 After all, a leading indicator is only as good as the filter rule that interprets its movements. These rules typically involve trade-offs of accuracy 13
For a discussion of alternative rules for forecasting the cyclical movements of the Composite Index of Leading Indicators for the economy, see Stekler (1991, pp.169-81).
16
for timeliness and miss signals for false alarms, see Lahiri and Wang (1994). We have so far identified the peaks and troughs of the indexes from an ex-post perspective. Further analysis is needed to establish the ex ante predictive ability of the Transportation Output Index. In future research, we plan to develop filter rules that would enable us, in real time, to distinguish between the irregular movements and the true signals of cyclical turns.
COMPARISON WITH ALTERNATIVE OUTPUT MEASURES It is also possible to compare our Total Transportation Output Index with annual data that BEA and BLS produce on the Gross Output of the transportation sector. Gordon (1992), and more recently, Bosworth (2001) and Yuskavage (2001) have provided valuable insights into the different methodologies and data that BEA and BLS use to construct the output. The Office of Productivity and Technology of BLS maintains an annual series on transportation output that begins at 1987. Gullickson and Harper (2002) present an analysis with an experimental BLS output data based on a multifactor economic growth model that goes back to 1947. Since BEA went through a major overhaul in generating gross output data in the 1980’s, and after 1991 it switched to using the PPI index of BLS to compute the price deflator, we plotted the BEA series obtained from Survey of Current Business (November, 1997) only after 1991. Even though these four transportation output series are derived using four widely different approaches, they show remarkably similar trends, as depicted in Figure 6. In these graphs, values of all series were normalized at 1996 = 100. The average values of the four series are also very similar. The BEA series, which has a more comprehensive coverage and are benchmarked to five-year economic census, has stayed very close to our Transportation Output Index throughout the 90’s, whereas the BLS series seemed to have slowed down since 1998. More importantly, it appears that the three 17
alternative annual output measures reflect the long-term trends and our monthly transportation output measure is superior to them in reflecting cyclical movements in this sector. In the graph, our Transportation Output Index deviates temporarily from the other three series whenever there are recessions and growth slowdowns in the economy. Following Gordon (1992) and Bosworth (2001), in Table 3, we have presented alternative estimates of output growth in the transportation sector and its three major subsectors – trucking, railroads and airlines – during 1980 - 2000 as obtained from BEA, BLS experimental output series and our output measure. For this comparison, we did not include the BLS real output series because it is available only after 1987, and also because it is very similar to the BLS experimental series. The growth rates are also reported separately for 1980 - 1991 and 1992 - 2000. In computing these rates, we converted our monthly values to annual figures. For the total output, the growth rates of our index fall between BEA and BLS rates in all periods. The same is true for trucking except that our index has a higher growth rate than both BEA and BLS during 1992 2000. For the airlines, ours is almost the same as that of BLS experiment output, whereas the BEA figures are somewhat higher than the other two. For the railroads, ours has higher rates of growth than that of BEA and BLS for the overall period and in the 1990’s. During 1980 - 1991, the railroads growth rate of our index was in between the BEA and BLS values. Interestingly, we find that our monthly index has a lot more cyclical variation than the other three series. This is not surprising in the view of the fact that the BEA and BLS values are annual, and are benchmarked to five-year economic surveys. Given that we have constructed the total Transportation Output Index using monthly data on eight constituent series, most of which heretofore where were unused, it is heartening to note the level of concordance that we find in the 18
three series. The advantage of our approach, however, is that the index can be made available on a monthly basis such that the health of transportation sector can be monitored in real time.
CONCLUSIONS In this paper, we develop a monthly output index of the U.S. Transportation sector over 1980:12002:4 covering air, rail, water, truck, transit and pipeline activities. The included industries cover 89.7% - 93.9% of total for-hire transportation GDP during 1980 - 2000. We use both linkedLaspeyres and Fisher-ideal index methods to construct the indexes. These two series were found to be very similar. Separate indexes for freight and passenger are also constructed. The freight component of the index was found to dominate the movements in the total Transportation Output Index. Our total transportation output index matches very well with the annual transportation output figures produced by BLS and BEA, even though the monthly index displays more pronounced cyclical movements than these annual measures. Thus, our approach in measuring output in the transportation sector can be useful in the measurement of productivity in this sector, and can be extended to other non-manufacturing sectors as well. We also examine the characteristics of the transportation output measure in relation to the classical business cycles and the growth cycles of the overall economy. The transportation output cycles are studied using the Phase Average Trend (PAT) and Hodrick-Prescott filter. The strong cyclical movements in the transportation output appear to be more synchronized with the growth slowdowns rather than the full-fledged recessions of the U.S. economy. Based on the cycles generated from PAT, we found that the index has led the NBER-defined growth cycles with an average lead-time of 6 months at peaks and 5 months at troughs with almost no false signals. Admittedly, the lead/lag analysis reported here is retrospective. In future research we would like 19
to develop ex ante filter rules that would enable us, in real time, to distinguish between true cyclical turns and irregular movements of the transportation series. We need further analysis to establish the ex ante predictive value of the Transportation Output Index. While we believe that the Total Transportation Output Index yields a valid measure of output in the industry, we recognize that there are some data problems and that refinements in the indexes may be necessary to improve it in the future. This Transportation Output Index only measures output in the services sector of the industry. The activity involved in the production of transportation equipment is not included, neither is the activity involved in the construction of transportation infrastructure. Within the services sector only for-hire transportation is included.
The activity
involved in intrafirm (in-house) and household transportation (HPTS) has been excluded. To the extent that for-hire and these two transportation activities display different trends, the current Index will not yield a precise picture of economic activity in the industry. Han and Fang (2000) estimated that in-house and for-hire components of total transportation activity constituted nearly 1.97% and 3.16% of total GDP in 1997. Furthermore, Chen et al. (2003) estimated the magnitude of HPTS to be about 1.9 times that of all for-hire transportation industries during 1991- 2000. Inclusion of both in-house and HPTS components would increase the contribution of transportation services to the total GDP from 3.16% to11.0%, if based on TSA 1997 data. In future, it will be useful to incorporate these two components as part of our transportation output index once their monthly data are available. In addition, the 20
index has excluded activity in some of the minor for-hire subsectors like scenic and sightseeing, support activities, postal service, and couriers & messengers of the transportation sector. The waterborne component of the index only includes internal waterway traffic. It does not include deep seas, Great Lakes, coastal trade or cruise travel. Again, if the trends in the excluded items differ from the data that were included, the results would be imprecise. But, monthly data on some of these excluded items are currently being developed at the U.S. Army Corps of Engineers, and can be easily integrated in our analysis, as soon as they are available. The monthly data on national transit ridership data is available only quarterly, and comes with a lag of four months. Other monthly data are available sometimes with a lag of 1-3 months. For the purpose of releasing the output index within the usual lag of 1-2 months, some of the latest monthly data have to be forecasted on a provisional basis using methods discussed in McGuckin, Ozyildirim and Zarnowitz (2001). Fortunately, however, the major components of the series (viz., trucking, air, and rail freight) are available quite promptly, and hence monthly figures for the total transportation sector can be reported soon after a month with confidence. Despite these caveats and suggestions for refining the indexes, the indexes, as presently constructed, will provide sufficiently accurate estimates of the level of economic activity in the transportation sector.
21
ACKNOWLEDGEMENTS We thank the following individuals for numerous insightful discussions and help in identifying relevant data sources: Mazhar Ali Awan, Terry Branson, David Chesser, Clyde Crimmel, Bob Costello, Christie Dawson, Stan Ellis, Robert Finkelstein, Robert Ganz, Bill Gullickson, Frank Hardesty, William Jeffers, Paul Kern, Brian Moyer, Sandia Porter, Paul Posey, Jeff Potter, Brian Sloboda, Miranda Stuart, Thea Thomas, Sharon Trench, and Jay Wieriman. This study has been supported by a grant from the Bureau of Transportation Statistics, U.S. Department of Transportation, and has benefited from the comments from BTS staff during our presentations and many others, including Anirvan Banerji, Bill Bannister, Charlie Han, Rick Kowalewski, Ashish Sen, Jack Wells, and Victor Zarnowitz. However, contents of this paper reflect the views of the authors, and not necessarily those of the Bureau of Transportation Statistics. This paper has benefited from the insightful comments from three anonymous referees and the Editor-in-Chief of the journal.
22
REFERENCES Boschan, C. and W.W. Ebanks, 1978. “The Phase-Average Trend: A New Way of Measuring Economic Growth,” 1978 Proceedings of the Business and Economic Statistics Section. Washington D.C.: American Statistical Association. Bosworth, B., 2001. “Output and Productivity in the Transportation Sector: An Overview,” The Brookings Institution. Bry, G.
and C. Boschan, 1971. “Cyclical Analysis of Time Series: Selected
Procedures and Computer Programs,” NBER Technical Paper 20. Bureau of Economics Analysis, 1984. Handbook of Cyclical Indicators, US Department of Commerce. Chen, D., B. Fang, X. Han and B. Sloboda, 2003. “Household Production of Transportation Services Through Automobiles: An Expansion of the Transportation Satellite Accounts,” Bureau of Transportation Statistics, mimeo. Corrado, C., C. Gilbert and R. Raddock, 1997. “Industrial Production and Capacity Utilization: Historical Revision and Recent Developments,” Federal Reserve Bulletin, February 1997. Fang, F., X. Han, A.M. Lawson, and S.K.S. Lum, 1998. “U.S. Transportation Satellite Accounts for 1992,” Survey of Current Business, April 1998. Fang, B., X. Han, S. Okubo, and A.M. Lawson, 2000. “U.S. Transportation Satellite Accounts for 1996,” Survey of Current Business, May 2000.
23
Ghosh, A.R., and H.C. Wolf, 1997. “Geographical and Sectoral Shocks in the U.S. Business Cycle,” NBER Working Paper #6180, September 1997. Gordon, R.J. 1992. “Productivity in the Transportation Sector,” in Griliches, Z. (Ed.), Output Measurement in the Service Sectors, pp. 371-428. Gullickson, W., and M.J. Harper, 2002. “Bias in Aggregate Productivity Trends Revisited,” Monthly Labor Review, March 2002. Han, X., and B. Fang, 2000. “Four Measures of Transportation’s Economic Importance,” Journal of Transportation and Statistics, April 2000. Hertzberg, M.P. and B.A. Beckman, 1989. “Business Cycle Indicators: Revised Composite Indexes,” Business Conditions Digest (BCD), January. Hodrick, R.J., and E.C. Prescott, 1997. “Postwar U.S. Business Cycles: An Empirical Investigation,” Journal of Money, Credit, and Banking, 29. Lahiri, K., and G.H. Moore, 1991. Eds. Leading Economic Indicators: New approaches and forecasting records, Cambridge University Press, Cambridge. Lahiri, K., and J. Wang, 1994. ”Predicting Cyclical Turning Points with Leading Index in a Markov Switching Model,” Journal of Forecasting, Vol. 13, Page 245263. Landefeld, J.S., and R.P. Parker, 1995. “Preview of the Comprehensive Revision of the National Income and Product Accounts: BEA’s New Featured Measures of Output and Prices,” Survey of Current Business, July 1995.
24
Layton, A., and G.H. Moore, 1989. “Leading Indicators for the Service Sector,” Journal of Business and Economic Statistics. McGuckin, R.H., A. Ozyildirim and V. Zarnowitz, 2001. Composite Index of Leading Economic Indicators: How to Make it More Timely, NBER Working paper #8430. Shiskin, J., A.H.Young and J.C. Musgrave, 1967. The X-11 Variant of the Census Method II Seasonal Adjustment Program, Technical Paper 15, Bureau of the Census, U.S. Department of Commerce. Stekler, H.O., 1991. Forecasting Cyclical Turning Points, in Kajal Lahiri and Geoffrey H. Moore (Ed.), Leading Economic Indicators: New Approached and Forecasting Records, (Cambridge University Press, Cambridge). Yuskavage, R.E., 2001. Issues in the Measurement of Transportation Output: The Perspective of the BEA Industry Accounts, Brookings Workshop, May 2001. Zarnowitz, V., 1992. Business Cycles: Theory, History, Indicators, and Forecasting, The University of Chicago Press, 1992. Zarnowitz V., and A. Ozyildirim, 2002. “Time Series Decomposition and Measurement of Business Cycles, Trends and Growth Cycles,” NBER Working Paper # 8736.
25
Figure 1 Annual Weights for the Aggregation of Transportation
0.450
0.400
0.350
0.300
0.250
0.200
0.150
0.100
0.050
Railroad transportation Water transportation Local and interurban passenger transit Rail Freight Air Passenger
2002
2001
2000
1999
1998
1997
1996
1995
1994
1993
1992
1991
1990
1989
1988
1987
1986
1985
1984
1983
1982
1981
1980
1979
0.000
Transportation by air Trucking and warehousing Rail Passenger Pipelines, except natural gas Air Freight
Data source: “Gross Product by Industry” table published in Survey of Current Business (November 2001)
26
Figure 2 Total Transportation Index: Linked-Laspeyes vs. Fisher-Ideal 123.0
113.0
93.0
83.0
73.0
63.0
Total Transportation Output Index (Fisher-Ideal)
27
-0 0
-0 1 Ja n
-9 9
Total Transportation Output Index (Linked-Laspeyres)
Ja n
-9 7
-9 6
-9 5
-9 4
-9 3
-9 2
-9 1
-9 0
-8 9
-8 8
-8 7
-9 8
Ja n
Ja n
Ja n
Ja n
Ja n
Ja n
Ja n
Ja n
Ja n
Ja n
Ja n
Ja n
-8 5
-8 4
-8 3
-8 2
-8 1
-8 6
Ja n
Ja n
Ja n
Ja n
Ja n
Ja n
Ja n
-8 0
53.0 Ja n
Index: 1996=100
103.0
Figure 3 Three Transportation Output Indexes: Seasonally Adjusted 130 120
Freight Transportation Output Index (Fisher-Ideal)
Total Transportation Output Index (Fisher-Ideal)
110 100 90 80 70 60 50 130 120
80 82 84 86 88 90 92 94 96 98 00 Figure 3a
80 82 84 86 88 90 92 94 96 98 00 Figure 3b
Passenger Transportation Output Index (Fisher-Ideal)
110 100 90 80 70 60 50 80 82 84 86 88 90 92 94 96 98 00 Figure 3c
*Dark shaded areas represent the NBER-defined recessions for the U.S. economy; lightly shaded areas represent the NBER-defined growth cycle recessions for the U.S. economy (the trough for the latest growth slowdown has not been determined).
28
29 Jan-02
Jan-01
Jan-00
Jan-99
Jan-98
Jan-97
Jan-96
60.0
Jan-95
Jan-94
Jan-93
Jan-92
Jan-91
Jan-90
Jan-89
Jan-88
Jan-87
Jan-86
Jan-85
Jan-84
Jan-83
Jan-82
Jan-81
Jan-80
Figure 4
Trends in the Transportation Output Index
120.0
110.0
100.0
90.0
80.0
70.0
Phase Average Trend (PAT)
HP Trend
Original Series
50.0
Figure 5 Growth Cycles in the Transportation Output Index
10 5 0 -5 -10
1985
1990
Deviation from PAT
1995
2000
Smoothed Deviation from PAT
*Shaded areas represent the NBER-defined growth recessions for the U.S. economy (the trough for the latest growth slowdown has not been determined).
30
Figure 6 Comparison of Monthly Transportation Index with Annual BEA, BLS Outputs 120.0
110.0
90.0
80.0
70.0
Transportation Output Index BEA Real Output BLS Real Output
60.0
BLS Experimental Series
31
Jan-01
Jan-00
Jan-99
Jan-98
Jan-97
Jan-96
Jan-95
Jan-94
Jan-93
Jan-92
Jan-91
Jan-90
Jan-89
Jan-88
Jan-87
Jan-86
Jan-85
Jan-84
Jan-83
Jan-82
Jan-81
50.0 Jan-80
Index, 1996=100
100.0
Table 1: Final Weight for Transportation Indexes (linked-Laspeyres)* Subsector of Transportation 1996 TSA (Adjusted) Rail
17.3% Passenger
0.8%
Freight
16.5%
Truck
42.2%
Water
4.7%
Air
24.7% Passenger
21.3%
Freight
3.4%
Pipeline
9.7%
Transit
1.4%
Sum
100%
*
Adapted from Fang et al. (2000).
32
Table 2: Lead and Lag Analysis between Transportation and Economy NBER defined Business Cycle of Transportation Output Index Chronologies of Economy** Recessions Growth Cycle Chronology Lead and Lag of Transportation Vs. Recessions Growth of Economy Cycle of Economy P T P T P T P T P T Jul-80 Jul-80 Jul-80 0 0 Jul-81 Nov-82 Jul-81 Dec-82 Feb-81 Oct-82 -5 -1 -5 -2 Sep-84 Jan-87 Aug-84 Sep-85 -1 -16 Jul-90 Mar-91 Jan-89 Dec-91 Feb-88 Mar-91 -29 0 -11 -9 Jan-95 Jan-96 Dec-94 Jul-95 -1 -6 Mar- Nov-01 Jun-00 Nov-99 Sep-01 -16 -2 -7 01 Mean -17 -1 -5 -7 Median -16 -0.5 -5 -6 Aug84 Sep-85 Extra Turns Dec94 Jul-95 **
Business cycle chronologies are taken from http://www.nber.org/; Growth cycle chronologies are taken from Zarnowitz and Ozyildirim (2002).
33
Table 3: Comparisons of Alternative Measures of Output Growth in the Transportation Sector (Compound Annual Rate)* Output Measures 1980-2000 1980-1991 1992-2000 Trucking BEA Real Output
4.8%
4.8%
3.9%
BLS Experimental Real Output
2.3%
1.3%
2.8%
Monthly Chained Output Index
3.4%
1.7%
4.5%
Railroads BEA Real Output
1.8%
1.5%
1.7%
BLS Experimental Real Output
1.8%
0.8%
2.6%
Monthly Chained Output Index
2.2%
1.0%
3.3%
Airlines BEA Real Output
5.4%
5.7%
4.6%
BLS Experimental Real Output
5.0%
4.9%
4.4%
Monthly Chained Output Index
5.0%
4.9%
4.4%
Total BEA Real Output
4.2%
4.1%
3.9%
BLS Experimental Real Output
2.3%
1.3%
2.8%
Monthly Chained Output Index
3.0%
1.9%
3.7%
*BEA output data is from table “Gross Output by Detailed Industry” published by the Bureau of Economic Analysis, U.S. DOC; BLS Experimental Output series is produced in Gullickson and Harper (2000).
34
APPNDIX 1 DOCUMENTATION ON THE DATA SERIES 1. Air Revenue Passenger Miles (RPM) Name of Series Air Revenue Passenger Miles (RPM) Explanation One revenue passenger transported one mile Source Office of Airline Information (OAI), Bureau of Transportation Statistics (BTS) (http://www.bts.gov/oai) US Department of Transportation, “Air Carrier Traffic Statistical Monthly” (also available in BTS website since 1992:1) Data Format Preliminary Data. Seasonally Adjusted (in thousands). Publication Available at the end of the month for the data 2 months earlier Date Revisions The latest 12 months of data are preliminary. Comments Based on BTS Form 41 by Large Certificated Air Carriers.
70000 60000 50000 40000 30000 20000 10000 80
82
84
86
88
90
92
94
96
Air RPM, X11 Adjusted
35
98
00
02
2 National Transit Ridership Name of Series National Transit Ridership Explanation Estimated Unlinked Passenger Trips Source American Public Transportation Association (APTA), “APTA Quarterly Transit Ridership Report“ (also available in BTS website since 1992:1) Data Format Preliminary data. Seasonally Adjusted (in thousands of Riderships). Publication Date Available in the first day of each quarter for the data 2 quarters earlier Revisions The latest 3 years of data are preliminary. Comments Includes Ridership of Commuter Rail, Heavy Rail, Light Rail, and others.
850000 800000 750000 700000 650000 600000 80
82
84
86
88
90
92
94
96
Transit Ridership, X11 Adjusted
36
98
00
02
3
Rail Revenue Passenger Miles (RPM) Name of Series Rail Revenue Passenger Miles (RPM) Explanation Revenue Passenger Miles carried by Amtrak and Alaska Railroads Source Office of Safety Analysis, Federal Railway Administration (FRA), (http://safetydata.fra.dot.gov/OfficeofSafety/Default.asp) US Department of Transportation “FRA Accident/Incident Bulletin” Data Format Preliminary data. Seasonally Adjusted (in millions of riderships) Publication Date Beginning of each month for data 2 months earlier Revisions The latest 12 months of data are preliminary. Comments Revenue Passenger Miles (RPM) for 1980:1 - 1985:12 had to be estimated from data of Revenue Passengers (RP) because empty trains were counted into RPM before that.
1.6E+09 1.4E+09 1.2E+09 1.0E+09 8.0E+08 6.0E+08 80
82
84
86
88
90
92
94
96
Rail RPM, X11 Adjusted
37
98
00
02
4
Trucking Tonnage Index (TTI) Name of Series Trucking Tonnage Index (TTI) Explanation Truck loads Source American Trucking Association (ATA), “Monthly Trucking Report” Data Format Index number with 1996 = 100, Monthly, Seasonally Adjusted and Unadjusted Publication Date 3rd of each month for the data 2 months earlier Revisions The latest monthly data are preliminary. Comments Estimated from tonnage reported by ATA’s members in 50 states 160 140 120 100 80 60 40 80
82
84
86
88
90
92
94
96
98
Trucking Tonnage Index, X11 Adjusted
38
00
02
5 Railroads Revenue Ton Miles of Freight (RTMF) Name of Series Explanation Source
Railroads Revenue Ton Miles of Freight (RTMF) Carloads of 20 Railroads (total containers and trailers) in USA American Association of Railroads (AAR), “Weekly Railroad Traffic” (also available in BTS website since the 1st week of 1996) Data Format Preliminary data. Quarterly. Seasonally Adjusted (in billions). Publication Date Second month of each quarter for the data 2 quarters ago Revisions The latest 12 months of data are preliminary. Comments Monthly data were not available. We interpolated from the quarterly data. However, we expect to continue on the monthly series soon.
4.0E+08 3.5E+08 3.0E+08 2.5E+08 2.0E+08 1.5E+08 80 82 84 86 88 90 92 94 96 98 00 02 Rail RTMF, Interpolated, X11 Adjusted
39
6 Total Internal Commerce Tonnage Indicator (TICTI) -- All commodities
Name of Series Total Internal Commerce Tonnage Indicator (TICTI) -- All commodities Explanation Internal waterway tonnage of coal, petroleum and chemicals, food and farm products, estimated from 11 key locks on 9 rivers. Source Waterborne Commerce Statistics Center (WCSC), (http://www.iwr.usace.army.mil/ndc/monthlyindicators.htm) US Army Corps of Engineers (also available in BTS website since 1994:1) Data Format Preliminary data. Seasonally Adjusted (in millions of short tons) Publication Date The beginning of each month for the data 2 months earlier Revisions The latest 12 months of data are preliminary. Comments The data does not include great lakes, coastal and deep-sea waterborne traffic, which are currently not available.
60 55 50 45 40 35 80
82
84
86
88
90
92
94
96
98
00
02
Waterborne IWCTI-Internal Waterway Commerce Tonnag, X11 Adjusted
40
7 Air Revenue Ton Miles of Freight and Mails (RTMFM) Name of Series Air Revenue Ton Miles of Freight and Mails (RTMFM) Ton miles of freight and express mails transported by the Air Explanation Industry Office of Airline Information (OAI), Bureau of Transportation Statistics (BTS) (http://www.bts.gov/oai) US Department of Transportation, “Air Carrier Traffic Statistical Monthly” Source (also available in BTS website since 1992:1) Data Format Preliminary data. Seasonally Adjusted (in thousands). Each issue is published at the end of the month for the data 2 Publication Date months earlier. Revisions The latest 12 months of data are preliminary. Comments Based on BTS Form 41 for Large Certificated Air Carriers
000000 500000 000000 500000 000000 500000 80
82
84
86
88
90
92
94
96
Air RTMF, X11 Adjusted
41
98
00
02
8 Index of Energy Movements by Pipeline (IEMP) Name of Series Index of Energy Movements by Pipeline (IEMP) Explanation Movements of crude oil and petroleum products between PADDs, Alaska field production and consumption of natural gas. Source Energy Information Administration (EIA), US Department of Energy, “Petroleum Supply Monthly” (for movements of crude oil and petroleum products); “Monthly Energy Review” (for natural gas and Alaska field production). Data Format Final data. Seasonally Adjusted (in millions of tons). Publication Date 23rd - 26th of each month for the data 2 months earlier. Revisions No revision Comments Before 1985:01, movements of Crude Oil between PADDs are not counted in. In constructing IEMP, physical units that are mbbl/day for crude oil and petroleum products and cubic feet for natural gas, are converted into tons using conversion factors. Here are the physical conversion factors: 1 cubic feet of natural gas = 1020 Btu (heat unit); 1 million of Btu = 0.025 tons of oil equivalent; 1 bbl of petroleum products = 5.326 millions of Btu (heat unit). 950 900 850 800 750 700 650 86
88
90
92
94
96
98
00
02
Pipelines IEMP-Index of Energy Moved by Pipelines, X11 Adjusted
42
APPENDIX 2 Monthly Values of Transportation Indexes Time Total Transportation Freight Transportation Passenger Transportation Index Index Index Jan-80 68.2 70.9 58.9 Feb-80 66.9 69.1 59.4 Mar-80 64.1 65.8 57.7 Apr-80 62.8 65.0 55.0 May-80 62.3 63.7 57.0 Jun-80 60.8 61.2 58.3 Jul-80 60.4 (T) 60.9 57.7 Aug-80 60.7 61.1 58.4 Sep-80 61.5 62.7 57.1 Oct-80 62.8 64.3 57.2 Nov-80 62.6 64.8 54.9 Dec-80 65.5 (P) 68.2 56.5 Jan-81 65.2 67.4 57.5 Feb-81 64.6 67.0 56.3 Mar-81 63.9 66.5 55.2 Apr-81 63.3 64.9 57.2 May-81 61.7 62.5 58.0 Jun-81 62.3 63.2 58.3 Jul-81 63.2 64.7 57.4 Aug-81 61.0 62.2 56.2 Sep-81 62.2 63.5 57.2 Oct-81 61.7 63.0 56.6 Nov-81 60.2 61.3 55.8 Dec-81 60.7 61.2 58.0 Jan-82 58.0 58.1 56.8 Feb-82 58.6 58.7 57.2 Mar-82 59.1 59.0 57.9 Apr-82 58.5 58.3 58.0 May-82 57.5 57.5 56.1 Jun-82 59.0 58.9 58.2 Jul-82 57.2 56.7 57.4 Aug-82 56.7 55.7 58.4 Sep-82 56.9 56.2 57.6 Oct-82 54.8 (T) 53.6 57.1 Nov-82 55.5 54.3 57.5 Dec-82 57.3 56.1 59.6 Jan-83 57.2 55.5 60.6 Feb-83 57.4 55.7 60.9 Mar-83 58.9 57.1 62.9 43
Apr-83 May-83 Jun-83 Jul-83 Aug-83 Sep-83 Oct-83 Nov-83 Dec-83 Jan-84 Feb-84 Mar-84 Apr-84 May-84 Jun-84 Jul-84 Aug-84 Sep-84 Oct-84 Nov-84 Dec-84 Jan-85 Feb-85 Mar-85 Apr-85 May-85 Jun-85 Jul-85 Aug-85 Sep-85 Oct-85 Nov-85 Dec-85 Jan-86 Feb-86 Mar-86 Apr-86 May-86 Jun-86 Jul-86 Aug-86 Sep-86 Oct-86 Nov-86
57.3 58.6 61.1 60.9 61.0 61.2 59.7 61.3 61.8 62.7 64.8 64.7 64.2 65.7 65.8 64.0 66.0 (P) 63.5 64.4 64.3 63.5 64.0 62.3 62.6 64.2 65.0 62.9 63.4 63.7 62.3 (T) 63.5 62.8 65.1 67.0 65.7 65.2 67.0 66.0 65.4 68.9 67.9 68.6 68.7 67.2
56.0 57.7 60.2 60.6 60.2 60.4 58.4 60.6 61.1 62.3 64.6 64.7 63.8 65.4 65.5 63.6 65.4 62.2 63.0 62.8 61.8 62.5 60.4 60.1 61.7 62.7 60.4 60.7 61.0 60.1 61.2 60.6 62.5 64.7 63.2 62.2 64.6 63.6 62.9 66.9 65.1 66.7 66.8 64.8
59.9 60.2 62.5 60.6 62.0 62.4 62.0 62.0 62.7 62.5 64.0 63.7 64.0 65.1 65.3 63.8 66.3 65.9 66.7 66.9 66.6 66.7 66.1 68.2 69.8 70.0 68.4 69.5 69.9 66.8 68.4 67.6 71.0 71.9 71.3 72.0 72.2 71.1 70.8 73.0 74.1 72.7 72.7 72.4
44
Dec-86 Jan-87 Feb-87 Mar-87 Apr-87 May-87 Jun-87 Jul-87 Aug-87 Sep-87 Oct-87 Nov-87 Dec-87 Jan-88 Feb-88 Mar-88 Apr-88 May-88 Jun-88 Jul-88 Aug-88 Sep-88 Oct-88 Nov-88 Dec-88 Jan-89 Feb-89 Mar-89 Apr-89 May-89 Jun-89 Jul-89 Aug-89 Sep-89 Oct-89 Nov-89 Dec-89 Jan-90 Feb-90 Mar-90 Apr-90 May-90 Jun-90 Jul-90
70.1 69.9 70.6 71.3 72.2 69.7 71.5 74.4 71.4 74.2 74.2 74.3 76.7 74.8 78.5 (P) 76.9 76.4 75.8 77.7 75.5 77.0 78.2 75.7 77.9 79.4 77.1 76.4 76.4 75.0 76.4 77.5 73.8 76.8 77.1 76.1 77.6 77.2 77.8 78.8 79.4 77.9 79.2 78.2 78.2
67.4 67.6 68.0 68.5 69.0 66.6 69.2 72.1 68.0 72.7 72.5 72.9 76.0 73.5 77.2 75.7 74.7 74.2 76.5 73.4 74.6 76.7 73.2 76.1 78.9 75.0 74.8 74.4 73.3 74.4 74.8 69.7 73.2 73.8 72.6 74.0 74.4 74.0 75.7 76.6 75.1 77.1 75.1 75.5
76.2 74.6 76.3 77.5 79.4 77.0 76.6 79.2 79.1 77.1 77.5 76.8 77.6 77.2 80.8 79.0 79.6 78.8 79.8 79.8 82.0 80.9 80.6 81.4 79.8 81.2 79.5 80.2 78.4 80.4 83.0 82.2 84.3 83.7 83.4 85.0 82.8 85.6 85.2 84.9 83.6 83.4 84.4 83.8
45
Aug-90 Sep-90 Oct-90 Nov-90 Dec-90 Jan-91 Feb-91 Mar-91 Apr-91 May-91 Jun-91 Jul-91 Aug-91 Sep-91 Oct-91 Nov-91 Dec-91 Jan-92 Feb-92 Mar-92 Apr-92 May-92 Jun-92 Jul-92 Aug-92 Sep-92 Oct-92 Nov-92 Dec-92 Jan-93 Feb-93 Mar-93 Apr-93 May-93 Jun-93 Jul-93 Aug-93 Sep-93 Oct-93 Nov-93 Dec-93 Jan-94 Feb-94 Mar-94
81.3 79.0 80.8 80.4 76.7 78.5 75.9 73.7 (T) 77.3 78.7 75.5 80.8 81.8 82.3 83.9 80.9 80.2 82.6 83.2 82.1 82.4 82.2 83.9 87.9 84.5 86.2 85.7 84.0 85.5 85.3 84.5 85.7 86.8 84.7 86.0 85.9 85.5 89.2 88.7 90.3 89.7 86.7 87.9 93.5
78.8 75.8 77.9 77.6 72.8 75.8 74.8 71.9 74.8 76.3 72.0 79.1 79.8 80.1 82.8 79.5 77.0 81.6 81.8 81.7 82.3 81.3 81.8 86.3 81.3 83.6 84.6 82.6 84.6 84.3 83.7 85.8 86.7 83.5 86.0 85.1 84.4 88.0 87.3 90.0 89.6 85.9 87.7 95.0
86.3 85.5 86.7 86.3 84.7 83.9 78.1 77.4 82.6 83.6 82.8 84.3 85.7 86.6 86.1 83.7 86.5 84.6 86.0 82.9 82.4 84.1 88.4 91.1 91.0 91.5 88.1 87.1 87.6 87.4 86.4 85.7 87.3 87.2 86.0 87.5 87.7 91.6 91.8 91.1 90.0 88.3 88.5 90.8
46
Apr-94 May-94 Jun-94 Jul-94 Aug-94 Sep-94 Oct-94 Nov-94 Dec-94 Jan-95 Feb-95 Mar-95 Apr-95 May-95 Jun-95 Jul-95 Aug-95 Sep-95 Oct-95 Nov-95 Dec-95 Jan-96 Feb-96 Mar-96 Apr-96 May-96 Jun-96 Jul-96 Aug-96 Sep-96 Oct-96 Nov-96 Dec-96 Jan-97 Feb-97 Mar-97 Apr-97 May-97 Jun-97 Jul-97 Aug-97 Sep-97 Oct-97 Nov-97
84.5 91.4 93.4 91.7 93.8 97.0 94.4 99.7 104.6 (P) 101.4 100.6 100.3 94.4 99.1 98.0 94.2 (T) 99.9 99.2 97.1 99.1 95.7 96.9 100.0 99.0 98.6 101.5 97.5 100.0 100.5 99.9 102.9 101.5 101.6 104.5 104.1 103.4 105.0 105.5 103.7 106.4 105.3 109.8 110.6 106.9
81.9 91.8 94.8 91.8 95.3 97.3 93.9 101.5 110.0 105.2 104.7 103.8 95.0 102.1 100.6 94.9 103.6 100.1 97.1 99.3 95.8 97.7 98.8 98.7 98.4 102.5 97.2 100.7 101.5 99.0 102.8 102.2 100.4 104.9 104.2 102.4 105.9 106.5 104.7 108.4 107.2 111.2 112.6 107.3
89.5 90.7 91.0 91.8 90.9 96.4 95.5 96.3 94.5 94.3 92.8 93.7 93.3 93.4 93.1 92.7 93.0 97.6 97.2 98.7 95.4 95.4 102.3 99.6 98.7 99.7 98.2 98.8 98.8 101.6 102.9 100.3 103.6 103.7 104.0 105.2 103.3 103.8 101.8 102.7 101.8 107.2 106.9 106.1
47
Dec-97 Jan-98 Feb-98 Mar-98 Apr-98 May-98 Jun-98 Jul-98 Aug-98 Sep-98 Oct-98 Nov-98 Dec-98 Jan-99 Feb-99 Mar-99 Apr-99 May-99 Jun-99 Jul-99 Aug-99 Sep-99 Oct-99 Nov-99 Dec-99 Jan-00 Feb-00 Mar-00 Apr-00 May-00 Jun-00 Jul-00 Aug-00 Sep-00 Oct-00 Nov-00 Dec-00 Jan-01 Feb-01 Mar-01 Apr-01 May-01 Jun-01 Jul-01
110.9 110.3 110.5 112.0 112.7 111.9 113.1 113.2 110.3 112.6 114.0 113.2 114.3 112.4 114.4 119.4 116.3 115.1 116.8 116.1 116.7 119.1 118.3 121.8 (P) 120.0 117.6 121.4 119.4 112.6 120.0 117.8 114.1 118.9 115.6 116.8 118.7 112.3 118.8 114.5 118.2 115.5 120.9 115.5 116.6
113.1 112.9 112.7 115.4 114.9 114.1 117.6 118.1 114.4 115.6 115.6 114.4 117.0 114.2 116.7 123.5 118.0 117.2 120.3 118.5 121.7 121.5 118.5 122.9 124.4 121.2 123.0 120.0 108.3 119.3 116.7 112.2 122.1 112.9 114.4 115.4 109.3 119.0 111.9 117.0 111.7 121.1 113.3 115.2
106.9 105.6 106.7 105.8 108.8 108.1 105.1 104.5 103.1 107.1 111.1 111.1 109.4 109.2 110.5 112.2 113.4 111.3 110.7 112.0 107.8 114.9 118.0 119.8 112.3 111.3 118.7 118.5 120.2 121.5 119.8 117.6 113.3 120.3 121.1 124.7 117.7 118.6 119.3 120.4 122.5 120.6 119.5 119.3
48
Aug-01 Sep-01 Oct-01 Nov-01 Dec-01 Jan-02 Feb-02 Mar-02 Apr-02
120.2 101.6 (T) 108.8 110.1 108.6 114.7 110.7 112.5 116.3
122.5 108.4 115.5 113.1 110.4 119.5 111.5 112.9 120.0
116.4 90.0 97.2 104.9 105.6 106.3 109.6 112.0 109.9
49