Hampshire, Durham, NH 03824, USA; 2USDA Forest Service, Northern Research ... a regional problem at any moose density in northern New Hampshire.
ALCES VOL. 47, 2010
BERGERON ET AL. - MOOSE DENSITY AND FOREST REGENERATION
MOOSE BROWSING AND FOREST REGENERATION: A CASE STUDY IN NORTHERN NEW HAMPSHIRE Daniel H. Bergeron1, Peter J. Pekins1, Henry F. Jones1, and William B. Leak2 Wildlife Program, Department of Natural Resources and the Environment, University of New Hampshire, Durham, NH 03824, USA; 2USDA Forest Service, Northern Research Station, PO Box 640, Durham, NH 03824, USA. 1
ABSTRACT: The impact of moose (Alces alces) browsing on the regeneration of commercial hardwood and softwood tree species was evaluated in 3 regions with different moose population densities (0.26-0.83 moose/km²) in northern New Hampshire. Regeneration surveys were conducted in 4 age classes of clear-cuts (0-5, 6-10, 11-15, and 16-20 years) in June-August 2009. Stocking rate, tree height, and damage of dominant commercial stems were measured to assess regeneration and browse damage among age classes and regions. We assumed that a stocking rate of 40-60% (stems/plot) dominant commercial tree species without severe damage was an acceptable threshold of browse damage to achieve a fully stocked stand at 80 years. Mean stocking rate of all age classes was above the threshold in all regions (47-85%); the lowest stocking rates (47-52%) occurred in the 0-5 year age class but increased thereafter in all regions. The CT Lakes region (highest moose density) had more damage than both the North and White Mountain regions in the 11-15 year age class (F = 3.05; df; 6; P = 0.0002 and 0.0058, respectively). Tree heights were lower in the CT Lakes region (F = 2.30; df; 6; P = 0.04). Most damage was restricted to a few isolated clear-cuts at higher elevation near moose wintering areas that were possibly shifting to conifer dominance. Regeneration of commercial tree species was not considered a regional problem at any moose density in northern New Hampshire.
ALCES VOL. 47: 39-51 (2011) Key words: Alces alces, browsing, clear-cut, damage, moose, population density, regeneration, stocking, threshold.
Moose (Alces alces) are economically and ecologically important in northern New Hampshire with moose viewing a popular attraction and >500 hunting permits issued statewide in 2009 (2009 New Hampshire Wildlife Harvest Summary). Wildlife-associated recreation contributed ~$560 million to New Hampshire’s economy in 2006 (USFWS 2006), and moose related activities represent a substantial portion of this figure with ~$375,000 from 2010 permit and license sales alone (K. Rines, New Hampshire Fish and Game [NHFG], personal communication). However, moose browsing can negatively impact the forest industry which is arguably the primary contributor to northern New Hampshire’s economy. According to the Governor’s New Hampshire Forest Products Industry Task Force Report
(2008), the state generates over $2.3 billion annually from forest-based manufacturing and forest-related recreation and tourism. Adult moose require substantial browse to maintain their characteristically large body size (2.8 kg/moose/day in January in NH; Pruss and Pekins 1992), thus have potential to impact plant communities considerably (Peek 1997, Bowyer et al. 1998), particularly in commercially managed forests that create preferred habitat and forage that attract moose (Westworth et al. 1989, Scarpitti et al. 2005). For example, moose on Isle Royale, Michigan prevented aspen (Populus spp.), birch (Betula spp.) and balsam fir (Abies balsamea) from reaching the overstory, whereas spruce (Picea spp.) was little affected (McInnes et al. 1992); sites with previously low moose density and 39
MOOSE DENSITY AND FOREST REGENERATION - BERGERON ET AL.
ALCES VOL. 47, 2011
older sites with unreachable foliage escaped damage. Density of 0.3-0.5 moose/km² in Russia retarded growth of preferred forage species such as aspen, causing rapid over-growth by spruce; normal stand development occurred at 0.2-0.3 moose/km² (Abaturov and Smirnov 2002). Moose browsing reduced height of preferred species and released conifers from competition in Finland (Heikkila et al. 2003), winter density of 4.6 moose/km² retarded growth and regeneration of birch in Newfoundland (Bergerud and Manuel 1968), and moose (1.97/km²) reduced browse availability in deer (Odocoileus virginianus) wintering areas in northern New Hampshire (Pruss and Pekins 1992). Despite the year-round importance of early-successional browse to moose, and the importance of sustaining commercial forests in northern New Hampshire, little attention has been paid to the impact of moose browsing on forest regeneration (Scarpitti 2006). In the late 2000s the Connecticut Lakes Timber Company raised concern about the negative impact of moose browsing on regeneration of commercial tree species and its associated impacts on the economic viability of timber resources on their property. Because of the importance of both moose and the timber industry in northern New Hampshire, it is important to balance recreational opportunity with economically viable forests. This research was designed to evaluate the impact of moose browsing on regeneration of commercial tree species in 3 regions of different moose density in northern New Hampshire. Our objectives were to 1) measure the stocking rate of commercial tree species in 4 age classes of clear-cuts, 2) measure the relative quality (damage) of dominant commercial stems in these cuts, and 3) determine if a relationship exists between regional moose density and % damage of commercial tree species.
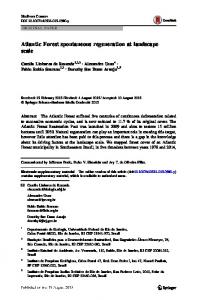
New Hampshire and was separated into 3 regions (Fig. 1) based on moose population density (NHFG 2009). The 3 regions from highest to lowest density were CT Lakes (0.83 moose/ km²), North (0.61 moose/km²), and White Mountain (0.26 moose/km²), respectively (K. Rines, personal communication). Elevation in the study area ranges from ~120-1900 m, average monthly snow depth ranges from 0-60 cm, and average monthly temperature ranges from -13-19° C (NOAA 2006). The CT Lakes and North regions were dominated by commercial hardwood species including sugar (Acer saccharum) and red maple (A. rubrum), yellow birch (Betula alleghaniensis), and American beech (Fagus grandifolia). Red spruce (Picea rubens) and balsam fir tend to be the dominant species at higher elevations (>760 m) and in cold, wet lowland sites (Degraaf et al. 1992). These regions are predominately forested and the majority of the land is privately owned and commercially harvested using various silvicultural techniques (Degraaf et al. 1992);
METHODS
Fig. 1. The location of the 3 study regions in northern New Hampshire used to compare effects of moose browsing on forest regeneration relative to moose density.
CT Lakes
(0.83 moose/km²)
North
(0.61 moose/km²)
White Mountain (0.26 moose/km²)
Vermont
Maine
New Hampshire
Massachusetts
Study Area The study area was located in northern 40
Q
ALCES VOL. 47, 2010
BERGERON ET AL. - MOOSE DENSITY AND FOREST REGENERATION
they contain ~10% wetlands and open water, and are interspersed with trails and logging roads. The CT Lakes region is hilly with few high mountains, while the North is characterized by high mountainous terrain. The White Mountain region contains the White Mountain National Forest which covers 304,050 hectares and is >95% forested. It had the highest elevations and was dominated by beech, sugar maple, and yellow birch; other common species include white ash (Fraxinus americana), red maple, red spruce, and eastern hemlock (Tsuga canadensis). Timber harvest in this region is done on a smaller scale than the other regions, with maximum clear-cut size of ~10-12 ha (USFS 2005). White-tailed deer are sympatric with moose throughout the study area.
20.1 m
20.1 m
2.3 m
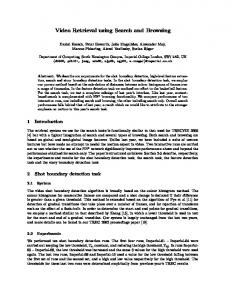
Fig. 2. Example layout of milacre sample plots evenly spaced on equidistant transects in clearcut study sites.
commercial; commercial species included oak (Quercus spp.), sugar and red maple, yellow and white birch (B. papyrifera), American beech, aspen, ash, balsam fir, red spruce, and white pine (Pinus strobus). Stem damage was assessed qualitatively as fork, broom, or crook on dominant commercial and non-commercial stems (Fig. 3). Height of damage, number of forks and crooks, and severity of crook (based on angle) were also recorded.
Field Measurements Regeneration surveys (Leak 2007) were performed in clear-cuts ≥2.83 ha in June-August 2009 in all regions. Cuts were separated into 4 age classes (0-5, 6-10, 11-15, and 16-20 years old) in each region to measure temporal change across 20 years of growth. This time frame encompassed the age of trees, and 10 years beyond, that moose are most likely to impact architecture and growth through browsing. We surveyed 7-10 stands of each age class spread throughout each of the 3 sample regions. Sample sites were groundtruthed using GPS locations (when available) and cartographic features such as wetlands, streams, and roads. Small-plot surveys using milacre plots (~ 2.3 m diameter) were used to assess tree density (stems/plot). To avoid repeat measurements, plots were evenly spaced on equidistant transects throughout each clear-cut (Fig. 2). Approximately 75-250 small-plot surveys were conducted in each clear-cut providing approximately 700-1,000 plots/age class per region. In each plot the dominant stem (tallest tree) was recorded as commercial or non-
Data Analysis Browse defects that classified a tree as severely damaged included broomed stems and multiple forks above breast height (~1.4 m). Damage considered not severe enough to affect tree quality included single forks and crooks. Studies indicate trees with such damage usually recover during subsequent growth and are harvested in normal rotation time (Switzenberg et al. 1955, Carvell 1967, Trimble 1968, Jacobs 1969). The milacre plot size equals the area required by the dominant stem when the stand reaches 10.16-15.24 cm (4-6 in) (mean stand diameter/average basal area) in northern hardwood and mixed wood stocking guides (Leak et al. 1987, Fig. 4). Based on these stocking guides, a minimum of 40-60% of sample plots in each age class should contain a dominant commercial stem without severe damage to achieve a fully 41
MOOSE DENSITY AND FOREST REGENERATION - BERGERON ET AL.
Crook
ALCES VOL. 47, 2011
Fork
Broom
Fig. 3. Illustration of the 3 qualitative browse categories used to describe browsing damage of dominant commercial stems (photos by D. Bergeron).
stocked stand at 80 years (Leak et al. 1987, Fig. 4). The relative height of the dominant stem was estimated in the 3 older age classes to further assess browsing impact. The proportion of plots containing a dominant commercial
stem ≥3.0 m without severe damage was used to compare relative height between age classes. Vegetation ≥3.0 m was presumed to be above the height of typical moose browsing (Bergstrom and Danell 1986). Analysis of variance (ANOVA) was used 0-5 yrs =
Fully Stocked
6-10 yrs = 11-15 yrs = 16-20 yrs =
~60% ~40%
Fig. 4. Stocking guide for main crown canopy of even-aged hardwood stands. The A-line is fully stocked, the B-line is suggested residual stocking (~60%), and the C-line is minimum stocking (~40%) (Leak et al. 1987). The proportion (%) of commercial trees without severe damage are plotted by age class. 42
ALCES VOL. 47, 2010
BERGERON ET AL. - MOOSE DENSITY AND FOREST REGENERATION
to examine for differences in mean stocking rate of commercial trees, browse damage, and height of vegetation. A Shapiro-Wilk test was used to test if the data were normally distributed and a Bartletts’ test was used to check for homogeneity of variance (Zar 1999). Pairwise comparisons were made with Tukey’s test. Linear regression was used to test for relationships between browse damage and moose density. Analyses were performed with Systat v. 13. Significance for all tests was assigned a priori at α = 0.05.
trees with severe damage was low (70% by the 6-10 year age class (Table 1). Relative height of trees increased with age class and was negatively correlated with moose density. Bergerud and Manuel (1968) noted that if browsing pressure is removed, “hedged” stems may escape and recover for harvest within a normal rotation time. One leader becomes apically dominant in forked stems (Jacobs 1969), and crooked stems straighten with added radial growth (Switzenberg et al. 1967, Trimble 1968). The increased height in regions with lower moose density is suggestive of a relationship between damage and moose density. However, because stocking rate was above the threshold level in all regions, and
DISCUSSION Moose browsing has not substantially impacted regeneration of commercial tree species in northern New Hampshire on a regional
Table 2. Summary of stocking rates and browsing damage by moose in 3 severely damaged clear-cuts identified in this study in northern New Hampshire. Sample region and Stocking rate of Proportion of Proportion of Stocking rate of Stocking rate of age class dominant com- commercial trees dominant com- dominant com- dominant commercial trees (%) w/ severe damage mercial trees w/o mercial hard- mercial softwoods (%) severe damage woods (%) (%) and ≥3.0 m tall (%) CT Lakes 11-15
69
63
16
72 (98)*
28 (2)
11-15
75
52
22
75 (100)
25 (0)
Average
78
22
43
NA
NA
6-10
69
52
16
99 (97)
1 (3)
Average
73
10
48
NA
NA
White Mountain
NA = not applicable *Numbers in parenthesis indicate severe browse damage (%). 44
ALCES VOL. 47, 2010
BERGERON ET AL. - MOOSE DENSITY AND FOREST REGENERATION
Table 3. Browse damage of dominant stems in different aged clear-cuts in the CT Lakes sample region in northern New Hampshire. Row totals do not always add up due to rounding of numbers. Age class
Species
Severe damage Moderate damage Light damage (%) (%) (%)
No damage (%)
Total (%)
6-10 American beech
0
0
0
0
1
Aspen spp.
1
1
3
1
5
Balsam fir
0
1
4
16
22
Red maple
1
2
3
1
6
Red spruce
0
0
0
4
5
Sugar maple
2
3
8
2
15
White birch
3
1
4
2
9
Yellow Birch
1
1
5
4
11
Non commercial
NA
NA
NA
NA
27
American beech
0
0
1
1
2
Aspen spp.
0
0
0
0
1
Balsam fir
0
0
2
15
17
Red maple
5
5
5
2
17
Red spruce
0
0
0
4
4
Sugar maple
0
2
2
1
6
White birch
8
1
5
4
18
Yellow Birch
4
2
5
3
14
Non commercial
NA
NA
NA
NA
21
American beech
0
0
0
1
1
Aspen spp.
0
0
1
0
1
Balsam fir
1
1
1
23
26
Red maple
1
2
7
3
12
Red spruce
0
0
0
11
12
Sugar maple
1
2
4
2
10
White birch
4
2
6
3
15
Yellow Birch
2
1
4
1
8
NA
NA
NA
NA
14
11-15
16-20
Non commercial
severe damage levels >10% occurred in only 1 age class in the CT Lakes, this relationship has negligible impact on regional forest productivity. Several studies have examined the impacts of moose density on tree species. In central Newfoundland winter densities of >4.6 moose/km² caused severe damage to balsam fir and white birch (Bergerud and
Manuel 1968); lower density of 2.32 moose/ km² reduced serious damage of these species (Bergerud et al. 1968). Angelstam et al. (2000) examined the effects of moose density across 3 geographic regions (Sweden, Finland, and Russian Karelia) with density ranging from 0.2-1.7 moose/km², and found the proportion of severely damaged and dead stems increased 36-fold in the highest density region; regions 45
MOOSE DENSITY AND FOREST REGENERATION - BERGERON ET AL.
with densities of ≤0.3-0.4 moose/km² had less damage. In Sweden, clipping studies showed that densities of 0.8-1.5 moose/km² do not impact winter browse availability, but densities of ≥2.0 moose/km² will (Persson et al.
ALCES VOL. 47, 2011
2005). Faison et al. (2010) measured browse damage in southern New England at densities of 0.5-1.1 moose/km² and found only 3% of study sites were browsed intensively. Moose density in our study area in the previous 20
Table 4. Browse damage of dominant stems in different aged clear-cuts in the North sample region in northern New Hampshire. Row totals do not always add up due to rounding of numbers. Age Species class
Severe damage Moderate damage Light damage (%) (%) (%)
No damage (%)
Total (%)
6-10 American beech
0
1
4
3
7
Aspen spp.
0
1
8
1
10
Ash spp.
0
1
2
3
5
Balsam fir
0
0
1
4
5
Red maple
2
3
6
2
13
Red spruce
0
0
0
0
1
Sugar maple
1
2
7
1
11
White birch
0
0
2
1
4
Yellow birch
0
2
7
4
14
Non commercial
NA
NA
NA
NA
30
American beech
0
0
0
0
0
Aspen spp.
0
0
5
4
9
Ash spp.
0
0
0
0
1
Balsam fir
0
0
2
34
36
Red maple
0
2
7
2
11
Red spruce
0
0
0
5
5
Sugar maple
0
1
3
0
4
White birch
0
1
7
3
11
White pine
0
0
0
0
0
11-15
Yellow birch
0
0
4
3
8
Non commercial
NA
NA
NA
NA
14
American beech
0
1
2
2
4
Aspen spp.
0
0
4
2
6
Ash spp.
0
0
0
0
0
Balsam fir
0
1
3
33
36
Red maple
1
2
9
1
13
Red spruce
0
0
1
9
10
Sugar maple
0
1
4
1
7
White birch
0
1
5
1
8
16-20
Yellow birch Non commercial
0
1
2
1
4
NA
NA
NA
NA
12
46
ALCES VOL. 47, 2010
BERGERON ET AL. - MOOSE DENSITY AND FOREST REGENERATION
Table 5. Browse damage of dominant stems in different aged clear-cuts in the White Mountain sample region in northern New Hampshire. Row totals do not always add up due to rounding of numbers. Age Species class
Severe damage (%)
Moderate damage (%)
Light damage (%)
No damage (%)
Total (%)
American beech
3
6
20
7
37
Aspen spp.
0
0
2
1
3
Ash spp.
0
1
4
3
8
Balsam fir
0
0
0
0
0
Oak spp.
0
0
0
0
1
Red maple
0
1
4
1
5
Red spruce
0
0
0
1
1
Sugar maple
0
0
1
0
1
White birch
0
2
7
3
12
White pine
0
0
0
1
1
Yellow birch
2
1
4
2
8
Non commercial
NA
NA
NA
NA
23
American beech
1
4
18
5
29
Aspen spp.
0
0
2
1
3
Ash spp.
1
1
6
2
9
Balsam fir
0
0
1
2
3
Red maple
1
1
7
1
11
Red spruce
0
0
0
2
2
Sugar maple
0
0
2
0
3
White birch
0
0
7
3
10
Yellow birch
1
1
5
2
10
Non commercial
NA
NA
NA
NA
19
American beech
0
2
12
4
18
Aspen spp.
0
0
7
3
10
Ash spp.
0
0
3
1
4
Balsam fir
0
0
0
1
1
Oak spp.
0
0
1
0
1
Red maple
0
1
8
1
10
Red spruce
0
0
0
1
1
Sugar maple
0
0
2
0
3
White birch
0
1
13
7
20
White pine
0
0
0
0
0
6-10
11-15
16-20
Yellow birch Non commercial
0
1
9
5
16
NA
NA
NA
NA
15
47
MOOSE DENSITY AND FOREST REGENERATION - BERGERON ET AL.
years was nearly double (~1.5-2.0 moose/ km²) that of current moose density (