Morphing Polylines: A Step Towards Continuous Generalization ⋆ Martin N¨ollenburg a,∗ , Damian Merrick b , Alexander Wolff c , Marc Benkert a a Faculty b School
of Informatics, Karlsruhe University, P.O. Box 6980, 76128 Karlsruhe, Germany.
of Information Technologies, University of Sydney, NSW 2006, Australia, and National ICT Australia, Alexandria, NSW 1435, Australia.
c Faculteit
Wiskunde en Informatica, Technische Universiteit Eindhoven, P.O. Box 513, 5600 MB Eindhoven, The Netherlands.
Abstract We study the problem of morphing between two polylines that represent linear geographical features like roads or rivers generalized at two different scales. This problem occurs frequently during continuous zooming in interactive maps. Situations in which generalization operators like typification and simplification replace, for example, a series of consecutive bends by fewer bends are not always handled well by traditional morphing algorithms. We attempt to cope with such cases by modeling the problem as an optimal correspondence problem between characteristic parts of each polyline. A dynamic programming algorithm is presented that solves the matching problem in O(nm) time, where n and m are the respective numbers of characteristic parts of the two polylines. In a case study we demonstrate that the algorithm yields good results when being applied to data from mountain roads, a river and a region boundary at various scales. Key words: continuous generalization, morphing, dynamic programming, line simplification
⋆ This work was supported by grant WO 758/4-2 of the German Research Foundation (DFG). National ICT Australia is funded through the Australian Government’s Backing Australia’s Ability initiative, in part through the Australian Research Council. ∗ Corresponding author. Tel. +49 (721) 608-7331; Fax +49 (721) 608-4211 Email addresses:
[email protected] (Martin N¨ollenburg),
[email protected] (Damian Merrick). URLs: win.tue.nl/~awolff (Alexander Wolff),
Preprint submitted to Elsevier
29 July 2008
1
Introduction
Visualization of geographic information in the form of maps has been established for centuries. Depending on the scale of the map the level of detail of displayed objects must be adapted in a generalization process. Be it done manually or (semi-)automatically, generalization methods usually produce a map at a single target scale. This is a well-studied field, surveyed, for example, by Weibel and Dutton (1999). In current, often web-based (Jones and Ware, 2005), geographic information systems users can interactively zoom in and out of the map, ideally at arbitrary scales and with smooth, continuous changes. However, current approaches are often characterized by a fixed set of scales or by simply zooming graphically without modifying map objects. In the first case the available scales do not necessarily match the user’s desired scale. Moreover, stepping instead of zooming is susceptible to causing loss of context so that the user has to re-orientate. However, if zooming is done purely graphically the quality of the map at the desired scale often does not match the expected quality since the level of detail is not adapted to the specific scale. To overcome these deficiencies continuous generalization methods are needed that aim to generate maps that continuously adapt the degree of generalization to the scale. This paper studies the problem of continuously generalizing linear features like rivers, roads, or region boundaries between their representations at two scales. Instead of line-simplification methods with a single target scale, we consider interpolating between a source and a target scale in a way that keeps the maps at intermediate scales meaningful. In computer graphics and computational geometry this interpolation process is known as morphing (Gomes et al., 1999). Of specific interest in our context are morphing algorithms that can deal with the effects of generalization operators like exaggeration and typification such as reducing the number but increasing the size of road serpentines at the smaller scale. Our approach is designed to handle these effects. It consists of two steps. In the optional first step our method partitions the input polylines into characteristic segments with roughly uniform curvature (see Section 3.1). This yields a segmentation of the polylines into straight parts and the various bends. Then, based on an appropriate distance function for polylines, we compute an optimum correspondence of the polyline segments at the two input scales in O(nm) time using dynamic programming, where n and m are the respective numbers of characteristic segments (see Sections 3.2 and 3.3). Unlike general morphing algorithms this correspondence tries to match semantically identical segments of the two polylines. Simple straight-line trajectories are used to define the i11www.iti.uni-karlsruhe.de/group (Marc Benkert).
2
movement between corresponding points. We have implemented a prototype of the algorithm and demonstrate its applicability in a case study for road network data, the course of a river, and a region boundary (see Section 4).
2
Related work
Cecconi and Galanda (2002) study adaptive zooming for web applications with a focus on the technical implementation. They use the standard DouglasPeucker line-simplification method (Douglas and Peucker, 1973) to generalize linear features. While maps can be produced at arbitrary scales there is no smooth animation of the zooming. A set of continuous generalization operators is presented by van Kreveld (2001), including two simple algorithms for morphing a polyline to a straight-line segment. Continuous generalization for building ground plans and typification of buildings is described by Sester and Brenner (2004). Existing algorithms for the geometric problem of finding an optimal intersectionfree geodesic morphing between two simple, non-intersecting polylines (Efrat et al., 2001; Bespamyatnikh, 2002) cannot be applied here because in our setting the pairs of polylines that we want to transform into each other generally do intersect. Surazhsky and Gotsman (2001a,b) compute trajectories for intersection-free morphings of plane polygonal networks using compatible triangulations. Similarly, Erten et al. (2004) give an algorithm for intersectionfree morphing of plane networks using a combination of rigid motion and compatible triangulations. However, these approaches require a given correspondence between network nodes. In the field of computer graphics, Cohen et al. (1997) match point pairs of two (or more) parametric freeform curves. They compute an optimal correspondence of the points with respect to a similarity measure based on the tangents of the curves. The algorithm is similar to ours in that it also uses dynamic programming to optimize the matching, but it deals with uniformly sampled points rather than with context-dependent characteristic segments of polylines. Samoilov and Elber (1998) extend the method of Cohen et al. (1997) by eliminating possible self-intersections during the morphing.
3
Model and algorithm
In this paper, we consider the problem of morphing between two polylines, each generalized at a different scale. An algorithmic solution for a pair of polylines can be used to compute a morph between two networks of polylines with identical topology by applying the polyline algorithm for each pair of polylines 3
in the network independently. Note, however, that our algorithm does not take intersections between different polylines into account. Polygonal region boundaries can be handled, too, by cutting the closed curves at a common point, which then serves as first and last point of the corresponding polylines. The algorithm can be further extended in a straightforward manner to finding a series of morphs across many scales by solving each pair of networks at neighboring scales independently. The problem of morphing between two polylines is two-fold. Firstly, a correspondence must be found between points on the two lines. Secondly, trajectories that connect pairs of corresponding points must be specified. Here our focus is on the correspondence problem. Once we have solved this, we will simply use straight-line trajectories. In addressing the correspondence problem, our goal is to match parts of each polyline that have the same semantics, for instance, represent the same series of hairpin bends in a road at two levels of detail. We wish to do this in a way that allows the mental map to be retained as much as possible. The mental map is the mental image a person builds of a diagram. Retention of the mental map is believed to be important in continuous understanding of animated diagrams; see for example Misue et al. (1995). To retain the mental map, it can be useful to ensure that visual elements change as little as possible during an animation. We therefore wish to minimize the movement of points from one polyline to another. To create a morph with these desired properties, we compute a correspondence between parts of the polylines that is optimum with respect to a distance function defined between polyline segments. This distance function aims to measure the required point movement. Naively, the segments may simply be the individual line segments of the polylines. However, we can improve the running time of our algorithm by detecting appropriate larger characteristic segments consisting of multiple line segments as described in Section 3.1. Whatever segments we use, the algorithm described in Section 3.2 computes an optimum correspondence for them. Formally, we are given two (directed) polylines f and g in the plane R2 . In the correspondence problem we need to find two continuous, monotone parameterizations α : [0, 1] → f and β : [0, 1] → g, such that α(0) and β(0) map to the first points of f and g and α(1) and β(1) map to the last points, respectively. These two parameterizations induce the correspondence between f and g: for each u ∈ [0, 1] the point α(u) is matched with β(u). The trajectory problem asks for a family of trajectories σ(t, u) : [0, 1]2 → R2 along which α(u) moves to β(u), where t is a time point in the interval [0, 1]. In this paper we simply use straight-line trajectories, thus connecting α(u) and β(u) by shortest possible connections, that is, σ(t, u) = (1 − t)α(u) + tβ(u). One issue with this formulation is that intersections between different parts 4
of a polyline may occur during the morph. We give a heuristic method in Section 3.3.4 that may be implemented to avoid some typical cases of selfintersections, namely if a pair of corresponding segments would intersect; intersections may still occur in some cases between two different parts of the same polyline or between different polylines in a network. The method of Surazhsky and Gotsman (2001b), who give a solution to the trajectory problem, provides a workaround to this issue by computing more complex but therefore intersection-free trajectories given our solution to the correspondence problem. Since self-intersections were not an issue in the examples of our case study we refrained from including their method in our prototype implementation.
3.1 Detection of characteristic points
Before solving the correspondence problem, we need to divide each polyline into subpolylines to be matched up. We do this by locating points on each line that are considered to be characteristic of the line; each of these characteristic points then defines the end of one subpolyline and the start of another. The simplest approach to locating such points is to assume that every point defining a polyline is characteristic of the line. In this case, we solve the correspondence problem on the set of line segments of the polyline and proceed directly with the algorithm in Section 3.2. This method can produce good results as we show in the case study in Section 4. Often, however, a lot of points are needed to accurately depict a cartographic feature such as a river or a road, and using all of these points as characteristic points can lead to high running times. To avoid this, we present a method that selects a small subset of characteristic points that still suffice to produce good results in significantly less time. Previous work on generalization notes the importance of inflection points, bend points, and start- and endpoints in defining the character of a line (Plazanet et al., 1995). We have performed initial experiments with detecting such points automatically (Merrick et al., 2007), but found that the user had to manually calibrate many parameters in order to obtain reasonable results for a particular polyline. Furthermore, a set of parameters that produced a good solution for one line did not necessarily lead to a good solution for another. Instead, we detail here an approach that needs only a small set of parameters, and is more robust to changes in the input data. Sezgin (2001, Chapter 5) introduces a method for locating feature points of curves in the recognition of hand-drawn sketches. Sezgin tries to model a given polyline with a B´ezier curve, and calculates the distance between the B´ezier curve and the actual polyline. If this distance is above a certain threshold, the polyline is divided 5
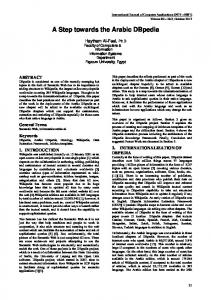
c1 c2 tˆ1 tˆ2 pi pj
Fig. 1. A B´ezier curve with control points hpi , c1 , c2 , pj i approximating a polyline between points pi and pj .
in half and two new B´ezier curves are created. This continues until a set of B´ezier curves has been generated each of which fits the polyline within the given distance threshold. This process is similar to the classic Douglas-Peucker line simplification method (Douglas and Peucker, 1973), but fitting B´ezier curves instead of straight lines. The points at which the B´ezier curves start and end then become the characteristic points of the polyline. This approach tends to produce a set of points that is quite evenly spaced, since the point at which each polyline is divided is arbitrarily chosen as its midpoint. Our approach also fits B´ezier curves to sections of the polyline, but proceeds from the start of the polyline, greedily fitting as many points as possible and starting a new B´ezier curve when no more points can be fitted. Given two points pi and pj in a polyline f = hp1 , p2 , . . . pn i, we use the same B´ezier curve construction as Sezgin (2001): the points pi and pj become the first and last control points of the curve, and two intermediate control points are defined as c1 = pi +k tˆ1 and c2 = pj +k tˆ2 , where k is one third of the length of the polyline hpi , pi+1 , . . . , pj i, tˆ1 is the unit vector in the direction from pi to pi+1 , and tˆ2 is the unit vector in the direction from pj to pj−1 (see Figure 1). Note that the scaling factor k is an empirically determined value that has been reported as working surprisingly well for approximating digitized curves by cubic B´ezier curves (Schneider, 1988; Sezgin, 2001). The algorithm starts by fitting a B´ezier curve to points hp1 , p2 , p3 i, then adds one point from f at a time until the distance between the curve and the polyline is greater than a given error threshold ε > 0. We use the following simple method to calculate the distance between the curve and the polyline. First, we resample both the polyline and the B´ezier curve using the same number x of points. That is, we place x points spaced evenly along the polyline, from one end to the other, and do the same with the B´ezier curve. Now we find the maximum distance between any of these x points on the polyline and its corresponding point on the resampled curve. The number x can be set arbitrarily, but should be greater than the original number of points in the given subpolyline. In our implementation (see Section 4), we set x to 300 if an entire polyline is considered, or in the case of a subpolyline, decrease the number proportionally according to the subpolyline’s length. It is possible to 6
use more sophisticated error measures here, such as the Fr´echet metric (see Section 3.3), but we found that this simple measure worked well in practice. Once the distance error becomes larger than ε, we mark the last considered point pj as characteristic point, and create a new B´ezier curve for hpj , pj+1 , pj+2 i. After we have considered all points in f , we mark the last point pn as characteristic, and we are done. The output of our algorithm is the set of characteristic points, which separate the different B´ezier curves. Since we use cubic B´ezier curves, which are defined by four control points, any interval between two characteristic points should represent at most a single left or right turn or a straight segment of the polyline. More complex shapes cannot be approximated well by a cubic B´ezier curve. Since the B´ezier curve construction depends on the directions of edges in the original polyline, a higher number of characteristic points may be generated in noisy or poorly sampled sections of a polyline. To minimize this, a Gaussian smoothing filter can be applied as a pre-processing step; see Lowe (1989) for further details on Gaussian filtering and an efficient algorithm. We first resample the polyline using a given number n′ of evenly spaced points. We then apply a Gaussian filter with kernel width σ to the resampled line; this essentially moves each point in the line to a weighted average of its neighbors’ positions (σ determines the size of the neighborhood that is used). Applying the Gaussian filter can decrease small variations in direction along the polyline so that each B´ezier curve constructed is likely to fit more closely along simple curved sections of the line. This can result in fewer extraneous characteristic points, but can also increase the running time significantly. In Section 4, we present results from the B´ezier characteristic point detection both with and without the Gaussian filter.
3.2 Finding an optimum correspondence The previous section described a method for determining a set of characteristic points of a polyline. By subdividing the polyline at the characteristic points we obtain a set of subpolylines (or simply segments) that are intended to represent contiguous and homogeneous stretches of the polyline like straight sections or bends with constant curvature. In this section we assume that the subdivisions of two input polylines f and g into segments are given, for example, as the result of applying the previous characteristic point detection. So let f be divided into n segments (f1 , . . . , fn ), where each fi is a subpolyline or a single line segment, and let 7
g be divided into m segments (g1 , . . . , gm ). We will abbreviate a sequence of segments fi , fi+1 , . . . , fk (i ≤ k) by the notation fi...k . Now we approach the correspondence problem. Basically there are three possibilities (C1)–(C3) for a correspondence involving a segment fi : (C1) fi is mapped to a single characteristic point (i.e., fi disappears), (C2) fi is mapped to a single segment gk , (C3) fi is mapped to a merged sequence of segments gk...(k+r) Analogously, we denote the three possible types of correspondence involving a segment gj by (C1′ )–(C3′ ). Clearly, the linear order of the segments along f and g has to be respected by the assignment and each segment can only take part in one of the six possibilities. Mathematically, we model a valid set of such corresponding pairs as what we call a correspondence relation ρ ⊆ {1, . . . , 2n+1}×{1, . . . , 2m+1}, where a segment fi corresponds to the element 2i ∈ {1, . . . , 2n + 1} and the endpoints of fi correspond to 2i − 1 and 2i + 1. Analogously, segment gj and its endpoints correspond to {2j − 1, 2j, 2j + 1} ⊆ {1, . . . , 2m +1} such that both ordered sets represent the alternating sequence of characteristic points and segments of f and g, respectively. In order to be valid, ρ has to satisfy the following properties (P1)–(P4) from the perspective of polyline f : (P1) ρ is monotone: if (i, k) ∈ ρ, (j, ℓ) ∈ ρ, and i < j then k ≤ ℓ; (P2) only contiguous sequences of points and segments can be mapped to an element on the other polyline: if (i, k) ∈ ρ, (i, ℓ) ∈ ρ, and k < ℓ then (i, k ′ ) ∈ ρ for all k < k ′ < ℓ; (P3) a merged sequence of elements of one polyline has a unique corresponding element on the other polyline: if (i, k) ∈ ρ, (i, ℓ) ∈ ρ, and k 6= ℓ then (j, k) ∈ / ρ and (j, ℓ) ∈ / ρ for all j 6= i; (P4) all elements are covered by ρ: for each i ∈ {1, . . . , 2n + 1} there is a j ∈ {1, . . . , 2m + 1} so that (i, j) ∈ ρ; Additionally, the symmetric properties from the perspective of g, denoted (P1′ )–(P4′ ), need to be satisfied. Such a correspondence relation ρ can be seen as a bipartite graph that is a spanning forest in which all trees are (non-trivial) stars. A drawing of such a graph is shown in Figure 2, where even-numbered vertices indicate segments and odd-numbered vertices indicate characteristic points. Trees containing a single even-numbered element, that is, a single segment, or trees with an oddnumbered internal vertex represent correspondences of type (C1) or (C1′ ). Trees containing exactly one even-numbered element on each side mean a 8
g }|
z
{
3 2
4
2m + 1
1
ρ 1 2
4 3
|
{z f
2n + 1 }
Fig. 2. Drawing of a correspondence relation ρ between two polylines f and g.
one-to-one correspondence of type (C2) or (C2′ ). Finally, stars with an evennumbered internal vertex and at least two additional even-numbered elements represent correspondences of type (C3) or (C3′ ). Now assume that there is a distance function or morphing distance δ associated with the morph between two (sub-)polylines. We suggest a morphing distance in the next section, but Algorithm 1, which is formulated below, is independent of the choice of the distance. It is based on dynamic programming and computes a minimum-distance correspondence. Algorithm 1 recursively fills a table T of size n × m, where entry T [i, j] stores the total distance or cost of optimally morphing f1...i to g1...j . This total distance is computed as the sum of a previous table entry and the additional distance involving pair (i, j) according to one of the above six types of correspondence. Consequently, we can obtain the cost of an optimum correspondence from T [n, m]. By keeping track of optimum subsolutions we can reconstruct the optimum correspondence by backtracking from T [n, m]. The required storage space and running time of filling the n × m table T in Algorithm 1 is O(nmK), which equals O(nm) provided that the look-back parameter K is constant. This parameter determines the maximum number of polyline segments that can be merged in order to be matched with another segment according to correspondences of types (C3) and (C3′ ). The final step of reconstructing the actual correspondence is done by backtracking in T and takes linear time. For this analysis we assumed that each distance δ(fi , gj ) can be computed in constant time. However, depending on which distance function is used, the time complexity of computing the required distances needs to be taken into account. 9
Algorithm 1: OptCor Input: Polylines f = (f1 , . . . , fn ) and g = (g1 , . . . , gm ), distance function δ. Output: Optimum correspondence for f and g. 1 T [0, 0] = 0 first 2 T [0, j] = T [0, j − 1] + δ(f1 , gj ), j = 1 . . . m first 3 T [i, 0] = T [i − 1, 0] + δ(fi , g1 ), i = 1 . . . n 4 for i = 1 to n do 5 for j = 1 to m do 6 T [i, j] = last type (C1) T [i − 1, j] + δ(fi , gj ) last type (C1′ ) T [i, j − 1] + δ(fi , gj ) min T [i − 1, j − 1] + δ(fi , gj ) type (C2)/(C2′ ) T [i − 1, j − k] + δ(fi , g(j−k+1)...j ), k = 2, . . . , K type (C3) T [i − k, j − 1] + δ(f(i−k+1)...i , gj ), k = 2, . . . , K type (C3′ ) 7 Store pointer to predecessor, i.e., to the table entry that yielded the minimum. 8 end 9 end 10 Generate optimum correspondence from T [n, m] using backtracking along pointers. 3.3 Distance functions
Algorithm 1 relies on a distance function δ that represents the cost of morphing between two (sub-)polylines. Distance functions for polylines can be defined in many ways. We consider three possible distance functions. Assume that two polylines f ′ and g ′ with uniform parameterizations α and β are given. Each point α(u) on f ′ will move to β(u) on g ′ along the straight-line trajectory σ(t, u) = (1 − t)α(u) + tβ(u) of length |α(u) − β(u)|.
3.3.1 Width The first distance function considers the longest such segment and is defined as δmax (f ′ , g ′ ) = max |α(u) − β(u)|. u∈[0,1]
(1)
This value is also known as the width of the morph (Efrat et al., 2001). It can be computed in linear time with respect to the complexity of the polylines. 10
3.3.2 Fr´echet Another well-known metric for polylines is the Fr´echet metric. It is minimizing the morphing width over all parameterizations of f ′ and g ′ and is defined as δF (f ′ , g ′ ) =
min δmax (f ′ , g ′ ),
α:[0,1]→f ′ β:[0,1]→g ′
(2)
where α and β are continuous, increasing functions. We used the implementation of the Fr´echet metric of van Oostrum and Veltkamp (2004). The running time of this implementation is O(mn log2 (mn)), where m and n denote the complexity of f ′ and the complexity of g ′ , respectively.
3.3.3 Integral Finally, we define a new distance measure that takes into account how far all points move during the morph by integrating over the trajectory lengths. This morphing distance is defined as ′
′
δI (f , g ) =
Z
0
1
|α(u) − β(u)|du
(3)
and can be computed in linear time with respect to the complexity of f ′ and g ′ .
3.3.4 Extensions Relying on a distance function that only takes into account trajectory lengths does not comprehend all aspects that a human expert would consider when trying to match polyline segments optimally. Thus we define further terms that can optionally be added to one of the above base distances. The first idea is to take into account the length difference of the two subpolylines f ′ and g ′ . Subpolylines that have about the same length seem to be preferable to subpolylines of very different lengths. We simply define the cost as the length difference ¯
¯
clen (f ′ , g ′ ) = ¯¯ |f ′ | − |g ′ | ¯¯.
(4)
The second idea considers the orientation of the two subpolylines. We want to give preference to matching pairs of subpolylines that are more or less translates. The translation vector of a corresponding pair α(u) and β(u) is simply the vector β(u) − α(u). These translation vectors themselves define a curve γ(u) = β(u) − α(u) for u ∈ [0, 1] which is again a polyline in our case, see Figure 3. Thus we can define the length of this polyline γ as a translation 11
cost of the morph between f ′ and g ′ : ctnl (f ′ , g ′ ) = |γ|.
(5)
Note that f ′ and g ′ are translates if and only if γ has length zero, that is, all translation vectors are equal; the more the translation vectors vary the larger the translation cost. α(2/3)
α(1)
γ(0)
f
(0, 0)
;
α(1/3)
γ(1/3)
g β(0) β(1/3) β(2/3) β(1) α(0)
γ(1)
γ(2/3)
Fig. 3. The curve γ defined by the parameterizations α of f and β of g.
The actual distance function δ to be used in Algorithm 1 can thus be expressed as a linear combination of a base distance and the above cost terms clen and ctnl . In our implementation the morphing cost δ(fi , gj ) of two subpolylines fi and gj is further weighted by the ratio (|fi | + |gj |)/(|f | + |g|) of the total length of fi and gj and the total length of the containing polylines f and g. This accounts for the relative visual importance of the pair (fi , gj ). Finally, we wish to avoid self-intersections in the morph. We can do this locally by setting the effective morphing distance to ∞ if matching two segments causes a self-intersection in the morph between them. However, in rare cases intersections between two non-corresponding subpolylines may still occur.
4
Case study
We evaluate our algorithms on three different types of polyline data: (1) a mountain road network in the French Alps, (2) river data, and (3) provincial borders in Germany. We do a detailed case study for the road data and briefly present one example for the course of a river and for a region boundary, respectively. All experiments were performed on an AMD Athlon XP 2600+ PC with 1.5GB main memory running under SuSE Linux 10.1. The characteristic point detection was implemented in C++ and compiled with gcc 4.2.1; the OptCor algorithm was implemented and tested in Java 1.5. 12
Road 2
Road 1
Fig. 4. Road network in the French Alps from the BD Cartor map series at scale 1:50,000. The highlighted regions are shown in more detail in Figures 5, 6, and 15.
4.1 Road network data We first tested our implementations with a data set of roads in the French Alps from the BD Cartor and the TOP100 series maps produced by the IGN Carto2001 project (Lecordix et al., 2005). For each road, we used a polyline from BD Cartor at scale 1:50,000, and a generalized version of the same road at scale 1:100,000 from the Carto2001 TOP100 maps. The complete data comprises 382 roads and is shown in Figure 4. Details about the network size and the number of characteristic points can be found in Table 1. Running times of the B´ezier analysis and the OptCor algorithm are given in Table 2. Note that in practice the computation of the optimum correspondence is part of the preprocessing of the data, while the actual morph using straight-line trajectories is computed at interactive speed. Thus even the running times of OptCor in the column all points seem acceptable. Due to the size of the network, we will evaluate our method exemplarily for a subnetwork and two single roads that are marked with circles in Figure 4. The morph of the complete network as well as animations of further examples can be found on our web site 1 . 1
http://i11www.iti.uni-karlsruhe.de/morphingmovies
13
characteristic points roads
ε=1
points
network complete
subnet
Road 1
Road 2
ε = 25
s
ns
s
ns
1:50,000
382
13345
9889
6916
2915
2742
1:100,000
382
10869
7904
5601
2535
2387
1:50,000
94
1656
1410
930
481
442
1:100,000
94
1291
1061
739
417
390
1:50,000
1
190
112
95
32
32
1:100,000
1
155
90
72
26
28
1:50,000
1
85
68
42
18
16
1:100,000
1
120
73
53
17
15
Table 1 Sizes of the example networks (s: smoothed, ns: non-smoothed). characteristic points ε=1
all network complete
B´ezier OptCor
subnet
B´ezier OptCor
Road 1
B´ezier OptCor
Road 2
B´ezier OptCor
points
ε = 25 s
man-
s
ns
ns
ual
–
7.72
0.51
12.22
0.69
–
99.84
84.10
43.06
14.83
13.17
–
–
2.40
0.07
3.70
0.13
–
5.88
6.57
2.78
1.29
1.10
–
–
< 0.01
< 0.01
< 0.01
< 0.01
–
3.15
2.49
1.39
0.62
0.59
0.62
–
< 0.01
< 0.01
< 0.01
< 0.01
–
1.15
1.18
0.60
0.32
0.27
0.31
Table 2 Running times (in seconds) for B´ezier analysis and OptCor (s: smoothed, ns: non-smoothed).
We start by showing the characteristic points detected for Road 1 in Figure 5 and for Road 2 in Figure 6. To conserve space, we show only those at scale 1:100,000 here; the comparison of the results holds also at the 1:50,000 scale. Figures 5a and 6a show all vertices of the polylines as characteristic points. Clearly, these points are very dense where the roads have sharp bends and are more spaced out in parts of less curvature. Thus using all points as characteristic points allows the algorithm to finely adjust the correspondence in 14
(a) All points.
(b) Smoothed, ε = 1.
(c) Non-smoothed, ε = 1.
(d) Smoothed, ε = 25.
(e) Non-smoothed, ε = 25.
(f) Manual selection.
Fig. 5. Characteristic points for Road 1 (generalized) with B´ezier threshold ε.
parts of high curvature. Applying the B´ezier analysis described in Section 3.1 reduces the number of characteristic points in particular within dense parts of the roads, as can be seen in the subsequent Figures 5b–5e and Figures 6b–6e. For a low threshold value of ε = 1 each bend is still covered by several characteristic points while a higher threshold of ε = 25 leads to finding roughly one characteristic point per bend, just as a human expert would do. Also note that using Gaussian smoothing prior to the B´ezier analysis tends to identify more characteristic points than in the same setting without smoothing. This is perhaps unexpected, since the smoothing was intended to reduce extraneous characteristic points in noisy sections of a polyline. In fact, the resampling that is performed prior to smoothing creates a much larger number of points that can be chosen as characteristic points. Due to this, it is possible that the B´ezier analysis produces a larger number of characteristic points after smoothing, particularly if ε is very low (note how more points are produced when ε = 1 but not when ε = 25). Note that almost all of the characteristic points marked by the smoothed B´ezier analysis lie on line segments between original polyline vertices. This means that the complexity of the polylines is increased artificially by inserting a large number of characteristic points. The unsmoothed cases are more restricted in that only input points can become characteristic points. Finally, for comparison, Figures 5f and 6f show the results of manually selecting characteristic points located in the peaks of the bends. The number of characteristic 15
(a) All points.
(b) Smoothed, ε = 1.
(c) Non-smoothed, ε = 1.
(d) Smoothed, ε = 25.
(e) Non-smoothed, ε = 25.
(f) Manual selection.
Fig. 6. Characteristic points for Road 2 (generalized) with B´ezier threshold ε.
points for each example is given in Table 1. Due to the relatively small size of these two examples the running times of the B´ezier analyses were below 0.01 seconds, see Table 2. For the selected subnetwork (see Figure 15) and the complete network Table 2 shows that the B´ezier analysis without Gaussian smoothing remains very fast with up to 0.69 seconds. Smoothing, however, increases the running times to values between 2.4 and 12.22 seconds. Next, we show the results of the OptCor algorithm for Road 1 and Road 2 using the previously described settings for partitioning the roads. In all our examples the OptCor algorithm uses as distance function an equally weighted sum of the integral distance δI and extensions clen and ctnl as described in Section 3.3. The reason for the first choice was that δI turned out to yield better results than both morphing width and Fr´echet distance. The look-back parameter was set to K = 5. Sequences of snapshots of the final morphs are shown in Figures 7 and 8 for Road 1, and in Figures 9 and 10 for Road 2. In each snapshot, previous frames are shown in increasingly light shades of grey to assist perception of the animation. For the purpose of comparison, we show in the same way the result of applying naive linear interpolation, in Figures 8c and 10c, to produce morphs for Road 1 and Road 2, respectively. Linear interpolation matches each point on one polyline to the point at the 16
Region A
Region B
Region B
(a) All points.
(b) Non-smoothed, ε = 1. (c) Non-smoothed, ε = 25.
Fig. 7. Road 1 morphs generated by OptCor.
same relative distance from the start on the other polyline. We omit the case [smoothed, ε = 1] from the figures here; the quality is comparable to the case [all points]. Four pairs of regions have been circled and labeled “Region A” through to “Region D” in the snapshots. Close-ups of these regions are given in Figures 11–14 for a detailed analysis of the morphs. Road 1 is an example where the generalization process applied typification in order to reduce a series of 17
Region A
(a) Smoothed, ε = 25.
(b) Manual placement.
(c) Linear interpolation (without OptCor).
Fig. 8. Road 1 morphs generated by OptCor.
three bends to two bends in Region A. The generalized version of Road 2 on the other hand exaggerates the bends in Regions C and D, which is also the case in Region B of Road 1. The morph of Region A shown in Figure 11 must deal with the fact that one bend in a series of three bends disappears in the generalized version. While linear interpolation (Figure 11b) collapses two bends completely in order to 18
Region C Region D
(a) All points.
(b) Non-smoothed, ε = 1. (c) Non-smoothed, ε = 25.
Fig. 9. Road 2 morphs generated by OptCor.
recreate one, all points (Figure 11a) merges two bends into a single bend, which we believe is preferable. It is perhaps arguable whether this is the best solution, however. There is obviously a trade-off between obtaining a smooth morph that retains the mental map, and producing the optimal diagram at a fixed scale. If a user stops zooming at an intermediate scale where the merging process is not quite completed it could make sense to continue merging (but keeping the scale) until the representation of the bends is acceptable. The morph of Region B in Figure 12 shows a case where the unsmoothed B´ezier analysis with ε = 25 produces far too much excess movement, compared to all points (and others). This is due to a rather poor placement of the characteristic points in this case as almost the same number of characteristic points (see Table 1) in the examples of Figures 12a and 12b leads to a much better morph comparable to all points in Figure 12a. Figure 12b also shows another undesirable effect: occasionally, especially for higher values of ε, two 19
Region C
Region D
(a) Smoothed, ε = 25.
(b) Manual placement.
(c) Linear interpolation (without OptCor).
Fig. 10. Road 2 morphs generated by OptCor.
neighboring characteristic segments form a sharp “kink” during the morph, which our algorithm currently cannot detect and avoid. Region C in Figure 13 shows a series of bends that are exaggerated slightly in the generalized road. While the all points morph (and the other OptCor morphs in Figures 9 and 10) correctly widen the bends and keep the shape intact, linear interpolation collapses the bends completely in order to open them up in the inverse direction with a lot of point movement. This shows again the importance of finding a correspondence that minimizes the defined morphing distance. Finally, Region D in Figure 14 is another example where two bends are exaggerated. This time the all points morph does not increase the bends nicely but rather creates an intermediate “appendix” to bend at the right-hand side. In 20
(a) All points.
(b) Linear interpolation. Fig. 11. Close-up of Region A (Road 1).
(a) All points.
(b) Unsmoothed, ε = 25. Fig. 12. Close-up of Region B (Road 1).
21
(a) All points.
(b) Linear interpolation. Fig. 13. Close-up of Region C (Road 2).
(a) All points.
(b) Manual placement. Fig. 14. Close-up of Region D (Road 2).
22
contrast, the manually placed points (as well as the setting smoothed, ε = 25) lead to a morph without undesired intermediate effects. We also applied OptCor to the subnetwork highlighted in Figure 4, and we show the result using all points as the set of characteristic points in Figure 15a. Figure 15b shows the linear interpolation of this subnetwork for comparison. Although the networks are drawn in the same size for all three scales it is still difficult to make out the details of such a complex example in this format, but on close inspection one can notice a lot more movement in the linear interpolation compared to the OptCor morph, particularly in the highlighted areas. Like in the examples Road 1 and Road 2, the linear interpolation again flattens some bends completely before they reappear (highlighted area in the middle). In the OptCor morph of that area one bend collapses while another one expands. Again the amount of point movement is much less than in the linear interpolation.
4.2 River data
As another class of polylines we consider a portion of the course of the river Elbe in Brandenburg, Germany. This example stems from the DTK1000 and c Bundesamt f¨ the Verwaltungsgrenzen 1:2,500,000 data sets (° ur Kartographie und Geod¨asie, Frankfurt am Main, 2008). The data from the first set is aimed at a target scale of 1:1,000,000 and consists of a polyline with 308 points, the data from the second set is aimed at 1:2,500,000 and uses 210 points. Figure 16 shows a sequence of snapshots from the OptCor morph using all input points as characteristic points in comparison to the linear interpolation of the same data. The representation of the river at the small scale has far less detail than its representation at the large scale, for example, almost all smaller crenulations disappear in the generalized small-scale version. The running time of the OptCor algorithm was 4.8 seconds for this instance. We can draw the same conclusions as previously for the road data: the OptCor morph succeeds in matching semantically equivalent parts of the river at both scales resulting in a smooth morph with almost no excess movement. On the other hand, the naive linear interpolation in Figure 16b again erroneously collapses some major bends at intermediate scales before making them reappear at the target scale. This creates unnecessary movement and alters the general shape of the river at intermediate steps, especially in the upper part highlighted in Figure 16. The quality of the morphs using characteristic points detected by the B´ezier analysis was—similarly to the road network—comparable to the morph using all points; these morphs, too, did not exhibit the rather poor behavior of the linear interpolation. 23
(a) All points OptCor morph.
(b) Linear interpolation.
Fig. 15. Morph of a subnetwork.
4.3 Provincial border data Our final example shows that our method can also deal with polygon data. The source of this example is the boundary of the province Hamburg, Germany from the same data sets as the river data in the previous example. The polygon 24
(a) All points OptCor morph.
(b) Linear interpolation.
Fig. 16. Morph of a portion of the course of the river Elbe.
uses 361 points at the scale 1:1,000,000 and 147 points at the scale 1:2,500,000. Both polygons were transformed into polylines by cutting them at a similar point that served as start- and endpoint of the polylines. Figure 17 shows a sequence of snapshots from the OptCor morph using all input points as characteristic points in comparison to the linear interpolation of the same data. The shape is generalized quite strongly for the smaller scale 25
and the crenulations disappear almost completely. The running time of the OptCor algorithm was 1.8 seconds. While not much movement is visible in the left part of the contour for both morphs, the linear interpolation performs poorly in the upper right part and also the transformation of the lower indentation is noticeably better in the OptCor morph (see the highlighting in Figure 17). This shows again that our algorithm is indeed able to retain the viewer’s mental map of the contour by finding the optimal correspondence between the characteristic parts of the two input polylines.
5
Concluding remarks
We have presented and evaluated an algorithm to compute an optimum correspondence for two polylines that are partitioned into a set of characteristic segments, respectively. Moreover we have introduced a heuristic method to compute these characteristic segments by fitting B´ezier curves to the polylines. Our case study indicates that the morphs computed by our method successfully transform the shape of one polyline into another while preserving the mental map of the viewer. These results extend to networks of multiple polylines as well as to polygonal regions. Using the individual line segments of the polylines as the characteristic segments yields good results but at the cost of higher running times. We found that our method for detecting characteristic points reduces the number of characteristic segments while at the same time the quality of the morphs remains generally high. Thus we propose our algorithm as a step towards a more global approach for continuous generalization that also takes the context of further non-linear data layers like point data into account. Apart from this grand challenge our algorithms could be improved in a number of ways. First, ensuring that self-intersections do not occur during a morph can be accomplished by utilizing the algorithm of Surazhsky and Gotsman (2001b) to compute non-linear trajectories to morph points. Further investigation would be necessary to avoid intersections between different polylines in a network. Secondly, it follows from the results in our case study that improved morphs can be obtained in some cases by manually selecting the positions of characteristic points. This asks for a deeper exploration of what constitutes a “good” set of characteristic points. Given a reasonable definition of this, an optimization problem could be formulated for improved characteristic point detection. Finally, even with manually chosen characteristic points, the OptCor algorithm can still produce an occasional “kink” during morphs. It may be possible to design an extension to the distance function that minimizes the occurrence of such kinks. 26
(a) All points OptCor morph.
(b) Linear interpolation.
Fig. 17. Morph of the provincial border of Hamburg.
27
6
Acknowledgments
The authors thank S´ebastien Musti`ere for providing us with the Carto2001 data and the Bundesamt f¨ ur Kartographie und Geod¨asie for the German provincial borders data. We also thank the anonymous referees for their valuable suggestions.
References Bespamyatnikh, S. (2002). An optimal morphing between polylines. International Journal of Computational Geometry & Applications, 12(3), 217–228. Cecconi, A. and Galanda, M. (2002). Adaptive zooming in Web cartography. Computer Graphics Forum, 21(4), 787–799. Cohen, S., Elber, G., and Bar-Yehuda, R. (1997). Matching of freeform curves. Computer-Aided Design, 29(5), 369–378. Douglas, D. and Peucker, T. (1973). Algorithms for the reduction of the number of points required to represent a digitized line or its caricature. The Canadian Cartographer , 10(2), 112–122. Efrat, A., Har-Peled, S., Guibas, L. J., and Murali, T. M. (2001). Morphing between polylines. In Proc. 12th ACM-SIAM Sympos. Discrete Algorithms (SODA’01), pages 680–689. Erten, C., Kobourov, S. G., and Pitta, C. (2004). Intersection-free morphing of planar graphs. In G. Liotta, editor, Proc. 11th International Symposium on Graph Drawing (GD’03), volume 2912 of Lecture Notes in Computer Science, pages 320–331. Springer-Verlag. Gomes, J., Darsa, L., Costa, B., and Velho, L. (1999). Warping and Morphing of Graphical Objects. Morgan Kaufmann, San Francisco. Jones, C. B. and Ware, J. M. (2005). Map generalization in the Web age. International Journal of Geographical Information Science, 19(8–9), 859– 870. Lecordix, F., Jahard, Y., Lemari´e, C., and Hauboin, E. (2005). The end of Carto 2001 project: Top100 based on bdcarto database. In Proc. 8th ICA Workshop on Generalisation and Multiple Representation, A Coru˜ na, Spain. Lowe, D. (1989). Organization of smooth image curves at multiple scales. International Journal of Computer Vision, 3(2), 119–130. Merrick, D., N¨ollenburg, M., Wolff, A., and Benkert, M. (2007). Morphing polygonal lines: A step towards continuous generalization. In Proc. 15th Annual Geographical Information Science Research Conference UK (GISRUK’07), pages 390–399, Maynooth, Ireland. Misue, K., Eades, P., Lai, W., and Sugiyama, K. (1995). Layout adjustment and the mental map. Journal of Visual Languages and Computing, 6(2), 183–210. Plazanet, C., Affholder, J.-G., and Fritsch, E. (1995). The importance of 28
geometric modeling in linear feature generalization. Cartography and Geographic Information Systems, 22(4), 291–305. Samoilov, T. and Elber, G. (1998). Self-intersection elimination in metamorphosis of two-dimensional curves. The Visual Computer , 14, 415–428. Schneider, P. J. (1988). Phoenix: An Interactive Curve Design System Based on the Automatic Fitting of Hand-Sketched Curves. Master’s thesis, Department of Computer Science, University of Washington. Sester, M. and Brenner, C. (2004). Continuous generalization for visualization on small mobile devices. In P. Fisher, editor, Developments in Spatial Data Handling – Proc. 11th International Symposium on Spatial Data Handling (SDH’04), pages 355–368. Springer-Verlag. Sezgin, T. M. (2001). Feature Point Detection and Curve Approximation for Early Processing of Free-Hand Sketches. Master’s thesis, Department of Electrical Engineering and Computer Science, Massachusetts Institute of Technology, Cambridge, MA, USA. Surazhsky, V. and Gotsman, C. (2001a). Controllable morphing of compatible planar triangulations. ACM Transactions on Graphics, 20(4), 1–21. Surazhsky, V. and Gotsman, C. (2001b). Morphing stick figures using optimized compatible triangulations. In Proc. Ninth Pacific Conference on Computer Graphics and Applications (PG’01), pages 40–49. van Kreveld, M. (2001). Smooth generalization for continuous zooming. In Proc. 20th International Cartographic Conference (ICC’01), pages 2180– 2185. van Oostrum, R. and Veltkamp, R. C. (2004). Parametric search made practical. Computational Geometry: Theory and Applications, 28, 75–88. Weibel, R. and Dutton, G. (1999). Generalising spatial data and dealing with multiple representations. In P. A. Longley, M. F. Goodchild, D. J. Maguire, and D. W. Rhind, editors, Geographical Information Systems – Principles and Technical Issues, volume 1, chapter 10, pages 125–155. John Wiley & Sons.
29