bioRxiv preprint first posted online Jun. 16, 2018; doi: http://dx.doi.org/10.1101/348839. The copyright holder for this preprint (which was not peer-reviewed) is the author/funder. All rights reserved. No reuse allowed without permission.
Morphogen-Lineage Selector Interactions During Surface Epithelial Commitment
Sandra P. Melo1,3*, Jillian M. Pattison1*, Samantha N. Piekos1*, Jessica L. Torkelson1, Elizaveta Bashkirova1,4, Maxwell R. Mumbach1,2, Charlotte Rajasingh1, Hanson Hui Zhen1, Lingjie Li1, Eric Liaw 1,5, Daniel Alber1, Adam J. Rubin1, Gautam Shankar1, Howard Y. Chang1,2, Paul A. 1
Khavari1, and Anthony E. Oro
1
Program in Epithelial Biology, Stanford University School of Medicine, Stanford, CA 94305, USA. 2Center for Personal Dynamic Regulomes, Stanford, CA 94305, USA.
Current Addresses: 3Agilent Technologies, Santa Clara, CA 95051, USA. 4Columbia Stem Cell Initiative, Columbia University Medical Center, New York, NY 10032, USA. 5David Geffen School of Medicine at UCLA, Los Angeles, CA 90095, USA. *These authors contributed equally to this work. Address correspondence to: Anthony E. Oro
[email protected]
bioRxiv preprint first posted online Jun. 16, 2018; doi: http://dx.doi.org/10.1101/348839. The copyright holder for this preprint (which was not peer-reviewed) is the author/funder. All rights reserved. No reuse allowed without permission.
1 2 3 4 5 6 7 8 9 10 11 12 13 14 15 16 17 18 19 20 21 22 23 24 25 26 27
Human embryonic stem cell (hESC) differentiation promises advances in regenerative medicine1-3, yet conversion of hESCs into tissues such as keratinocytes requires a better understanding of epigenetic interactions between the inductive morphogens retinoic acid (RA) and bone morphogenetic protein 4 (BMP), and the master regulator p634,5. Here we develop a robust, defined, keratinocyte differentiation system, and use a multi-dimensional genomics approach to interrogate the contributions of the morphogens and lineage selector to chromatin dynamics during early surface ectoderm commitment. In stark contrast to other master regulators6-9, we find using p63 gain and loss of function hESC lines, that p63 effects major transcriptional changes only after morphogenetic action. Morphogens alter chromatin accessibility and histone modifications, establishing an epigenetic landscape for p63 to modify. In turn, p63 closes chromatin accessibility and promotes the accumulation of repressive H3K27me3 histone modifications at sites distal to where it binds. Surprisingly, cohesin HiChIP10 visualization of genome-wide chromosome conformation reveals that both p63 and the morphogens contribute to dynamic long-range genomic interactions that increase the probability of negative transcriptional regulation at p63 target loci. p63-regulated accessibility, not H3K27me3 deposition, appears to drive early transcriptional changes. We illustrate morphogen-selector interactions by studying p63 negative feedback regulation of TFAP2C11, whereby disruption of the single p63 binding site results in a loss of p63mediated transcriptional control and dramatic increases in TFAP2C and p63 expression. Our study reveals the unexpected dependency of p63 on morphogenetic signaling to control long-range chromatin interactions during tissue specification and provides novel insights into how master regulators specify diverse morphological outcomes. Published protocols of hESC-derived keratinocytes suffer from heterogeneity due
28
to feeders and additive variability5,12-15, thus we developed a xeno-free, chemically-
29
defined differentiation system based on E6 media16 supplemented with two morphogens,
30
RA and BMP4 (Fig. 1a). This system was highly reproducible using hESCs and
31
recapitulated commitment towards a surface ectoderm fate, indicated by
32
immunofluorescence (IF) analysis of epithelial markers keratin 18 (K18)17 and p6318,19 by
33
day 7, followed by high levels of p63 and the keratinocyte maturation marker keratin 14
34
(K14)20 by day 45 (Fig. 1a). Robust p63 expression occurred only when both
35
morphogens were present, indicating a synergistic role for p63 accumulation (Fig. 1b,c,
36
Extended Data Fig. 1). As morphogenetic exposure for 7 days induced both uniform p63
37
expression and subsequent keratinocyte development 4,5, we interrogated this key 7-day
bioRxiv preprint first posted online Jun. 16, 2018; doi: http://dx.doi.org/10.1101/348839. The copyright holder for this preprint (which was not peer-reviewed) is the author/funder. All rights reserved. No reuse allowed without permission.
38
stage with a multi-dimensional genomics approach to understand the functional
39
interaction between p63 and the morphogens.
40
To assess the individual contributions to chromatin dynamics, we created p63
41
gain and loss of function hESCs using CRISPR/Cas9 technology (Fig. 1d,f) to yield a
42
panel of four cell types: d0 (wild-type hESCs), d0 p63GOF (hESCs ectopically
43
expressing p63), d7 p63WT (wild-type hESCs morphogen-treated, with endogenous
44
p63), and d7 p63KO (hESCs morphogen-treated with no p63 expression). We verified
45
p63 expression in these cell lines through IF, western blot, and sequencing (Fig. 1e,g,
46
Extended Data Fig. 2).
47
Previous studies indicate that p63 overexpression can drive surface ectoderm
48
commitment21, yet remarkably, expression of p63 in hESCs was insufficient to induce
49
differentiation (Fig. 1e, Extended Data Fig. 2). Consistent with this observation,
50
transcriptome analysis using RNA-sequencing (RNA-seq) revealed moderate changes in
51
expression in roughly 300 genes between d0 and d0 p63GOF cells, whereas more than
52
2400 genes were differentially expressed in d7 p63WT vs. d7 p63KO cells (Fig. 1h).
53
Further, independent of the presence or absence of p63, morphogen exposure resulted
54
in an exit from pluripotency and was required for p63 regulation of key transcription
55
factors associated with epithelial development (Fig. 1h, Extended Data Fig. 2c). These
56
important epithelial transcription factors, including TFAP2C, KLF4, GATA3, GRHL2,
57
MSX2, and ELF3, were all repressed by p63 upon morphogen treatment. We conclude
58
that morphogenetic signaling promotes a simple epithelial state, while enabling p63 to
59
modify the morphogen-induced transcriptome to drive these stratified epidermal fates.
60
The striking influence of morphogens on p63 activity led us to investigate
61
whether differences in p63 genomic occupancy accounted for the altered transcriptional
62
activity. p63 ChIP-seq in d0 p63GOF and d7 p63WT revealed 7,960 and 6,097 p63
63
binding sites, respectively, and the p63 motif was significantly enriched under peaks in
bioRxiv preprint first posted online Jun. 16, 2018; doi: http://dx.doi.org/10.1101/348839. The copyright holder for this preprint (which was not peer-reviewed) is the author/funder. All rights reserved. No reuse allowed without permission.
64
both datasets (Fig. 1i). Remarkably, over 70% of the sites were identical between both
65
datasets (Fig. 1j,k), while 17% of peaks were gained in the d0 p63GOF (Extended Data
66
Fig. 3a). Thus, differences in p63 occupancy cannot explain the dramatic morphogen-
67
regulated p63 activity.
68
We next characterized how the morphogens and p63 affected chromatin
69
accessibility and deposition of four histone modifications (H3K27ac, H3K27me3,
70
H3K4me3, H3K4me1) using the Assay for Transposase Accessible Chromatin followed
71
by sequencing (ATAC-seq) and histone chromatin immunoprecipitation (ChIP-seq),
72
respectively. Overall, approximately 20,000 transposase accessible sites changed
73
during the induction phase, with 14,000 opening and 6,000 closing between d0 and d7
74
p63WT (Fig. 2a). Additionally, over one third of the morphogen-dependent accessible
75
sites became even more accessible upon p63 loss (Fig. 2a,d). Comparison of
76
established histone modifications in d7 p63WT vs. p63KO revealed significant
77
differences in H3K27me3, yet no observable differences on activating promoter or
78
enhancer marks (Extended Data Fig. 3). Opposite to ATAC-seq changes, p63 absence
79
resulted in a significant decrease in signal of the H3K27me3 mark, whereas H3K27me3
80
increased in d0 p63GOF cells (Fig. 2b,d). ChromHMM analysis indicated most of the
81
accessibility changes and p63 binding sites occur in enhancers, rather than promoters
82
(Extended Data Fig. 3). We conclude that p63 edits a subset of the morphogen-induced
83
accessibility changes and regulates the accumulation of repressive H3K27me3 histone
84
modifications.
85
Lineage selectors can act both directly on the epigenetic landscape at the site of
86
binding to alter accessibility or histone modification deposition, or indirectly at a
87
distance22. To determine how p63 acts, we intersected the p63-dependent H3K27me3
88
regions and morphogen-dependent accessible sites with p63 binding sites, revealing
89
that few of the p63 binding sites overlapped with either of these changing elements (Fig.
bioRxiv preprint first posted online Jun. 16, 2018; doi: http://dx.doi.org/10.1101/348839. The copyright holder for this preprint (which was not peer-reviewed) is the author/funder. All rights reserved. No reuse allowed without permission.
90
2e). These data indicate that most of the p63 epigenetic regulatory action occurs distal
91
to p63 binding. Interestingly, when we assigned p63 binding sites, morphogen-
92
dependent accessible sites, and differential H3K27me3 regions to the nearest genes
93
through GREAT, we found that these elements converge on a common gene set,
94
despite each being distinct genomic regions (Fig. 2f, Extended Data Fig. 3).
95
To assess the connectivity and dynamics of the three-dimensional architecture
96
between these distinct genomic regions, we employed cohesin HiChIP, a recent method
97
analogous to Hi-C10, in all four cell types. We identified high-confidence chromatin
98
contacts with 10 kb resolution using FitHiC 23 (Extended Data Fig. 4) and demonstrated
99
that 53% of p63 ChIP-seq peaks in d7 p63WT cells participate in these chromatin
100
connections (Fig. 3a). Additionally, we illustrated that most morphogen and p63-
101
dependent dynamic elements also participate in looping connections. Notably, only 34%
102
of genes GREAT identified as having transcriptional start sites (TSSs) connected to p63
103
binding sites were verified by cohesin HiChIP, reinforcing the non-uniformity of the
104
existing chromatin landscape (Extended Data Fig. 3,5).
105
For the 4,409 protein-coding, p63-dependent genes, we determined the
106
connectivity of their TSSs to a p63 binding site (Fig. 3b), revealing that 13% of these
107
genes were in direct contact with p63 via chromatin looping (1º) and 11% were in
108
contact via an indirect connection through a morphogen-dependent accessible site or
109
H3K27me3 element (2º). Although more complex conformations through multiple
110
elements (3º) were detected, random simulation demonstrated that p63 was not
111
connected to p63-dependent genes by 3º connections at a frequency above random
112
chance (FDR < 0.005); thus we focused on the 0º, 1 º, and 2º p63 connections (Fig. 3b,
113
Extended Data Fig. 6).
114
We further interrogated the correlation between p63 connection to the TSS and
115
transcriptional regulation, finding that p63 connectivity was insufficient to regulate gene
bioRxiv preprint first posted online Jun. 16, 2018; doi: http://dx.doi.org/10.1101/348839. The copyright holder for this preprint (which was not peer-reviewed) is the author/funder. All rights reserved. No reuse allowed without permission.
116
expression. However, both p63-dependent and -independent genes connected to a p63
117
site were involved in organ development and cell differentiation, consistent with known
118
p63 function (Fig. 3c)7,8. Additionally, the probability of transcriptional repression was
119
significantly higher at genes connected to p63 (Fig. 3d). d7 p63-independent genes
120
connected to p63 include keratinocyte differentiation genes whose expression becomes
121
p63-dependent later during keratinocyte maturation, including p63 itself, MAFB, JAG1,
122
ID2, and the Epidermal Differentiation Cluster (Extended Data Table 1)24-26. These data
123
suggest that p63 and morphogen-regulated chromatin connections foreshadow future
124
gene action. In all, we demonstrated that a large subset of the morphogen and p63-
125
dependent elements are physically connected at d7 (Fig. 3e), accounting for the ability of
126
p63 to regulate the epigenetic landscape at a distance.
127
Next, we determined the extent to which p63 and the morphogens influenced
128
connectivity (Fig. 3f). In 1º (middle panel) and 2º (right panel) connections, contacts
129
between morphogen-dependent accessible sites and p63 binding sites were regulated
130
by both the morphogens and p63, with loss of p63 abolishing the connections, while
131
overexpression of p63 failed to enhance them. Conversely, p63-H3K27me3 and p63-
132
TSS interactions were enhanced by the morphogens and p63 overexpression, and
133
weakened by p63 loss (Extended Data Fig. 7). Finally, we determined that of the 3D-
134
conformations connecting p63 to a TSS, the connections to both morphogen-dependent
135
accessible sites (Fig. 3g) and TSSs demonstrated greater repression than p63
136
connected via an H3K27me3 peak (Extended Data Fig. 7). These findings indicate that
137
for optimal p63-regulated transcription both the morphogens and p63 are needed.
138
From our global analyses, we identified TFAP2C, a critical epithelial regulator11,
139
as a gene induced by morphogens and repressed by p63 that exhibits a complex
140
chromatin architecture driving its regulation. We sought to illustrate the p63-morphogen
141
interactions by dissecting the p63 negative feedback regulation of this key
bioRxiv preprint first posted online Jun. 16, 2018; doi: http://dx.doi.org/10.1101/348839. The copyright holder for this preprint (which was not peer-reviewed) is the author/funder. All rights reserved. No reuse allowed without permission.
142
developmental regulator (Fig. 4). Cohesin HiChIP and genomic analysis at this locus
143
(Fig. 4a, Extended Data Fig. 8) revealed a distal p63 binding site with three d7 p63WT
144
connections to the TSS: through a direct contact, the adjacent morphogen-dependent
145
accessible site, and the distal H3K27me3 peak, all within 400 kb. We confirmed our
146
cohesin HiChIP with UMI-4C27, a locus-specific technique, using primer viewpoints
147
around the three connections (Extended Data Fig. 9).
148
Comparison of the chromosome conformation among the different cell lines
149
indicated that p63 presence enhances connectivity to all three of the main loops at d7
150
and in the absence of p63, the connections and transcriptional output collapse.
151
Morphogen exposure connects p63 to the induced neighboring morphogen-dependent
152
accessible site, but the connection relies on ongoing p63 expression to maintain it, as
153
loss of p63 fails to uphold it despite morphogen presence. Thus, our analysis of the
154
TFAP2C locus shows that both the morphogens and p63 contribute to proper regulation.
155
To validate the importance of the morphogen-dependent accessible site, we
156
removed the region using CRISPR/Cas9 and demonstrated a loss of morphogen-
157
induced TFAP2C expression (Extended Data Fig. 8b). Furthermore, we hypothesized
158
that removal of the p63 binding site should drive both TFAP2C and p63 expression,
159
given our observation that TFAP2C induces p63 expression in hESCs (unpublished
160
results) and that p63 provides important early negative regulation of TFAP2C. To test
161
this, we deleted the p63 binding site (p63BSKO) and found dramatically elevated levels
162
of TFAP2C at d7, consistent with the predicted negative feedback modulation of
163
TFAP2C by p63 (Fig. 4b,c). Moreover, d7 p63BSKO cells showed increased expression
164
of p63, demonstrating the need for tight p63-morphogen regulation to control the levels
165
of key developmental factors. Histone ChIP-qPCR revealed a loss of H3K27me3
166
accumulation at both the TSS and the distal H3K27me3 site in d7 p63BSKO cells, while
167
other non p63-connected sites remained unaffected (Fig. 4d). Similarly, the morphogen-
bioRxiv preprint first posted online Jun. 16, 2018; doi: http://dx.doi.org/10.1101/348839. The copyright holder for this preprint (which was not peer-reviewed) is the author/funder. All rights reserved. No reuse allowed without permission.
168
dependent accessible site became more accessible in d7 p63BSKO cells, to levels
169
found in d7 p63KO cells (Fig. 4d), confirming the connectivity of these distal elements.
170
Here we deepen our understanding of the interplay between morphogens and
171
lineage selectors during surface ectoderm commitment, and find the surprising inability
172
for the lineage selector p63 to function in the absence of morphogen action. Morphogens
173
provide the powerful driving force for cell state change by inducing expression of the
174
lineage factor while also altering chromatin accessibility, histone modifications, and
175
chromosome conformation. p63, in turn, further modifies the morphogen-dependent
176
epigenetic landscape to drive surface ectoderm differentiation. Further, our results
177
illustrate how chromatin connections to the lineage selector p63 are necessary and more
178
likely to induce gene expression changes, but are not sufficient. Our finding that p63 at
179
d7 is poised to act on later keratinocyte differentiation genes (Extended Data Table 1) 24-
180
26
181
will enable broader p63-dependent transcription. This is functionally similar to “poised”
182
histone modifications and provides a structural explanation of how the order of
183
morphogen exposure can determine downstream transcriptional programs. This study
184
has important implications for the apparent autonomy of lineage selectors and for the
185
basis of morphogenesis. Our work suggests that small changes in morphogen activity
186
can dramatically alter the induced chromosome landscape and connectivity, explaining
187
how a single lineage selector like p63 can direct such a panoply of transcriptional
188
programs depending on the specific morphogen exposure.
189
suggests the existence of additional inductive influences after addition of RA/BMP that
bioRxiv preprint first posted online Jun. 16, 2018; doi: http://dx.doi.org/10.1101/348839. The copyright holder for this preprint (which was not peer-reviewed) is the author/funder. All rights reserved. No reuse allowed without permission.
190
References
191
1.
192 193
and disease modeling. Curr Stem Cell Res Ther 9, 73-81 (2014). 2.
194 195
Inoue, H., Nagata, N., Kurokawa, H. & Yamanaka, S. iPS cells: a game changer for future medicine. The EMBO journal 33, 409-417 (2014).
3.
196 197
Walmsley, G.G., et al. Induced pluripotent stem cells in regenerative medicine
Hanna, J., et al. Treatment of sickle cell anemia mouse model with iPS cells generated from autologous skin. Science 318, 1920-1923 (2007).
4.
Umegaki-Arao, N., et al. Induced pluripotent stem cells from human revertant
198
keratinocytes for the treatment of epidermolysis bullosa. Sci Transl Med 6,
199
264ra164 (2014).
200
5.
Sebastiano, V., et al. Human COL7A1-corrected induced pluripotent stem cells
201
for the treatment of recessive dystrophic epidermolysis bullosa. Sci Transl Med 6,
202
264ra163 (2014).
203
6.
204 205
for gene expression. Genes & development 25, 2227-2241 (2011). 7.
206 207
8.
9.
Lupien, M., et al. FoxA1 translates epigenetic signatures into enhancer-driven lineage-specific transcription. Cell 132, 958-970 (2008).
10.
212 213
Mills, A.A., et al. p63 is a p53 homologue required for limb and epidermal morphogenesis. Nature 398, 708-713 (1999).
210 211
Yang, A., et al. p63 is essential for regenerative proliferation in limb, craniofacial and epithelial development. Nature 398, 714-718 (1999).
208 209
Zaret, K.S. & Carroll, J.S. Pioneer transcription factors: establishing competence
Mumbach, M.R., et al. HiChIP: efficient and sensitive analysis of protein-directed genome architecture. Nature methods 13, 919-922 (2016).
11.
Qiao, Y., et al. AP2gamma regulates neural and epidermal development
214
downstream of the BMP pathway at early stages of ectodermal patterning. Cell
215
research 22, 1546-1561 (2012).
bioRxiv preprint first posted online Jun. 16, 2018; doi: http://dx.doi.org/10.1101/348839. The copyright holder for this preprint (which was not peer-reviewed) is the author/funder. All rights reserved. No reuse allowed without permission.
216
12.
Metallo, C.M., Ji, L., de Pablo, J.J. & Palecek, S.P. Retinoic acid and bone
217
morphogenetic protein signaling synergize to efficiently direct epithelial
218
differentiation of human embryonic stem cells. Stem cells 26, 372-380 (2008).
219
13.
220 221
induced pluripotent stem cells (iPSCs). PloS one 8, e77673 (2013). 14.
222 223
15.
Coraux, C., et al. Reconstituted skin from murine embryonic stem cells. Curr Biol 13, 849-853 (2003).
16.
226 227
Guenou, H., et al. Human embryonic stem-cell derivatives for full reconstruction of the pluristratified epidermis: a preclinical study. Lancet 374, 1745-1753 (2009).
224 225
Itoh, M., et al. Generation of 3D skin equivalents fully reconstituted from human
Chen, G., et al. Chemically defined conditions for human iPSC derivation and culture. Nature methods 8, 424-429 (2011).
17.
Owens, D.W. & Lane, E.B. The quest for the function of simple epithelial keratins.
228
BioEssays : news and reviews in molecular, cellular and developmental biology
229
25, 748-758 (2003).
230
18.
Senoo, M., Pinto, F., Crum, C.P. & McKeon, F. p63 Is essential for the
231
proliferative potential of stem cells in stratified epithelia. Cell 129, 523-536
232
(2007).
233
19.
234 235
Koster, M.I. & Roop, D.R. Mechanisms regulating epithelial stratification. Annu Rev Cell Dev Biol 23, 93-113 (2007).
20.
Green, H., Easley, K. & Iuchi, S. Marker succession during the development of
236
keratinocytes from cultured human embryonic stem cells. Proceedings of the
237
National Academy of Sciences of the United States of America 100, 15625-
238
15630 (2003).
239 240
21.
Aberdam, E., et al. A pure population of ectodermal cells derived from human embryonic stem cells. Stem cells 26, 440-444 (2008).
bioRxiv preprint first posted online Jun. 16, 2018; doi: http://dx.doi.org/10.1101/348839. The copyright holder for this preprint (which was not peer-reviewed) is the author/funder. All rights reserved. No reuse allowed without permission.
241
22.
242 243
developmental transitions in the cardiac lineage. Cell 151, 206-220 (2012). 23.
244 245
Ay, F., Bailey, T.L. & Noble, W.S. Statistical confidence estimation for Hi-C data reveals regulatory chromatin contacts. Genome research 24, 999-1011 (2014).
24.
246 247
Wamstad, J.A., et al. Dynamic and coordinated epigenetic regulation of
Barton, C.E., et al. Novel p63 target genes involved in paracrine signaling and keratinocyte differentiation. Cell death & disease 1, e74 (2010).
25.
Koh, L.F., Ng, B.K., Bertrand, J. & Thierry, F. Transcriptional control of late
248
differentiation in human keratinocytes by TAp63 and Notch. Exp Dermatol 24,
249
754-760 (2015).
250
26.
Truong, A.B., Kretz, M., Ridky, T.W., Kimmel, R. & Khavari, P.A. p63 regulates
251
proliferation and differentiation of developmentally mature keratinocytes. Genes
252
& development 20, 3185-3197 (2006).
253 254 255
27.
Schwartzman, O., et al. UMI-4C for quantitative and targeted chromosomal contact profiling. Nature methods 13, 685-691 (2016).
bioRxiv preprint first posted online Jun. 16, 2018; doi: http://dx.doi.org/10.1101/348839. The copyright holder for this preprint (which was not peer-reviewed) is the author/funder. All rights reserved. No reuse allowed without permission.
256
Acknowledgements
257
We thank members of the Oro Laboratory, P. Greenside, J. Wysocka, A. Kundaje, O.
258
Wapinski, and D. Webster for helpful discussions and comments. This work was
259
supported by CIRM Tools grant RT3-07796 (A.E.O.), NIH/NIAMS grant F32AR070565
260
(J.M.P.), and NIH P50 HG007735 (H.Y.C.).
261 262
Author Contributions
263
S.P.M. and J.M.P. designed and executed experiments, analyzed data, and wrote the
264
manuscript. S.N.P. analyzed data and edited the manuscript. J.L.T., E.B., M.R.M., C.R.,
265
H.H.Z., and L.L. executed experiments and contributed to experimental design. E.L.,
266
D.A., A.J.R., and G.S. contributed to data analysis. H.Y.C. and P.A.K. contributed to
267
experimental design. A.E.O. designed experiments, analyzed data, wrote the
268
manuscript, and conceived the project with S.P.M.
269 270
Author Information
271
These authors contributed equally to this work.
272
Sandra P. Melo, Jillian M. Pattison, & Samantha N. Piekos
273 274
Affiliations
275
Program in Epithelial Biology, Stanford University School of Medicine, Stanford,
276
California, USA
277
Sandra P. Melo, Jillian M. Pattison, Samantha N. Piekos, Jessica L. Torkelson, Elizaveta
278
Bashkirova, Maxwell R. Mumbach, Charlotte Rajasingh, Hanson Hui Zhen, Lingjie Li,
279
Daniel Alber, Adam J. Rubin, Gautam Shankar, Howard Y. Chang, Paul A. Khavari, &
280
Anthony E. Oro
281
bioRxiv preprint first posted online Jun. 16, 2018; doi: http://dx.doi.org/10.1101/348839. The copyright holder for this preprint (which was not peer-reviewed) is the author/funder. All rights reserved. No reuse allowed without permission.
282
Center for Personal Dynamic Regulomes, Stanford, CA 94305, USA
283
Maxwell R. Mumbach & Howard Y. Chang
284 285
Current Addresses
286
Agilent Technologies, Santa Clara, CA 95051, USA
287
Sandra P. Melo
288 289
Columbia Stem Cell Initiative, Columbia University Medical Center, New York, NY
290
10032, USA
291
Elizaveta Bashkirova
292 293
David Geffen School of Medicine at UCLA, Los Angeles, CA 90095, USA
294
Eric Liaw
295 296
Corresponding Author
297
Correspondence to Anthony E. Oro:
[email protected]
298 299
Competing Interests
300
The authors declare no competing financial interests.
bioRxiv preprint first posted online Jun. 16, 2018; doi: http://dx.doi.org/10.1101/348839. The copyright holder for this preprint (which was not peer-reviewed) is the author/funder. All rights reserved. No reuse allowed without permission.
301
Figure Legends
302
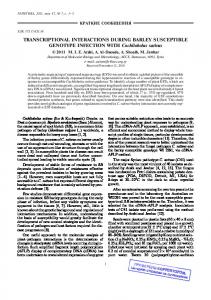
Figure 1. Morphogens and the lineage selector p63 cooperate to drive early stratified
303
epithelial differentiation. (a) Differentiation of hESCs into keratinocytes takes 60 days in
304
the xeno-free, defined system. Treatment with RA and BMP4 for 7 days induces K18
305
and p63 expression. Switching the cells into keratinocyte media allows for selection and
306
growth of functional keratinocytes (kc) that express K14 and p63. (b,c) hESCs need
307
exposure to both RA and BMP4 to achieve high p63 expression. Error bars represent
308
standard deviation. (d) Strategy for generating the d0 p63GOF cell line. Numbered black
309
boxes signify exons. (e) Expression of p63 in the d0 p63GOF line, showing even with
310
Dox treatment, there is no loss in Oct4 expression. (f) Strategy for generating the p63KO
311
line, using a two gRNA CRISPR/Cas9 approach. (g) IF validation of the p63KO line,
312
showing loss of p63 expression and higher levels of K18. All IF scale bars represent 50
313
m. (h) Differential expression analysis from RNA-seq (measured by DESeq2) between
314
the d0 and d0 p63GOF lines (upper panel), and the d7 p63WT and p63KO lines (lower
315
panel). The gray dots on the scatter plot represent no change in gene expression
316
between the two cell types, while red represents increased expression in the d0 or d7
317
wild type by a > 2 fold change and blue represents decreased expression in the d0 or d7
318
wild type by a < -2 fold change. Key transcription factors associated with epithelial
319
development are induced by the morphogens and repressed by p63 at d7. (i) The p63
320
motif was the most significantly recovered motif under p63 ChIP-seq peaks in d0
321
p63GOF and d7 p63WT cells. (j) p63 binds distal to TSSs as depicted at the HES1 locus
322
(70 kb away) and to the same sites in d0 p63GOF and d7 p63WT. (k) p63 binds to
323
similar sites genome-wide with and without morphogen presence, as depicted in the
324
Venn Diagram. The majority of the d7 p63 binding sites are fully recovered in the d0
325
p63GOF line.
326
bioRxiv preprint first posted online Jun. 16, 2018; doi: http://dx.doi.org/10.1101/348839. The copyright holder for this preprint (which was not peer-reviewed) is the author/funder. All rights reserved. No reuse allowed without permission.
327
Figure 2. The morphogens establish an epigenetic landscape that p63 modifies at a
328
distance. (a) Differential accessible regions between d0 and d7 p63WT as analyzed
329
using DESeq2 on ATAC-seq signal. Heatmaps represent the signal at these ATAC
330
regions within the various cell types and assays: p63 ChIP-seq signal (red, left panel),
331
ATAC-seq signal (blue, middle panel), and H3K27me3 ChIP-seq signal (purple, right
332
panel). 14,191 differential regions become more accessible upon morphogen treatment
333
(morphogen-dependent). (b) Differential H3K27me3 regions between d7 p63WT and
334
p63KO as analyzed by DESeq2. Heatmaps represent the same datasets as (a) only
335
signal is shown at differential H3K27me3 sites (3,793 sites). (c) ATAC-seq (blue) and
336
H3K27me3 (purple) signal at p63 binding sites (red). (d) Signal intensities of p63 ChIP-
337
seq, ATAC-seq, and H3K27me3 ChIP-seq shown at the TFAP2A locus. (e) The overlap
338
of genomic regions that are differential as measured in (a), (b), and (c). The genomic
339
location intersect is very low. (f) GREAT analysis linking the above differential regions to
340
the closest gene shows that these elements converge on a similar gene set. While their
341
physical genomic locations do not overlap, they are linked to a common gene via
342
GREAT.
343 344
Figure 3. p63 - TSS connections are associated with negative regulation genome-wide.
345
(a) Number of p63 binding sites (BS), p63-dependent (p63-dep) H3K27me3 sites,
346
morphogen-dependent (morph-dep) ATAC sites, and p63-dependent TSSs that
347
participate in chromatin looping (Anchored, red) vs those that do not (Not Anchored,
348
blue) in d7 p63WT cells. (b) Percentage of p63-independent (p63-indep) genes (blue)
349
and p63-dep genes (red), whose TSS is connected to p63 by direct binding (0°), direct
350
contact (1°), or connected via one (2°) or two (3°) morph-dep ATAC and/or p63-dep
351
H3K27me3 elements. (c) Gene Ontological Terms associated with p63-indep genes
352
(blue) and p63-dep genes (red), which are connected to p63. (d) ecdf of the log2 fold
bioRxiv preprint first posted online Jun. 16, 2018; doi: http://dx.doi.org/10.1101/348839. The copyright holder for this preprint (which was not peer-reviewed) is the author/funder. All rights reserved. No reuse allowed without permission.
353
change in gene expression between d7 p63WT vs d7 p63KO cells (d7 p63KO / d7
354
p63WT) for all p63 connected genes (red) and p63 1° connected genes (blue) compared
355
to all genes (black). (e) 1° contact connections between p63 BS (red), p63-dep
356
H3K27me3 (gold), and morph-dep ATAC (blue). (f) Change in connectivity strength
357
between various cell types of all contacts (left panel), p63 - morph-dep ATAC contacts
358
(middle panel), and p63 - morph-dep ATAC contacts in which both elements are
359
connected to the TSS (right panel). n = number of contacts. (g) ecdf of the change in
360
expression level (d7 p63WT vs d7 p63KO) of genes whose TSS is connected to a p63
361
BS and morph-dep ATAC site, which in turn are connected to each other (green)
362
compared to all genes (black). FDR by monte carlo simulation
363
**FDR