Oecologia DOI 10.1007/s00442-014-3199-9
POPULATION ECOLOGY - ORIGINAL RESEARCH
Morphological variation and different branch modularity across contrasting flow conditions in dominant Pocillopora reef‑building corals David A. Paz‑García · Alejandro Aldana‑Moreno · Rafael A. Cabral‑Tena · Francisco J. García‑De‑León · Michael E. Hellberg · Eduardo F. Balart
Received: 19 April 2014 / Accepted: 12 December 2014 © Springer-Verlag Berlin Heidelberg 2015
Abstract Pocillopora corals, the dominant reef-builders in the Eastern Tropical Pacific, exhibit a high level of phenotypic plasticity, making the interpretation of morphological variation and the identification of species challenging. To test the hypothesis that different coral morphospecies represent phenotypes that develop in different flow conditions, we compared branch characters in three Pocillopora morphospecies (P. damicornis, P. verrucosa, and P. meandrina) from two communities in the Gulf of California exposed to contrasting flow conditions. Morphological variation and branch modularity (i.e., the tendency of different sets of branch traits to vary in a coordinated way) were assessed in colonies classified as Pocillopora type 1 according to two mitochondrial regions. Our results can be summarized as follows. (1) Pocillopora type 1 morphospecies Communicated by Andrew Baker. Electronic supplementary material The online version of this article (doi:10.1007/s00442-014-3199-9) contains supplementary material, which is available to authorized users. D. A. Paz‑García · A. Aldana‑Moreno · R. A. Cabral‑Tena · E. F. Balart (*) Laboratorio de Necton y Ecología de Arrecifes, Centro de Investigaciones Biológicas del Noroeste, S.C. (CIBNOR), Instituto Politécnico Nacional 195, Colonia Playa Palo de Santa Rita Sur, 23096 La Paz, Baja California Sur, Mexico e-mail:
[email protected] D. A. Paz‑García · F. J. García‑De‑León Laboratorio de Genética para la Conservación, Centro de Investigaciones Biológicas del Noroeste S.C. (CIBNOR), Instituto Politécnico Nacional 195, La Paz 23096, Baja California Sur, Mexico M. E. Hellberg Department of Biological Sciences, Louisiana State University, Baton Rouge, LA 70803, USA
corresponded to a pattern of morphological variation in the Gulf of California. Overall, P. damicornis had the thinnest branches and its colonies the highest branch density, followed by P. verrucosa, and then by P. meandrina, which had the thickest branches and its colonies the lowest branch density. (2) The differentiation among morphospecies was promoted by different levels of modularity of traits. P. verrucosa had the highest coordination of traits, followed by P. damicornis, and P. meandrina. (3) The variation and modularity of branch traits were related to water flow condition. Morphology under the high-flow condition was more similar among morphospecies than under the low-flow condition and seemed to be related to mechanisms for coping with these conditions. Our results provide the first evidence that in scleractinian corals different levels of modularity can be promoted by different environmental conditions. Keywords Phenotypic modularity · Morphometrics · Pocillopora morphospecies · Phenotypic plasticity · Easter Tropical Pacific · Mitochondrial lineage
Introduction Organisms with broad distributions are often exposed to environmental heterogeneity across their geographical range. Environmental heterogeneity can favor different phenotypes between sites and morphological variation along environmental gradients (Veron 1995; Todd 2008; Fusco and Minelli 2010). This difference of expression response is known as phenotypic plasticity and can be, or not, due to an underlying genetic program of the organism (Pigliucci et al. 2006; Zhang et al. 2013). Phenotypic plasticity can contribute to an individual’s ability to cope with such environmental variation, as well as with changes
13
Oecologia
that occur in one place over an organism’s lifetime (Fusco and Minelli 2010; Pfennig et al. 2010). Understanding phenotypic plasticity is crucial to the correct identification of species, accurate estimates of diversity, the application of appropriate efforts of conservation and management, as well as for providing information about mechanisms responsible for morphological variation and its evolutionary potential. Tropical marine reefs are physically built by sessile organisms (corals, sponges, gorgonians, and algae) that often show a high degree of morphological plasticity. Traditionally, skeletal morphology has been used as the main character for the identification of coral species (Veron and Pichon 1976; Glynn 1999; Veron 2000). However, modular organisms such as corals are composed of repetitive units that exhibit high levels of phenotypic plasticity at each module (Kaandorp 1999; Shaish et al. 2007; Todd 2008; Chindapol et al. 2013). Three units of morphological organization or modules can be distinguished in branching corals: features of (1) individual polyps, (2) individual branches, and (3) the whole colony (Ryaland and Warner 1986; Shaish et al. 2007). Most studies of morphological variation in corals focus on individual branches (Nakamura and Yamasaki 2006; Shaish et al. 2007; Kaniewska et al. 2008; Einbinder et al. 2009), however the coordination of different traits (or lack thereof) can have large effects on the morphological variation, as seen in octocorals (Sánchez and Lasker 2003; Sánchez et al. 2007). This coordination, or integration, of morphological traits implies a strong relationship among the traits that is conditional and mutually informative about patterns of variability and not merely a correlate (Magwene 2001). Modularity refers to the tendency of different sets of branch traits to vary in a coordinated way (Klingenberg 2008, 2014). Thus, characteristics of corals are consistent with the modular concept of phenotypic plasticity seen in plants (de Kroon et al. 2005) in that whole-organism plasticity is the sum of all modular responses triggered by environmental conditions, plus all interaction effects among modules due to the coordination of traits. However, little is known about the effects of modularity in the morphology of scleractinian corals in natural populations. Differences in skeletal morphology of corals can also be attributed to the disruption of gene flow between populations (Carlon and Budd 2002; Prada et al. 2008). Thus, plastic responses to environmental variation and genetic divergence may occur simultaneously to mold colonial morphology (Mass and Genin 2008; Prada et al. 2008; Todd 2008), making the interpretation of morphological variation and identification of species challenging. Pocillopora corals illustrate just how challenging the interpretation of morphological variation and species delimitation can be. Members of this genus are widely
13
distributed, ranging from the Red Sea, across the Indian and Pacific Oceans to the Eastern Tropical Pacific (Glynn and Ault 2000; Veron 2000). In the Eastern Tropical Pacific, these corals are found in shallow waters (depth 1–8 m) and are the most important reef-builders in this environment—yet they show a high variation in colony morphology (Glynn and Ault 2000). The identification of species belonging to this genus has been based mainly on the skeletal morphology of the colony, shape and size of the branches and verrucae, and corallite features (Veron and Pichon 1976; Glynn 1999; Veron 2000, 2002). However, studies that included transplants (Nakamura and Yamasaki 2006; Mass and Genin 2008) and growth simulations (Kaandorp 1999; Chindapol et al. 2013) have shown that Pocillopora corals have the capacity to produce different morphologies in response to water flow. In particular, branches of Pocillopora species are thick and compact in habitats exposed to high-flow velocities and thinner and wider under low-flow velocities (Kaandorp 1999; Nakamura and Yamasaki 2006). One possible explanation of these different trait morphologies is that the modifications may be morphological responses of the coral to decrease drag and prevent breakage at high-flow velocities. Under low-flow conditions, thin but wide branches induce turbulence, thereby enhancing the mass transport of nutrients (Chamberlain and Graus 1975; Kaandorp 1999; Einbinder et al. 2009; Filatov et al. 2010). Water flow is not only a critical factor in determining the mechanical aspects of colonial morphology, but it also influences the ability of polyps to capture particles (Sebens et al. 1998) and exchange gas (Sebens et al. 2003; Finelli et al. 2007), and it affects uptake rates (Falter et al. 2004), which in turn affect respiration, photosynthesis, and growth (Finelli et al. 2007; Mass et al. 2010; Schutter et al. 2011) and might also determine susceptibility to bleaching (Nakamura and Yamasaki 2005). Thus, water flow is one of the most important environmental factors influencing the morphology of Pocillopora corals throughout the Eastern Tropical Pacific. Pocillopora species have been delimited morphologically using numerical taxonomy in Hawaii (Powers 1970; Powers and Rohlf 1972) and Colombia (Cantera et al. 1989), and by morphometric analysis in the Galapagos (Budd 1990). Based on their results, these authors were able to distinguish P. damicornis, P. capitata, and a group composed of P. elegans–P. eydouxi in the Eastern Tropical Pacific (Cantera et al. 1989; Budd 1990); in Hawaii, P. damicornis, P. meandrina, and P. lingulata were morphologically differentiated (Powers 1970; Powers and Rohlf 1972). Taxonomic studies have likewise described morphological variation in both recognized species (Veron and Pichon 1976; Veron 2000; Ketchum and Reyes-Bonilla 2001) and novel species (Glynn 1999; Veron 2002), although the authors expressed some uncertainty about
Oecologia
lifo rn ia
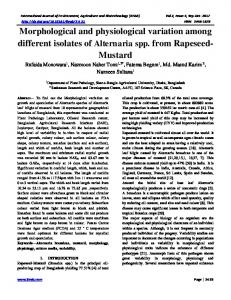
Two coral communities located the southwestern part of the Gulf of California (Fig. 1) were chosen for study because they are exposed to different flow conditions. The coral community at Isla Gaviotas (24°17.187′N, 110°20.382′W) is exposed to slow currents. The structure of the main reef, composed of Pocillopora, Porites, and Pavona corals, is heterogeneous, with patches of sand as substrate. In contrast, the coral community at Punta Galeras (24°21.276′N,
24°25'N
Ca
Study sites and water flow
of
Materials and methods
Mexico lf Gu
whether some members of the Pocillopora were synonymous (Reyes-Bonilla 1992; Glynn and Ault 2000). Genetic studies have reached contrasting results, sparking debate over the validity of Pocillopora morphospecies. Eco-morphs (morphological variants of one morphospecies induced by environmental gradients; Veron and Pichon 1976) of P. damicornis have been separated into five distinct genetic lineages in Eastern Australia and two in East Africa (Souter 2010; Schmidt-Roach et al. 2013). Other studies demonstrated congruence between some genetic lineages and morphological data, such as colonial morphology (Flot et al. 2008) and corallite features (Marti-Puig et al. 2014) in Hawaii, but no association between genetic lineage and morphology in the Western Indian Ocean (Pinzón et al. 2013). In the Eastern Tropical Pacific, three genetic lineages (designated Pocillopora type 1, 2, and 3, respectively) have been distinguished among five Pocillopora morphospecies (P. damicornis, P. verrucosa, P. meandrina, P. capitata, and P. eydouxi) using mitochondrial sequences, microsatellite data, and internal transcribed spacer 2 (ITS2) sequences (Pinzón and LaJeunesse 2011). The most common host group, Pocillopora type 1, displays an association with two Symbiodinium types (C1b-c and D1; Pettay et al. 2011, McGinley et al. 2012), shows high levels of morphological variability, and may include all Pocillopora morphospecies in the Gulf of California (Pinzón and LaJeunesse 2011). Thus, Pocillopora morphospecies may represent plastic responses to environmental conditions that vary over the Eastern Tropical Pacific. The aims of our study were to test whether three Pocillopora type 1 morphospecies (P. damicornis, P. verrucosa, and P. meandrina) correspond to a pattern of morphological variation between different water-flow conditions in two coral communities in the Gulf of California and to determine whether the morphological differentiation among morphospecies is related to the tendency of different sets of branch traits to vary in a coordinated way (i.e., branch modularity).
High flow site (Punta Galeras) 24°20'N
Low flow site (Isla Gaviotas)
24°15'N
6 km
110°20'W
110°15'W
110°10'W
Pocillopora type 1 morphospecies
P. damicornis
P. verrucosa
P. meandrina
Fig. 1 Location of low-flow (Isla Gaviotas) and high-flow (Punta Galeras) sites and the Pocillopora type 1 morphospecies analyzed in the southwestern part of the Gulf of California
110°17.100′W) is exposed to strong wave action. The structure of main reef here is more homogeneous and is rarely interrupted by sand channels (Paz-García and ReyesBonilla 2006; Pinzón et al. 2012). Two methods were used to estimate the differences in water flow between sites: rate of dissolution of gypsum and rate of dye release. The rate of dissolution of gypsum provides an integrated measure of water flow, and even though it is affected by currents, wave orbital motion, and turbulence, it is a reasonable proxy for differences in mass transfer between sites (Muus 1968; Porter et al. 2000). Gypsum molds were made by mixing 100 g gypsum with 200 ml water, pouring the slurry into a conical frustum mold, and air-drying the mold until a constant weight was reached. The molds were then glued to acrylic plates with silicon and weighed; each clod card weighed 173 g [standard error (SE) ± 3.5 g]. Nine molds were deployed at each site on the same day and retrieved after five days during the winter (February 2013). Weight loss per day for each block was calculated and after log-transformation, mean values were compared between sites using the Student’s t test. In the second approach, water flow was estimated using dye release (Chamberlain and Graus 1975) along a parallel coast transect of 45 m. In total, 50–100 ml of alizarin red dye (0.8 mg mL−1) was released from a plastic bottle at
13
Oecologia Table 1 List of the Pocillopora morphospecies examined in this study and mitochondrial genetic identity Pocillopora morphospecies
N
Pocillopora ORF genetic identitya
Pocillopora CR genetic identitya
References
P. damicornis
30
Pocillopora type Pocillopora sp. A 1 (n = 4, KF985974, KF985977) (n = 5, KF985967, KF985970)
This study
P. verrucosa
60
Pocillopora type Pocillopora sp. A 1 (n = 6, KF985975, KF985978) (n = 6, KF985968, KF985971)
This study
P. meandrina
30
Pocillopora type Pocillopora sp. A (n = 10, KF985969, 1 (n = 4, KF985976, KF985979) KF985972)
This study
Pocillopora
meandrina (EU374245)
meandrina (EU374279)
Flot et al. (2008)
Pocillopora
eydouxi (EF526303) Sp. A (FR729416)
Flot et al. (2008)
Pocillopora
eydouxi (EU374254) Sp. A (FR729326)
Pocillopora
Type 1 (HQ378758)
–
Pinzón and LaJeunesse (2011)
Pocillopora
meandrina (JX985610)
meandrina (JX625104)
Schmidt-Roach et al. (2013)
Pocillopora
Clade IIb (KF583934)
–
Marti-Puig et al. (2014)
Flot et al. (2010)
N, Number of samples used in morphometric analysis a The Pocillopora open reading frame (ORF) and control region (CR) identity, with the GenBank accession number in parenthesis (n, number of colonies used for determining genetic identity)
1-m intervals along the entire transect. Dye measurements were taken in summer (June 2011) and winter (February 2013) during periods of similar tidal cycles. A total of 180 digital videos at 30 frames per second were recorded (90 videos per site). These videos were analyzed using ImageJ 1.34 software (http://rsb.info.nih.gov/ij/) and MtrackJ software (Meijering et al. 2012) to estimate the speed of water flow at a height of 5–10 cm above the coral colonies (Chamberlain and Graus 1975). The distances recorded in the videos were calibrated using a grid of known dimensions. Elapsed times were measured using the frame rate of the camera. After log-transformation, mean water flow between sites was compared using a two-factor (site × season) analysis of variance (ANOVA). Post-hoc Tukey tests were used to evaluate significant pairwise differences after ANOVA. Collection and identification of morphospecies We collected 595 fragments from 119 colonies of Pocillopora damicornis (n = 30), P. verrucosa (n = 60), and P. meandrina (n = 30) morphospecies between March and August 2011 (Fig. 1). Five fragments (approx. 5 cm long from the tip) were collected from each colony for characterizing morphological variation. Samples were taken at random from different areas of each colony. The fragments were cleaned with 10 % sodium hypochlorite, rinsed in freshwater, and air-dried at room temperature. One small fragment (length 1–3 cm) was collected from the center of each colony and preserved in absolute ethanol for molecular analysis. Each specimen was identified to species level according to taxonomic descriptions based on skeleton morphology (Veron and Pichon 1976; Veron 2000;
13
Ketchum and Reyes-Bonilla 2001). The identification of species based on the underwater pictures was confirmed by taxonomic experts (see “Acknowledgments”). Genetic lineage identity Genomic DNA was extracted using the protocol of LaJeunesse et al. (2003) and the specifications reported by Pinzón and LaJeunesse (2011). Previous studies using the mitochondrial open reading frame (ORF) indicated that all Pocillopora corals present at Isla Gaviotas and Punta Galeras belong to the Pocillopora type 1 genetic lineage (Pinzón and LaJeunesse 2011; Pinzón et al. 2012). To verify the genetic lineage, we selected 35 colonies representing the three morphospecies (Fig. 1) and amplified the mitochondrial ORF and control region (CR) based on previously published conserved regions from the coral host (Flot et al. 2008, 2010). We developed a new primer using Primer3Web (http://primer3.ut.ee; Untergasser et al. 2012) which amplified a 913-bp fragment: FNC6 (5′-TGG TTG ATG AAT AAG ACA GTT C-3′) and RNC6 (5′-CAC CCA TCG AGT TCA ATA A-3′). PCR products were purified and sequenced at a contract research institute (Genewiz, South Plainfield, NJ), and the sequences were edited with Chromas Pro 1.49 beta (Technelysium, Brisbane, Australia). The sequences of the mitochondrial (ORF and CR) morphospecies (Table 1) and those of Pocillopora genetic lineages from previous studies (Flot et al. 2010; Pinzón and LaJeunesse 2011; Schmidt-Roach et al. 2013; Marti-Puig et al. 2014), available on the NCBI database GenBank (Table 1), were aligned and compared with Mega 5 software (Tamura et al. 2011) using the Clustal W application (Thompson et al. 1994).
Modified from Chamberlain and Graus (1975); Einbinder et al. (2009) Collected fragment
Average of maximum and minimum linear distance of the distal portion of the branch
Average of maximum and minimum branch diameter measured 2 cm below the distal portion of the branch
Average of the ratio of the number of sub-branches to the maximum 5 Branches (counts and 5 linear longitude of the collected fragment (length 5 cm). Values measurements) close to 0 indicate a low number of sub-branches per centimeter of longitude of the ramification, while values close to 1 indicate a high number of sub-branches. Only skeletal extensions longer than 2 cm were considered to be a sub-branch
Distal portion of the branch (DpB)
Branch diameter (BrD)
Sub-branching rate (Sbr)
5 Branches (10 measurements)
Average of 4 linear distances between margins of a selected branch Distance among branches (AdB)
5 Branches (10 measurements)
1 Square Number of whole branches within a 20-cm2 square placed on the center of each colony Branch density (Bd)
5 Selected branches (20 measurements)
Sampling per colony
Modularity of traits within Pocillopora morphospecies and between flow conditions were addressed using a graphical modeling approach that incorporates tests of conditional independence between traits and independence graphs (Magwene 2001). Third-order partial correlation coefficients (PCC) of log-transformed data were calculated. A
Description
Phenotypic modularity
Morphometric trait (abbreviation)
The mean and SE of the traits were calculated for each morphospecies after first calculating mean values for each colony among the five branch replicates. Data were logtransformed to meet the assumptions of normality (the Kolmogorov–Smirnov test) and homogeneity of variances (Levene test). Two-way ANOVA was used to identify differences in morphological variation attributable to flow conditions (low-flow rate sites vs. high-flow rate sites) and morphospecies identity. A post hoc comparison of means was tested using Tukey’s HSD for unequal number of samples when a significant effect was found. The Bonferroni correction was applied to multiple comparisons. Morphological patterns in individual traits was verified according to statistical differences found in ANOVA for individual traits among morphospecies and by Student’s t test (differences of traits between sites in each morphospecies; see ESM). To compare the pattern of variation and test whether morphological differences in Pocillopora type 1 morphospecies remain within each environmental condition, we performed a canonical discriminant analysis among morphospecies per site (3 morphospecies × 2 sites, given a total of 6 groups for the analysis). All statistical analyses were performed with Statistical 7 software (StatSoft, Tulsa, OK).
Table 2 List of morphological traits averaged from five branches of colonies of Pocillopora corals
Patterns of morphological variation
Count and calculated
Shaish et al. (2007)
Modified from Stefani et al. (2008) Collected fragment Millimeters
Picture from field
This study Picture from field
Picture from field Millimeters
Unit
Measurement method
To characterize variation in morphology, we focused on five branch traits [Table 2; Electronic Supplementary Material (ESM) Fig. S1] that have been used in previous studies to identify morphospecies, water flow characteristics, and hydro-mechanical adaptations in the family Pocilloporidae (Chamberlain and Graus 1975; Shaish et al. 2007; Stefani et al. 2008; Einbinder et al. 2009). Morphological traits were measured from the collected fragments and from photographs (see Table 2). Measurements were performed with a dial caliper (±0.1 mm), while ImageJ 1.34 software was used on the photographs. Images were calibrated with a grid of known dimensions.
Count
References
Data acquisition
Millimeters
Morphometrics
Modified from Shaish et al. (2007)
Oecologia
13
Oecologia
single third-order PCC was estimated for each set of two variables, controlling for the remaining three variables. PCCs were compared statistically for edge exclusion deviance to determine which of the relationships between traits was coordinated in the model. Edge strength was used to detect the differences between strong and weak coordination. The graphic model was constructed for each morphospecies × flow condition (6 different models in total). This graphic model allows the differences in phenotypic modularity of the traits under study to be visualized, where traits are represented by nodes and lines represent extant coordination among traits. High or low modularity will depend on the number of trait connections (lines) in each graphical model.
Results Water flow The two sites differed in water flow, as evidenced by significant differences in mean weight loss per day in gypsum blocks (t16 = 15.266, p