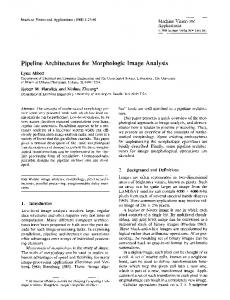
Géomorphologie : Relief, Processus, Environnement
Géo morphologie
revue en ligne : http://geomorphologie.revues.org/ vol. 23, n° 3 (2017), p. 187-202 Mise en ligne le 18 septembre 2017 sur Revues.org URL : http://geomorphologie.revues.org/11805 DOI:10.4000/geomorphologie.11805
RELIEF, PROCESSUS, ENVIRONNEMENT
© 2017 GFG Editions - Tous droits réservés
http://edytem.univ-savoie.fr/gfg/
Vegetation succession processes and luvial dynamics of a mobile temperate riparian ecosystem: the lower Allier River (France) Processus de succession végétale et dynamique luviale d’un écosystème riverain mobile en zone tempérée : le bas Allier (France) Virginia Garófano-Gómez *a,b,c, Meike Metz d, Gregory Egger d, María Díaz-Redondo e, Borbála Hortobágyi a,c, Gertjan Geerling f,g, Dov Corenblit a,c, Johannes Steiger a,c a
Université Clermont Auvergne, CNRS, GEOLAB – 63000 Clermont-Ferrand, France. Institut d’Investigació per a la Gestió Integrada de Zones Costaneres (IGIC), Universitat Politècnica de València – Paranimf 1, 46730 Grau de Gandia, València, Spain. LTER France, LTSER Zone Atelier Loire – 37000 Tours, France. d Institute of Floodplain Ecology, Institute of Geography and Geoecology, Karlsruhe Institute of Technology – Josefstrasse 1, 76437 Rastatt, Germany. e School of Engineering. University of Lisbon – Avenida Rovisco Pais 1, 1049-001 Lisboa, Portugal. f Deltares – Boussinesqweg 1, 2629 HV Delt, he Netherlands. g Institute for Science, Innovation and Society (ISIS), Faculty of Science, Radboud University – Heyendaalseweg 135, 6525 AJ, Nijmegen, he Netherlands.
b c
ABSTRACT Many riparian ecosystems in European temperate regions have lost their inherent, highly dynamic character due to human-induced impacts such as river channelization and low regulation. he lower course of the Allier River (France) is one of the last remaining free meandering river segments, and thus, constitutes an opportunity to investigate riparian succession processes of a dynamic, temperate river system. We analyzed (i) the dynamics of the succession phases based on eight sets of aerial images of the riparian corridor over the last ive decades (1967-2014), (ii) the dominant succession trajectories and (iii) their relation with the Allier River low regime. Results revealed that the study site was characterized by a shiting habitat mosaic between 1967 and 2005, whilst loods did not change the overall habitat composition of the riparian corridor but their distribution in space. Ater the year 2005, progression and retrogression processes have been drastically reduced, with an increase of stability (i.e. no more channel migration and neither progression nor retrogression of patches), and a concomitant reduction of high and moderate magnitude loods. his study depicts a clear threshold of trajectory change in succession processes since the beginning of the 21st century and facilitates a better understanding of future trajectories under current global climate change. Keywords: riparian vegetation, hydrogeomorphology, spatio-temporal processes, Allier River.
RÉSUMÉ ARTICLE INFORMATION Received 24 march 2017. Received in revised form 31 july 2017. Accepted 09 august 2017.
*Corresponding author. Tel: +33 4 73 34 68 43 E-mail addresses:
[email protected] (V. Garófano-Gómez)
[email protected] (M. Metz)
[email protected] (G. Egger)
[email protected] (M. Diaz-Redondo)
[email protected] (B. Hortobágyi)
[email protected] (G. Geerling)
[email protected] (D. Corenblit)
[email protected] (J. Steiger)
De nombreux écosystèmes riverains européens des régions tempérées ont perdu leur caractère intrinsèquement dynamique en raison de leur chenalisation et régulation des débits. Une partie du cours inférieur de la rivière Allier est considérée comme l’un des derniers secteurs luviatiles encore latéralement mobile. Ce secteur constitue donc une opportunité, à l’échelle européenne, pour étudier les processus naturels de succession végétale. Nous avons analysé (i) la dynamique de la succession végétale sur une période de 50 ans (1967-2014) à partir de huit jeux de photographies aériennes, (ii) les trajectoires de succession dominantes et (iii) leur relation avec le régime hydrologique. Nos résultats indiquent que la mosaïque d’habitats du site d’étude était très dynamique entre 1967 et 2005, mais que les crues n’ont pas transformé la composition globale des habitats au sein du corridor luvial, tout en modiiant néanmoins leur distribution spatiale. Après l’année 2005, les modalités de progression et de rétrogression ont été fortement réduites, avec une augmentation de la stabilité et une réduction concomitante des crues fortes et modérées. Cette étude met clairement en évidence un seuil critique de transition dans la trajectoire de succession végétale depuis le début du XXIe siècle et facilite la compréhension de futures trajectoires d’évolution de l’écosystème riverain dans le contexte actuel du changement climatique global. Mots-clés : végétation riveraine, hydrogéomorphologie, processus spatio-temporels, rivière Allier.
1. Introduction Natural riverine ecosystems are intimately tied to physical, chemical, and biological processes varying in both space and time. his confers a high dynamism and habitat heterogeneity making them one of the most biodiverse ecosystems in temperate
regions (Tockner and Stanford, 2002; Ward et al., 2002). Speciically, riparian and loodplain vegetation are subjected to multiple hydrogeomorphic constraints, namely climate, moisture availability and luvial disturbance (Gurnell et al., 2016), which determine the distribution of riparian and loodplain habitats (Steiger et al., 2005; Corenblit et al., 2007).
Virginia Garófano-Gómez et al.
In riverine ecosystems with a good conservation status, it is possible to identify a shiting habitat mosaic dynamism that fosters the aforementioned high biodiversity (Ward et al., 2002; Tockner et al., 2010) as the result of sediment erosion and deposition, exchanges between surface water and groundwater, and plant succession. his interaction also produces a high turnover rate of habitats and their spatial shit. However, the landscape pattern, i.e. the habitat balance of the riparian corridor, may remain stable over long periods of time: within a given riverine ecosystem, habitats change their distribution in space, but not their mutual proportions which remain unchanged or stable (Stanford et al., 2005; Mouw et al., 2013). In Europe, many river systems lost their inherent, highly dynamic character ater major human induced impacts, e.g. river training works and low regulation, which intensiied at least since the industrial revolution (Petts et al., 1989; Buijse et al., 2002). In addition to the hydrogeomorphological changes, riparian ecosystems have endured intensive groundwater pumping, land use change, eutrophication or chemical contamination (Nilsson and Berggren, 2000; Meybeck, 2003; Habersack et al., 2014). As a consequence, these alterations have oten led to a simpliication of habitats and hence to a signiicant decrease in species diversity (Trémolières et al., 1998; Deiller et al., 2001; Leyer, 2005; Hupp and Rinaldi, 2007), although in some cases the opposite has been observed (Ceschin et al., 2015; Dufour et al., 2015). In this sense, and even though pristine, unimpacted riverine ecosystems do not exist anymore in Europe, the last remaining low impacted and highly dynamic riparian ecosystems constitute a rare opportunity to investigate natural / semi-natural riparian vegetation succession processes to produce guidelines for restoring altered riparian ecosystems (Gurnell and Petts, 2002). In the European context, the Allier River (France) is one of the last remaining unregulated rivers with highly dynamic meandering sections and bank erosion, which represents an opportunity to investigate riparian vegetation succession processes of a dynamic, temperate riverine system adjusting to current climate and catchment conditions (Van Looy et al., 2008). Geerling et al. (2006) carried out a multi-spatiotemporal study covering a period of 46 years (1954-2000) in a 6-km dynamic channel-loodplain reach of the Allier River, south of Moulins (France), and suggested the applicability of the “shiting mosaic steady-state” model (Bormann and Likens, 1979) for the second half of the 20th century. Since this study, almost two decades ago, climate change has caused the increase of global temperatures and an increase in drought severity in the southern half of France (Giuntoli et al., 2013). It is widely recognized now, that the impact of climate change on loodplain inundation is induced on the one hand by increasing temperatures and on the other hand by spatial and temporal changes in precipitation patterns, and that climate change has an impact on the hydrogeomorphological regime of rivers, and as such can inluence the spatial arrangement of loodplain vegetation and related plant succession dynamics (Schneider et al., 2011). he impacts of climate change on the hydrological regime of the Loire River and its tributaries (e.g. Allier River) during the 21st century were investigated by two French research projects, the ICC-Hydroqual (Moatar et al., 2010) and Explore 2070 (Chauveau et al., 2013). heir results project for the lower Allier River (i) an increase in low low severity during the summer period as well as the duration of low low periods (Moatar et al., 2010); (ii) an important decrease of mean annual loods from the mid-21st century on (Moatar et al., 2010); (iii) a decline by 10% of higher peak lows (10-yr recurrence interval lood; Van Looy and Pifady, 2017); and (iv) an increase of severe loods (extreme, low frequency loods; Van Looy and Pifady, 2017). However, according to Moatar et al. (2010), uncertainties remain
188
about the evolution of extreme rain and lood events. he aim of our research was to study recent (last two decades) plant succession dynamics in relation to observed lood regime changes, based on the baseline study by Geerling et al. (2006) and focusing on a sub-reach of the 6-km stretch studied by Geerling et al. (2006). We hypothesised that ater the year 2000, in relation with the low regime change, (i) a shit in the habitat mosaic has taken place, but that (ii) the study site remained within a “shiting mosaic steady-state”. We also asked the explicit question if this dynamic and relatively low impacted study reach qualiies as a reference of natural plant succession processes in riverine ecosystems. To achieve this, we (i) interpreted the current landscape mosaic and riparian successional pathways based on a large-scale ield survey; (ii) analysed the changes in the spatial distribution of succession phases and succession trajectories based on a set of eight aerial images spanning 47 years (1967-2014); (iii) related plant succession processes, contemporary and historical discharge time series and observed channel changes to interpret observed spatio-temporal patterns of the landscape mosaic.
2. Study site From its source at 1,485 m a.s.l. in Lozère in the Massif Central, southeast France, the Allier River lows 421 km north until joining the Loire River at the Bec d’Allier conluence (167 m a.s.l.; total catchment area: 14,350 km²) (ig. 1). Its overall climate domain is oceanic temperate - Cb Köppen-Geiger type (Peel et al., 2007), with a mean annual temperature of 11.4ºC and a mean total annual rainfall of 779 mm (Vichy station - Météo France). he pluvial discharge regime of the Allier River has historically been irregular due to its strong intra- and inter-annual variability (Onde, 1923). Sporadically, it can result in severe low water levels during summer, as well as catastrophic loods, which generally occur during winter or spring. High magnitude loods oten result from the superposition of a Mediterranean “cévenole” storm from the southeast (upper basin) and a westerly oceanic storm coming in from the Atlantic coast. hese “mixed loods” can give rise to the strongest loods in Western Europe (Gautier et al., 2000; FRANE, 2014). Two dams located in the upper basin partially afect the discharge: Poutès (constructed in 1941; height: 18 m, length: 85 m) and Naussac (operational since 1983; height: 50 m, length: 240 m), which mainly store water in winter to support low summer lows. hese dams have no regulating efect on large lood events, and probably neither during high low periods (DREAL, pers. comm.; FRANE, 2014). he lood regime of the Allier River is therefore considered as close to natural or unregulated. he study reach (3.7 km long and 0.5-1.5 km wide) is located 8 km south and upstream of the town of Moulins (ig. 1), in the most mobile meandering section of the lower course of the Allier River, where speciic annual bank erosion area rates of up to 10 m².m-¹ have been observed (Hortobágyi et al., in press). Its average altitude is 210 m a.s.l. and its mean annual discharge is 135 m³.s-¹ (Banque Hydro). he reach is part of the Réserve Naturelle Nationale du Val d’Allier (http://www.reserves-naturelles.org/val-d-allier), protected since 1994 for its natural patrimony. It is considered as one of the last highly mobile river sections in Europe, making its preservation a key issue for regional and national authorities (Cournez, 2015).
Géomorphologie : relief, processus, environnement, 2017, vol. 23, n° 3, p. 187-202
Fluvial and biological dynamics
Fig. 1 – Location of the study reach within the Allier River Basin, near the French town of Moulins (A). he red line indicates the study area covered by the vegetation mapping (B). Aerial image from July 2013 (source: CRAIG – Centre Régional Auvergnat de l’Information Géographique). he spatial reference is represented by geographic coordinates (latitude / longitude in degrees) relative to the WGS84 datum.
Fig. 1 – Localisation du tronçon d’étude dans le bassin versant de la rivière Allier, en amont de la ville de Moulins, France (A). Le trait rouge indique la zone d’étude couverte par la cartographie de la végétation (B). Image aérienne de juillet 2013 (source : CRAIG – Centre Régional Auvergnat de l’Information Géographique). La référence spatiale est représentée par des coordonnées géographiques (latitude / longitude en degrés) par rapport au système de référence géodésique WGS-84.
3. Materials and methods 3.1. Changes in succession phases assessed from aerial images and ield vegetation mapping he study area (376 ha) was deined encompassing the maximum lateral and longitudinal extension that the near-natural riparian and loodplain vegetation has covered during the considered study period (see red line in ig. 1). Based on the most recent and high-quality aerial image (CRAIG – Centre Régional Auvergnat de l’Information Géographique; date: 7/2013, spatial resolution 0.25 m × 0.25 m) the vegetation within the study area was mapped in early autumn 2014. he early autumn (end of the vegetative period) was considered appropriate to map natural and non-natural vegetation types in the ield, since no detailed lora inventories were carried out but an identiication of the most dominant species within the patches. he area-wide vegetation mapping (Egger et al., 2015; Muñoz-Mas et al., 2017) was carried out at the meso-habitat scale 1:2,000. First, homogeneous polygons (patches or landscape units) were identiied on the aerial images from 2013 as a irst reference and then these polygons were checked in the ield in 2014 and assigned to a certain succession phase. In total, 256 patches were digitised and 90% of them were checked in the ield. he minimum patch size was 52 m². For more information about the ield survey see Metz (2015). Eight sets of aerial images covering a total time span of 47 years (1967, 1978, 1983, 1985, 2000, 2005, 2010 and the aforementioned map obtained in 2014 from the ield survey) were used to assess spatio-temporal changes in the landscape mosaic (i.e. succession phases and trajectories). his historical evaluation was based on maps already photo-interpreted by Geerling et al. (2006), unpublished data (Rackusch, 2014; Schwarzmeier, 2015), and the DREAL (2014) – see these references for detailed information about the photo series and their characteristics. In general, the photographic scale varied between 1:14,500 and 1:25,000 and their original photo resolution between 0.25 m and 1 m. Images before 1985 were in black and white and ater 2000 in true-colour. All aerial images were taken in the summer (July / August). herefore, we decided to divide years from August 1st to July 31st, because this data partition provides a better characterization of the hydrological conditions experienced
by the vegetation mosaic illustrated in the most recent image of each period under comparison. To minimise errors, the most recent map (i.e. 2014) was produced irst and then used as a basis to improve the recognition of the diferent phases on the majority of the older maps. he identiied patches of the diferent maps were classiied into seven succession phases based on the colour, texture, density and vertical structure of the vegetation. hese phases were: WA (water), BS (bare soil; mainly open gravel and sand bars with vegetation ground cover lower than 5%), PP (pioneer phase; young, sparse vegetation with a ruderal, stress tolerant and disturbance-adapted strategy, like Salicaceae with a vegetation ground cover ~25% and ~0.5 m high), HP (herb phase; patches composed by annual and biannual short-lived herbs, reed and grassland which can also contain scattered woody pioneer individuals with a vegetation ground cover >25% and less than 1 m high), SP (shrub phase; woody herbs like Poa pratensis L. or Hypericum perforatum L., and small patchy Prunus sp., Crataegus sp. and Salicaceae shrubs and trees, which may strongly interact with low and sediment dynamics, with a canopy ground cover less or equal to 60% and generally less than 5 m high), FP (forest phase; dense woody canopy ground cover, typically higher than 60% and vegetation over 5 m high), and AGRI (agricultural land). In subsequent analyses, the phases WA and BS are considered together as they represent the highly low-disturbed active tract where vegetation cannot establish, and their respective areas depend on the low stage when the aerial photos were taken. In order to analyse the correspondence between the diferent succession phases across time, a 7 × 8 contingency table between the seven succession phases (rows) and the eight year-maps (columns) was created based on the area information extracted from the vector maps. A Pearson’s chi-squared test of independence was used to identify whether there was a signiicant association between phases and time. A mosaic plot was created to display graphically the contingency table with the R package graphics (R Core Team, 2016). In a mosaic plot, the height of each rectangle or “tile” is proportional to the cell frequency, in our case, to the area covered by each phase within the study area in each year-map. A tile with a solid border indicates that the value is higher than that expected under the null hypothesis of independence between phases and year-maps. Conversely, a tile with a dashed border indicates that the area of
Géomorphologie : relief, processus, environnement, 2017, vol. 23, n° 3, p. 187-202
189
Virginia Garófano-Gómez et al.
that phase is smaller than that expected from random association. Under the null hypothesis of independence, all the tiles are white. he colour code is used to outline the most salient deviations, represented by the magnitude of their standardized Pearson’s chisquared residuals (Friendly, 1994). A standardized residual of –2 or less indicates that the cell’s observed frequency is signiicantly lower than its expected frequency (in shaded red), and a standardized residual of +2 or more indicates that the cell’s observed frequency is signiicantly higher than its expected frequency (in shaded blue).
3.2. Changes in succession processes assessed from raster layers Vector layers were converted to 5-m resolution raster layers depicting the seven succession phases using ArcGIS v. 10.3 (ESRI, Redlands, CA, USA, 2014). his pixel size (5 m × 5 m) was considered appropriate from a computational point of view, but also in terms of patches’ spatial accuracy, ensuring at the same time the compatibility between the diferent available maps. he raster maps were overlain chronologically, obtaining confusion matrices from them. hese matrices quantify the detailed changes (“cell-by-cell comparison”) between succession phases from one image to the next, and resulted in seven periods of time for comparison (i.e. 1967-1978, 1978-1983, etc.). Based on these confusion matrices and following Diaz-Redondo et al. (2017), the dominant succession processes were deined and grouped into four trajectories of change. hese were progression (prevailing trajectory onwards; involves vegetation growth), retrogression (prevailing trajectory backwards; involves resetting of phases like the destruction of vegetation by lateral channel erosion and sediment deposition on point bars and within side channels which buries vegetation), stability (changeless) and anthropization (change from a natural cover to cultivation or urbanization by human action). he process assigned to each step was supposed to be dominant for that speciic period, without knowing exactly what happened in the time in between (classes a and b denote diferent velocities in natural succession phases). All processes were subdivided into more detailed sub-processes depending on the initial and inal succession phases identiied from the two maps under comparison. For example, three subprocesses were deined within progression depending on the geomorphological processes and developmental stage of vegetation. hese were “initial-aggradation”, “colonization” (progressing to pioneer and/or herbs) and “transition” (progression to shrub and/or forest). he change from cultivated land to herb, shrub or forest phase was also considered as a form of progression (classes c of the abovementioned sub-processes), linked to a decrease of luvial dynamics. Before the decrease in the low and lood regime, cultivated areas close to the river banks were eroded more easily, incorporated into the active tract and rapidly colonized by riparian vegetation. Within a retrogression trajectory, “channel-shit” or “initial-aggradation” were considered as complete forms of retrogression, and thus “partial retrogression” was reserved exclusively to the retrogression of natural phases to less developed vegetal formations. Ratios between total progression, retrogression and stability were calculated for each time period to detect trends, as well as the most dynamic periods. However, in order to compare between them at the level of speciic succession processes, the raw data was standardized into a rate (ha.yr-¹) as the seven time periods difered in length (from 2 to 15 years). A hierarchical cluster analysis (average linkage method and Euclidean distance) was carried out with the R packages stats and graphics (R Core Team, 2016) to analyse how the diferent periods of time diferentiated concerning their trajectories of change and
190
associated processes. In this sense, the standardized data allowed to summarize the diferent periods into groups with a similar pattern. Statistical comparisons between each one of the succession processes for the resultant groups of time periods were done using the robust Welch one-way ANOVA (Wilcox, 2012), implemented in the R package WRS (Wilcox and Schönbrodt, 2014). his robust analysis of variance uses a generalization of Welch’s method. It was chosen since it can be applied to examine groups of unequal and small sizes and does not require the assumption of homoscedasticity and normally distributed samples. If the null hypothesis (H0) holds, this means that there is no statistical diference in the means between the compared groups. H0 was rejected for high values of the statistic Fwe, which follows a Snedecor’s F-distribution if H0 is true. Raw p-values were adjusted using the correction proposed by Benjamini and Hochberg (1995), and implemented in the R package stats (R Core Team, 2016). his correction attempts to limit the probability of false discoveries (i.e. incorrectly rejecting the null hypothesis when there is no real efect) when multiple comparisons are involved. We focused our attention to p-values ≤ 0.10 as results approaching signiicance, due to our small sampling sizes.
3.3. River discharges and characterization Discharge records for the period 1968-2014 were obtained from the gauging station at Moulins (source: Banque Hydro, station code K3450810). For the missing periods at Moulins (1967-1968, 1993, 1997 and 2006) discharge data was reconstructed using a regression (y = 0.8499x + 9.8357; R² = 0.9267) based on the Moulins time series and the one recorded at the station at Cufy (code K3650810; ~55 km downstream from Moulins) since no important tributaries are located between both stations (ig. 2). Certain discharges and their associated characteristics, such as magnitude, frequency, duration, timing and rate of change (Pof et al., 1997) are needed to create disturbance and maintain the structural elements that provide the basis for biodiversity in aquatic and riparian habitats (Stanford et al., 1996; Richter et al., 1997). In this study, we deined critical discharge thresholds for maintaining channel and loodplain form and function as the double of the mean annual discharge (Emil Dister, pers. comm.; 2MQ: 270 m³.s-¹). Further characteristic loods are: HQ2 (2-yr recurrence interval lood: 669 m³.s-¹), HQ5 (5-yr recurrence interval lood: 937 m³.s-¹), HQ10 (10-yr recurrence interval lood: 1,110 m³.s-¹) and HQ20 (20-yr recurrence interval lood: 1,280 m³.s-¹). hese values were calculated with a Gumbel law over a series of 47 years (source: Banque Hydro). Using the reconstructed and recorded discharge series at Moulins (1967-2014), two variables were calculated: irst, the mean number of independent lood events per year above the discharge thresholds; and second, the mean number of total accumulated days (not continuous) per year when discharge exceeded the diferent thresholds. Both hydrological variables, mean frequency and duration, were calculated for each one of the seven time periods (ig. 2). Two successive lood events were considered independent if the time interval between them was at least 5 days, following Svensson et al. (2005). his separation, dependent of the catchment area, generally allows for the low to recede appreciably between peaks.
3.4. Relation between trajectories of change and hydrology A bivariate Spearman’s rho rank-order correlation was performed with the R package Hmisc (Harrell Jr, 2016) to ind out how the trajectories of change and associated succession processes were
Géomorphologie : relief, processus, environnement, 2017, vol. 23, n° 3, p. 187-202
Fluvial and biological dynamics
Fig. 2 – Mean daily discharge data of the Allier River at the gauging station of Moulins: recorded for the period 1968-2014 and reconstructed from discharge data recorded at the Cufy station for the missing periods at Moulins (source: Banque Hydro).
Fig. 2 – Débits moyens journaliers de la rivière Allier à la station hydrologique de Moulins enregistrés pour la période 1968-2014 et reconstruits à partir de la station de Cufy pour les périodes manquantes à Moulins (source : Banque Hydro).
he mean frequency of independent lood events and duration of lood days per year in each period are indicated for the diferent critical discharge thresholds (numbers indicated at the let and right of each cell, respectively). he discharge thresholds correspond to the double of the mean annual discharge (2MQ: 270 m³.s-¹), 2-yr recurrence interval lood (HQ2: 669 m³.s-¹), 5-yr recurrence interval lood (HQ5: 937 m³.s-¹), 10-yr recurrence interval lood (HQ10: 1,110 m³.s-¹) and 20-yr recurrence interval lood (HQ20: 1,280 m³.s-¹). Time intervals are framed between aerial images and the years are deined from August 1st to July 31st.
La fréquence moyenne des crues indépendantes les unes des autres et la durée d’inondation annuelle (en nombre de jours) pour chaque période sont indiquées pour les diférents seuils critiques de débits (nombres indiqués respectivement à gauche et à droite de chaque cellule). Les seuils de débits correspondent au double du débit annuel moyen (2MQ : 270 m³/s), et aux crues avec la période de retour de 2 ans (HQ2 : 669 m³/s), de 5 ans (HQ5 : 937 m³/s), de 10 ans (HQ10 : 1 110 m³/s) et de 20 ans (HQ20 : 1 280 m³/s). Les intervalles de temps sont encadrés entre les photographies aériennes. Les années couvrent la période du 1er août au 31 juillet.
correlated with the diferent lood frequencies and duration (ig. 2). Human-afected transitions (any phase -> agricultural land) were discarded for this analysis.
islands and benches), also with S. alba and S. purpurea in smaller proportions. If poplars do not recruit, those habitats are occupied by grassland. White willow forests, located in silted side channels, are looded over long periods. hose locations are rich in nutrients and characterized by wet soil conditions (wet series). All series, although with relatively diferent species’ assemblages, may potentially evolve towards a post-pioneer mixed-forest, composed by a combination of woody and long-lived riparian (willow-poplar) and terrestrial (oakelm-Robinia) arboreal species. However, only small patches in this mature stage were found in the study area.
4. Results 4.1. Interpretation of current landscape mosaic and successional pathways he ield survey conducted in 2014 covered 329 ha and provided a baseline to understand the ecology of the riverine ecosystem of the Allier River (ig. 3) and accordingly, to deine a successional pathways scheme (ig. 4). Bare soil (5% of the mapped area) and pioneer (4%) succession phases mostly appeared in the river banks. Grasslands were broadly distributed within the study area (29%). In locations elevated above the channel dominated riparian forest (14%), composed mainly of black poplar (Populus nigra). White willow (Salix alba) forests appeared mostly restricted to silted side channels (3%). Prunus-Crataegus shrubs (11%) constituted the intermediate stage between (partly pastured) grassland and hardwood forest (6%). Depending on the habitat conditions, three successional pathways (dry, fresh and wet) were interpreted (ig. 4). he Allier River deposits gravel near the river banks at point bars during loods. hese gravelly and highly draining areas are extremely dry, especially in summer (dry series). For that reason, pioneer patches remain open for long periods and are irst colonized by Sedum sp. and dry grassland species, such as Corynephorus canescens. In this kind of conditions, P. nigra is one of those few riparian tree species that can establish by suckers, a form of clonal propagation (Corenblit et al., 2014). On bars covered with moist and iner substrate like sand and silt (fresh series), either grasslands or P. nigra establish. If recruitment conditions are favourable (open and moist habitats), P. nigra establishes along dense linear strips or within patches close to the channel (pioneer
4.2. Changes in the distribution of succession phases Over the majority of the 5-decade period (mainly before the year 2000) the Allier River at the study site has been characterized by a constant displacement of its channel and a change in the spatial array of succession phases (ig. 5). he correspondence between the succession phases across time was found to be signiicantly positive (chi-squared = 99.64, df = 42, p-value SP) and transition 2c (AGRI -> FP) were also signiicant, showing a decreasing trend ater 2005. here were no statistical signiicant diferences in total mean rate values of progression and retrogression trajectories (~15 and 10 ha.yr-¹, respectively for the entire study period 1967-2014). However, relevant signiicant diferences were found in stability, whose values ater 2005 doubled those observed before 2005, passing from 20 to 50 ha.yr-¹ of new natural areas stabilized. In addition, cultivation virtually disappears ater 2005, denoting that no new areas are transformed into cultivated land (ig. 6, 7).
4.4. Relation between trajectories of change and hydrology Spearman’s rho test revealed positive tendencies for all the signiicant correlations between succession processes and Succession phases / Phases de succession
Fig. 5 – Spatial distribution of the seven succession phases in the study site at the Allier River over the last ive decades (1967-2014). For colour igure, see online version of this article.
Fig. 5 – Répartition spatiale des sept phases de succession au sein du site d’étude de l’Allier au cours des cinq dernières décennies (19672014). Pour la igure en couleur, voir la version en ligne de cet article.
Géomorphologie : relief, processus, environnement, 2017, vol. 23, n° 3, p. 187-202
193
Virginia Garófano-Gómez et al.
Fig. 6 – Changes in the area (right axis) / proportion of area (let axis) of each succession phase within the study area at the Allier River (1967-2014). Grey vertical lines denote years with historical photographs. he phases WA (water) and BS (bare soil) are shown together representing the active tract. PP. Pioneer phase; HP. Herb phase; SP. Shrub phase; FP. Forest phase; AGRI. Agricultural land. For colour igure, see online version of this article.
Fig. 6 – Changements de la supericie (axe de droite) / proportion de la supericie (axe de gauche) de chaque phase de succession au sein de la zone d’étude de l’Allier (1967-2014). Les lignes verticales grises indiquent les années comportant des images historiques. Les phases WA (eau) et BS (sol nu) sont présentées ensemble ; elles représentent le chenal actif. PP. Phase pionnière ; HP. Phase herbacée ; SP. Phase arbustive ; FP. Phase arborée ; AGRI. Terrain agricole. Pour la igure en couleur, voir la version en ligne de cet article.
hydrological variables except for those involving stable processes (tab. 3). Speciically, stability of natural phases was negatively correlated with the duration of the double of the mean annual discharge (2MQ), denoting that the lower the discharge the higher the stability of the ecosystem. On the contrary, transition 1b (PP / HP -> SP) was positively related with this critical discharge. Signiicant positive correlations were found between the frequency and duration of loods of intermediate magnitude (HQ2 and HQ5) and the transition 1c (AGRI -> SP) and 2c (AGRI -> FP), as well as the initial-aggradation in progression (WA -> BS) and retrogression (any phase -> BS / PP). Furthermore, a signiicant positive correlation was also observed between the colonization 1 (WA / BS -> PP) and transition 1a (WA / BS -> SP) with the frequency and duration of loods of high magnitude (HQ10 and HQ20).
5. Discussion In the present study, we combined a variety of techniques to understand the vegetation succession within a dynamic meandering section of the Allier River over the last ive decades, and in particular to conirm a shit visually observed ater the beginning of the 21st century. For this purpose, (i) we conducted a comprehensive ield survey to understand the current landscape mosaic and three successional pathways were identiied (ig. 3, 4), (ii) we used a set of historical aerial images to identify changes in the spatio-temporal distribution of succession phases (ig. 5-7), (iii) we analysed the trajectories of change at the scale of the riparian corridor and identiied a signiicant change in certain succession processes before and ater the year 2005 (ig. 8; tab. 1, 2), and (iv) inally we correlated the observed spatio-temporal landscape changes to the discharge regime (tab. 3).
194
Fig. 7 – Mosaic plot of a 7 x 8 contingency table between succession phase (rows) and year-map (columns). he height of the tiles is proportional to the area of each succession phase in each year-map. he border and the colour of the tiles indicate the sign and magnitude of their standardized Pearson’s chi-squared residuals, i.e. they represent if the cell’s observed frequency is higher (solid border; deep blue if signiicant) or smaller (dashed border; deep red if signiicant) than that expected from random association between succession phases and year-maps. WA. Water; BS. Bare soil; PP. Pioneer phase; HP. Herb phase; SP. Shrub phase; FP. Forest phase; AGRI. Agricultural land. For colour igure, see online version of this article.
Fig. 7 – Graphique « mosaïque » d’un tableau de contingence de 7 x 8 entre la phase de succession (lignes) et l’année-carte (colonnes). La hauteur des rectangles est proportionnelle à la surface de chaque phase de succession dans chaque année-carte. La bordure et la couleur des rectangles indiquent le signe et la magnitude de leurs résidus Khi-deux de Pearson normalisés, c’est-à-dire qu’ils indiquent si la fréquence observée de la cellule est plus élevée (bordure solide ; bleu profond si signiicatif) ou plus petite (bordure pointillée ; rouge foncé si signiicative) que celle attendue d’une association aléatoire entre les phases de succession et les annéescartes. WA. Eau ; BS. Sol nu ; PP. Phase pionnière ; HP. Phase herbacée ; SP. Phase arbustive ; FP. Phase arborée ; AGRI. Terrain agricole. Pour la igure en couleur, voir la version en ligne de cet article.
Our analysis was constrained by the acquisition dates of the eight sets of multi-temporal aerial images spanning 50 years, which were not placed at equal intervals along the ive decades. his made it necessary to standardize the raw data (vegetation and hydrology) to a year basis to ensure that any analytical results were not diferentially afected by the length of the studied time periods (from 2 to 15 years). In longer periods, larger changes should be expected between images although this depends on (i) the frequency, magnitude and timing of the disturbance events and if they were captured or not by the precise moment when the images were taken, and (ii) if trajectories were unidirectional or alternated. he standardization necessarily assumed an equal distribution of landscape changes and lood events within the years of each period, which may have produced a certain overestimation of real values for short dynamic periods and an underestimation for long stable ones. Another constraint on our analysis was the resolution of the images that were used to explore the landscape changes. Images with the lowest resolution may have led to less accurate photointerpretation, although given the broad and distinct succession phases employed, it is unlikely that any serious errors in our analysis can be attributed to this factor. Still, due to the small sampling size (i.e. eight maps, seven periods) considered in the statistical analysis, the results must be interpreted with caution. Our analysis revealed a general increase in the proportion of the forest phase and a synchronous reduction in the bare soil phase of the
Géomorphologie : relief, processus, environnement, 2017, vol. 23, n° 3, p. 187-202
Fluvial and biological dynamics
Tab. 1 – Ratios of progression / retrogression, succession / stability and proportion of area stable within the study area across time.
Statistics / Periods
Tab. 1 – Rapport de progression / rétrogression, succession / stabilité et proportion des surfaces stables au sein du site d’étude au cours du temps.
1967-1978
1978-1983
1983-1985
1985-2000
2000-2005
2005-2010
2010-2014
11
5
2
15
5
5
4
Progression / retrogression
1.27
1.31
1.21
1.40
3.39
1.29
1.25
(Prog . + retr.) / stable
1.05
1.24
0.80
1.09
0.86
0.31
0.50
Proportion stable (%)
48
40
55
48
53
76
67
Years
Fig. 8 – Hierarchical cluster analysis (average linkage method and Euclidean distance) of the standardized succession processes (rate ha.yr-¹) for the seven time intervals between 1967 and 2014. Fig. 8 – Dendrogramme (classiication ascendante hiérarchique ; méthode d’agglomération « average » et distance euclidienne) des processus standardisés de succession (taux ha/an) pour les sept intervalles de temps entre 1967 et 2014.
riparian corridor of the lower course of the Allier River. Both have been accompanied by a decrease in the frequency and duration of moderate and high magnitude loods, especially ater the year 2005 (ig. 2, 6, 7). In the 1978 and 1985 images, the riparian corridor relects a high proportion of bare sediment (ig. 5-7). Four HQ5 loods took place before these both images were taken (ig. 2). he period 19781983 has been identiied as the most dynamic one (i.e. with larger succession than stability). In the 1983 image a great increment in the pioneer phase is observed, which can be linked to the high magnitude loods (three HQ10 events and one HQ20 event) which all occurred in the spring time during the early 1980’s. Between 1985 and 2005, two HQ20 events were registered, which both can be related to a high retrogression and consecutive progression (e.g. colonization of bare soil by pioneer species). Quantitative observations could be made especially immediately ater the HQ20 event in winter 2003 based on the landscape changes captured by the 2005 image. It seems that the period 2000-2005 has marked a clear state transition, where the width of the active tract has been signiicantly reduced and the proportion of the forest phase has become the highest recorded since aerial images exist for the Allier River study site (i.e. 1946). Ater 2005, the system has reduced considerably both progression and retrogression trajectories, and thus stability has turned out to be the dominant
process at the corridor scale (tab. 1). Although progression has always been superior than retrogression during the entire study period, we did not ind diferences in total progression and retrogression on a yearly basis, as their rates of change (ha.yr-¹) were very similar before and ater 2005 (tab. 2). his suggests that the system keeps a shiting habitat mosaic steady-state. However, remarkable diferences were found in the stability rates, which doubled their values ater 2005, passing from 20 to 50 ha.yr-¹. hese changes in the landscape mosaic have been associated with the virtual disappearance of moderate (HQ5) and high magnitude loods (HQ10 and HQ20). In addition, the statistical analysis showed that the channel becomes less dynamic since a small but signiicant reduction in the transitions 1c and 2c ater 2005 has been identiied, which involved the change from cultivated land close to the channel to shrub and forest phases (tab. 2). Although signiicant, these changes did not represent large areas in the corridor, but this result suggests that river bank erosion rates are smaller than before 2005. Furthermore, both transitions were positively correlated with the frequency and duration of moderate magnitude loods (HQ2 and HQ5), as well as the initial-aggradation, i.e. progression from water to bare soil and the retrogression from any phase to bare soil (tab. 3). he progressions from water and bare soil to pioneer and shrub (colonization 1 and transition 1a, respectively) were positively correlated with HQ10 and HQ20, revealing that these high returninterval loods are able to reconigure the landscape through the turnover of habitats (Turner et al., 1998; Surian et al., 2015), promoting retrogression but also progression, as they provide potential new areas for vegetation recruitment. Consequently, the absence of these lood events during the last two study periods (2005-2014) may be considered as one of the reasons of the large stability observed. he progression from pioneer and herbs to shrubs (transition 1b; rho = 0.69; p-value = 0.090) and the retrogression from any phase to bare soil and pioneer (initial aggradation-ret.: rho = 0.74; p-value = 0.058) were positively correlated with the frequency of the double of the mean annual discharge (2MQ). his result suggests that this frequent but relatively low magnitude discharge plays an important role for the maintenance of a balanced ratio between bare and colonized surfaces in the active tract, as well as for the provision of the necessary soil moisture, nutrients and organic matter for the recently recruited vegetation (e.g. seedlings) to grow and persist. In addition, the duration of the 2MQ was negatively correlated with the proportion of the stable area within the study area (rho = –0.92; p-value = 0.001; data not shown). Hence, the shorter the duration of this 2MQ discharge, the larger the overall stability of the corridor, which underscores the non-linear efect of established plants in increasing rapidly progression and stability modalities. Complementary to this result, we observed that on the lower Allier River a signiicant reduction of the maximum daily discharge (annual maximum low) from 760 m³.s-¹ (mean value for the period 1967-2005; range: 206-1,390 m³.s-¹) to 555 m³.s-¹ (mean value for
Géomorphologie : relief, processus, environnement, 2017, vol. 23, n° 3, p. 187-202
195
Virginia Garófano-Gómez et al.
Tab. 2 – Classiication of trajectories of change and associated processes used in the evaluation of the chronological overlay of raster maps of succession phases. Trajectory
Process
Tab. 2 – Classiication des trajectoires d’évolution et processus associés utilisés pour l’évaluation chronologique des phases de succession basée sur les images rasters.
Description
Initial-aggradation (Prog.) Water bodies bare soil Colonization 1 Colonization 2a Colonization 2b Colonization 2c Transition 1a Progression Transition 1b Transition 1c Transition 2a Transition 2b Transition 2c
Water bodies / bare soil pioneer
Water bodies / bare soil herb Pioneer herb
Agriculture herb
Water bodies / bare soil shrub Pioneer / herb shrub Agriculture shrub
Water / bare soil / pioneer / herb forest Shrub forest
Agriculture forest
Total progression Channel -shift / erosion Initial aggradation (Ret.) Retrogression
Partial natural retr. a Partial natural retr. b
Any phase water body
Any phase bare soil / pioneer Forest shrub
Forest / shrub herb
Total retrogression
Stability
Group 1 1967-2005
Group 3 2005-2014
Fwe
Raw p-value
Adj. p-value
2.021
1.551
1.123
0.387
0.774
3.900
1.987
0.520
0.513
0.875
2.724
0.741
9.363
0.054
0.247
0.664
2.789
2.005
0.381
0.774
0.053
0.007
2.202
0.234
0.585
1.166
0.329
2.614
0.203
0.580
2.074
2.009
0.003
0.964
0.995
0.052
0.006
7.298
0.074
0.247
1.290
2.198
0.248
0.700
0.948
2.020
2.034
0.000
0.995
0.995
0.254
0.030
7.898
0.067
0.247
16.220
13.679
0.188
0.689
0.948
4.488
5.284
0.103
0.776
0.948
2.335
2.393
0.010
0.924
0.995
0.959
1.331
0.090
0.806
0.948
1.447
1.799
0.487
0.525
0.875
9.229
10.807
0.169
0.717
0.948
Stable natural
Natural areas that show no change
20.493
49.400
28.818
0.009
0.090
Stable agriculture
Cultivated areas that show no change
4.131
10.716
10.061
0.035
0.233
24.623
60.117
26.224
0.008
0.090
2.340
0.000
NaN
NaN
NaN
Total stability Anthropization Cultivation
Any natural phase agriculture
he description of each process depicts the change from one phase to another phase (t0 -> t+1) or the absence of a phase change. hen, the mean rate values (ha.yr-¹) and statistical value of diference (Welch test) of the diferent trajectories of change of group 1 (1967-2005, excluding 1983-1985) and group 3 (2005-2014) of time periods are shown. Raw and adjusted p-values in bold mean statistical signiicance (p-value t+1) ou l’absence d’un changement de phase. Ensuite, les taux moyen (ha/an) et résultats des tests statistiques (test de Welch) des diférentes trajectoires d’évolution pour les groupe 1 (1967-2005, période 1983-1985 exclue) et groupe 3 (2005-2014) de période de temps sont montrés. Les p-valeurs brutes et ajustées en gras indiquent une signiicativité statistique (p-valeur HQ50) to disrupt the landscape mosaic. Our observations about the current spatial arrangement of succession phases seems to be related to the absence of large loods during more than one decade. his absence of large loods could be inherent to the strong intra- and inter-annual variability of the low regime of the Allier River (Onde, 1923). However, the current and future (21st century) impacts of climate change on the hydrological regime of the lower Allier River have been clearly shown by the recent projects ICC-Hydroqual (Moatar et al., 2010) and Explore 2070 (Chauveau et al., 2013). he current and future changes in the lood regime can have direct consequences in other associated factors important for vegetation dynamics, such as the mobilization of sediments within the active tract, and hence, the creation of potential areas for recruitment (Johnson, 2000). At the catchment scale, further
196
Géomorphologie : relief, processus, environnement, 2017, vol. 23, n° 3, p. 187-202
Fluvial and biological dynamics
Tab. 3 – Spearman’s rho correlations of succession processes and frequency and duration of lood events per year.
Trajectory
Process
Tab. 3 – Corrélations rho de Spearman des processus de succession et fréquence et durée des inondations par an.
Description
2MQ
HQ 2
HQ 5
HQ 10
HQ 20
Initial-aggradation (Prog.) Water bodies bare soil
0.34 / 0.36
0.69 / 0.64
0.54 / 0.54
0.08 / 0.08
0.12 / 0.16
Colonization 1
0.13 / 0.36
0.51 / 0.46
0.36 / 0.36
0.71 / 0.71
0.70 / 0.67
0.07 / 0.36
0.58 / 0.54
0.52 / 0.52
0.10 / 0.10
0.16 / 0.22
Colonization 2a Colonization 2b Colonization 2c Transition 1a Progression Transition 1b Transition 1c Transition 2a Transition 2b Transition 2c
Water bodies / bare soil pioneer
Water bodies / bare soil herb Pioneer herb
Agriculture herb
Water bodies / bare soil shrub Pioneer / herb shrub Agriculture shrub
Water / bare soil / pioneer / herb forest Shrub forest
Agriculture forest
Total progression Channel -shift/erosion Initial-aggradation (Ret.) Retrogression Partial natural retr. a Partial natural retr. b
Any phase water body
Any phase bare soil / pioneer Forest shrub
Forest / shrub herb
Total retrogression Stable natural
0.13 / -0.46 -0.16 / -0.25 -0.18 / -0.18 -0.34 / -0.34 -0.30 / -0.26
Natural areas that show no change
0.09 / -0.18
0.13 / 0.11
0.02 / 0.02 -0.59 / -0.59 -0.52 / -0.43
0.00 / 0.46
0.56 / 0.50
0.47 / 0.47
0.77 / 0.77
0.80 / 0.81
0.69 / 0.18
0.47 / 0.39
0.49 / 0.49
0.06 / 0.06
0.02 / -0.02
0.38 / 0.50
0.81 / 0.75
0.92 / 0.92
0.32 / 0.32
0.26 / 0.20
-0.16 / -0.11 -0.27 / -0.32 -0.18 / -0.18 0.10 / 0.10
0.16 / 0.22
0.00 / -0.11 0.07 / -0.04
0.13 / 0.13
0.18 / 0.18
0.22 / 0.26
0.36 / 0.52
0.76 / 0.70
0.71 / 0.71
0.36 / 0.36
0.38 / 0.40
0.34 / 0.04
0.34 / 0.25
0.27 / 0.27
0.16 / 0.16
0.18 / 0.20
0.41 / 0.04
0.14 / 0.07
0.20 / 0.20
0.34 / 0.34
0.28 / 0.22
0.74 / 0.11
0.56 / 0.54
0.60 / 0.60 -0.43 / -0.43 -0.52 / -0.59
0.41 / 0.04
0.22 / 0.14
0.45 / 0.45 -0.10 / -0.10 -0.16 / -0.22
0.34 / 0.04
0.34 / 0.25
0.27 / 0.27
0.16 / 0.16
0.18 / 0.20
0.56 / 0.00
0.34 / 0.25
0.36 / 0.36
0.06 / 0.06
0.02 / -0.02
0.13 / -0.61 -0.23 / -0.32 -0.23 / -0.23 -0.47 / -0.47 -0.46 / -0.43
Stability Total stability
0.13 / -0.61 -0.23 / -0.32 -0.23 / -0.23 -0.47 / -0.47 -0.46 / -0.43
Values in italics mean high correlation (rho > 0.6) and in bold and italics statistical signiicance (p-value 0.6) et les valeurs en italique et gras une signiicativité statistique (p-valeur