Journal of Tropical Ecology (2000) 16:753–756. With 1 figure Copyright 2000 Cambridge University Press
SHORT COMMUNICATION
Mortality rate estimation when inter-census intervals vary TAKUYA KUBO*, TAKASHI KOHYAMA†1, MATTHEW D. POTTS‡ and PETER S. ASHTON† *Graduate School of Environmental Earth Science, Hokkaido University, Sapporo 0600810, Japan †Harvard University Herbaria, 22 Divinity Avenue, Cambridge, MA 02138, USA ‡Division of Engineering and Applied Science, Harvard University, Cambridge, MA 02138, USA (Accepted 17th March 2000)
KEY WORDS: maximum likelihood method, Pasoh, permanent plot, tree, tree populations, tropical rain forest
The probability of death during a unit time period, or mortality rate, is an essential demographic parameter characterizing population turnover. There are several problems in estimating mortality of tree populations from censuses of marked trees in permanent plots (Sheil 1995). Besides these problems, a practical problem exists that is common with large-sized plots; namely, variable return intervals among trees between censuses. It usually takes a long time for establishment of large plots, as well as remeasurement. The duration of a single census takes a long time, and the return interval for each tree in each species population therefore becomes variable. Therefore, we cannot apply, for example, such a conventional estimation of instantaneous mortality rate λ (y−1) between the two sequential censuses (e.g. Sheil et al. 1995): λ = [ ln N – ln Ns] / T,
(1)
where N is the number of alive trees at the first census, Ns is the number surviving until the second census, and T (y) is the duration between the two censuses, because T is not fixed. 1
Correspondence: T. Kohyama, Graduate School of Environmental Earth Science, Hokkaido University, Sapporo 060-0810, Japan. Email:
[email protected] 753
754
TAKUYA KUBO ET AL.
Mortality rate is a population-level probability estimate, and the maximum likelihood method is applicable to its estimation using all records of census interval for each tree. Let us assume that time t is continuous, and the instantaneous mortality λ is constant throughout census intervals in a population or particular size-class of the population. Then, the probability of death during the period ∆t is λ∆t. By time integration, the probability for a tree i to remain alive during interval Ti is exp(—λTi) and that for a tree j to die during interval Tj is [1 – exp(−λTj)]. The likelihood function L(λ) at the level of a population is defined as the product of the probabilities of the alternative fates of each tree,
where Ns and Nd (= N – Ns) are numbers of surviving and dead trees during the two censuses with variable intervals. The maximum likelihood estimate (ML estimate) of mortality corresponds to the value of λ that maximizes L(λ). Equation (2) is differentiable, so that the ML estimate is equivalent to the solution of d[ln L(λ)]/dλ = 0, or
Equation (3) is an implicit function of λ, and is readily solved by iterative methods. A sample code in Perl to solve Equation (3) is available at URL http://hosho.ees.hokudai.ac.jp/pkubo/kkpa/. When every recensus for all individuals both surviving and dying trees are with equal T (i.e. Ti = Tj = T), equation (3) collapses to equation (1), a conventional estimate of mortality. To estimate mortality for duration-variable census of a 50-ha plot on Barro Colorado Island, Panama, Condit et al. (1995) employ equation (1) substituting the arithmetic average of census intervals of either surviving tree Ti’s or dead tree Tj’s for T. They show, using a simple simulation with uniform-distributed census interval, that the error by using equation (1) with average-duration tends towards underestimation, and that the error can usually be small enough to be ignored. Their simulation assumes that the distribution of Ti is equivalent to that of Tj, an assumption that can be violated for smaller-sized populations. We compared ML and ‘average-duration’ (AD) estimates using the 50-ha plot data of Pasoh forest, Peninsula Malaysia (Manokaran et al. 1990). We calculated mortality during the first (1987) and the second (1990-) censuses of each species at each trunk diameter class (using 2-cm octave classes, e.g. 1–2, 2–4, 4–8, 8–16, . . . cm). The number of size-class populations was 1950 (with > 10 individuals) from 612 species. The average duration between the first and the second censuses was 2.9 ± 0.2 y (average and SD among populations) and the range of the census duration within a population was 1.8
Mortality estimation when intervals vary
755
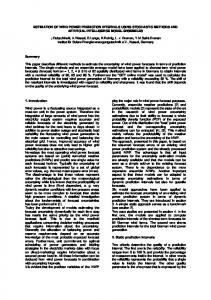
Figure 1. Distribution of the % deviation of average duration (AD) mortality from maximum liklihood (ML) duration, calculated as [(AD mortality) − (ML mortality)]×100/(ML mortality), in each size class of each species in the Pasoh 50-ha plot (during first census period), plotted against (a) the initial population size, and (b) ML mortality estimate. Total 1950 populations from 612 species were analysed.
± 0.5 y. The relative difference between the two estimates was usually smaller than 3% as Condit et al. expected. The difference between ML estimate and AD estimate was increased with decreasing population size, and with increasing mortality (i.e. increasing contribution of the term of dead trees in equation (3) relative to that of survivors) (Figure 1). Distribution of errors were both positive and negative, although they were significantly biased toward underestimation (P < 10−28; binomial test based on sign of errors), contrary to the persistent negative bias in the simulation of Condit et al. (1995). As it turned out that there were close agreements between the ML and AD estimates, we can practically adopt either of them for a constant-mortality model. However, we recommend an accurate procedure of ML estimation for census data with a wide range of duration variation, particularly when population size is small and when mortality is high. Furthermore, ML estimation has an advantage that its derivation is based on an explicitly defined stochastic model, so that we may easily extend the ML model into a more realistic mortality model such as that depending on growth (Pacala et al. 1996) and on both size and local competition (Kubo & Ida 1998). The ML estimation of mortality is valuable not only for duration-variable plot census data of tree populations, but also for similar types of data, such as individual-based sporadic records of survival and death in populations of large mammals. A C K N OW L E D G E M E N TS
We thank Rick Condit, Stuart Davies and Campbell Webb for valuable comments on this communication, and David Burslem and Doug Sheil for helpful
756
TAKUYA KUBO ET AL.
review comments. The data of Pasoh 50-ha plot is from the long-term project sponsored by the Forest Research Institute Malaysia; we particularly acknowledge N. Manokaran and Jim LaFrankie for supporting data access. L I T E RA T U RE C I T E D
CONDIT, R., HUBBELL, S. P. & FOSTER, R. B. 1995. Mortality rates of 205 neotropical tree and shrub species and the impact of a severe drought. Ecological Monographs 65:419–439. KUBO, T. & IDA, H. 1998. Sustainability of an isolated beech-dwarf bamboo stand: analysis of forest dynamics with individual based model. Ecological Modelling 111:223–235. MANOKARAN, N., LAFRANKIE, J. V., KOCHUMEN, M., QUAH, E. S., KLAHN, J. E., ASHTON, P. S. & HUBBELL, S. P. 1990. Methodology for the fifty hectare research plot at Pasoh Forest Reserve. Research Pamphlet No. 194. Forest Research Institute of Malaysia, Kepong. PACALA, S. W., CANHAM, C. D., SILANDER, J. A. J., KOBE, R. K. & RIBBENS, E. 1996. Forest models defined by field measurements: estimation error analysis and dynamics. Ecological Monographs 66:1–43. SHEIL, D. 1995. A critique of permanent plot methods and analysis with examples from Budongo Forest, Uganda. Forest Ecology and Management 77:11–34. SHEIL, D., BURSLEM, D. F. R. P. & ALDER, D. 1995. The interpretation and misinterpretation of mortality rate measures. Journal of Ecology 83:331–333.