Secondly, it requires accurate calibration at the beginning of every session .... [17] extend the work of [16], translating blob features into illustrator and adaptor ..... Rabiner, L.R.: A tutorial on hidden markov models and selected applications in.
Motion Profiles for Deception Detection Using Visual Cues Nicholas Michael∗ , Mark Dilsizian∗ , Dimitris Metaxas∗ , and Judee K. Burgoon† ∗
Computational Biomedicine Imaging & Modelling Center (CBIM), Rutgers The State University of New Jersey, 110 Frelinghuysen Road, Piscataway, NJ 08854-8019 {nicholam,mdil,dnm}@cs.rurgers.edu † Center for the Management of Information (CMI), The University of Arizona, 1130 East Helen Str., Tucson, AZ 85721-0108 {jburgoon}@cmi.arizona.edu
Abstract. We propose a data-driven, unobtrusive and covert method for automatic deception detection in interrogation interviews from visual cues only. Using skin blob analysis together with Active Shape Modeling, we continuously track and analyze the motion of the hands and head as a subject is responding to interview questions, as well as their facial micro expressions, thus extracting motion profiles, which we aggregate over each interview response. Our novelty lies in the representation of the motion profile distribution for each response. In particular, we use a kernel density estimator with uniform bins in log feature space. This scheme allows the representation of relatively over-controlled and relatively agitated behaviors of interviewed subjects, thus aiding in the discrimination of truthful and deceptive responses. Key words: face tracking, skin blob tracking, statistical shape models, deception, nearest-neighbor, support vector machine
1
Introduction
Wherever two people communicate, deception is a reality. It is present in our everyday social and professional lives [1] and its detection can be beneficial, not only to us individually but to our society as a whole. For example, accurate deception detection can aid law enforcement officers in solving a crime. It can also help border control agents to detect potentially dangerous individuals during routine screening interviews [2]. Currently, the most successful and widespread system is the polygraph which monitors uncontrolled changes in heart rate and electro-dermal response, as a result of the subject’s arousal to deceit. Unfortunately, its widespread use does not necessarily mean it is a perfect system. Firstly, in order for it to take the
2
Nicholas Michael, Mark Dilsizian, Dimitris Metaxas, Judee K. Burgoon
necessary measurements, it needs to be continuously connected to the subject’s body. This means that the subject must be cooperative and in close proximity to the device. Secondly, it requires accurate calibration at the beginning of every session, so that a baseline of measurements can be established. Occasionally, it may still fail to give accurate readings, despite the calibration step, if for example, the subject’s heart rate increases for reasons unrelated to deception. Furthermore, the polygraph is an overt system, which means that the subject knows they are being monitored and also knows what measurements are being made. As a result, they may devise techniques to trick the machine, such as remaining calm, in an attempt to control their heart rate or being excited during the calibration phase, so that any excitement due to deception that the polygraph later registers, will mistakenly be regarded as a normal response. Lastly, the polygraph requires a trained operator, whose skills and abilities control both the likelihood of human error in the interview and the length of the interview itself. Unlike computers, humans will get tired and will eventually need a break. Therefore, what is needed is an automatic and covert system, which can continuously and unobtrusively detect deception, without requiring the subject’s cooperation. In response to this need, researchers have long been trying to decode human behavior, in an attempt to discover deceptive cues. These would aid them in designing systems for automatic deception detection or for training others to detect it [3]. Some deceptive behaviors fall into one of two groups: over-control and agitation [1]. In an attempt to hide their deception, liars who are aware of possible deceptive behavioral cues, may exert extra effort in hiding any behavior [4, 5] and particularly reducing movements of their hands, legs and head, while they are being deceptive [6–8]. At the other extreme are liars who show signs of agitated behavior triggered by nervousness and fear. As a result, their speech tends to be faster and louder [7] or they may engage in undirected fidgeting [4]. Nevertheless, it is incorrect to assume that agitated or over-controlled behavior is always a sign of deception. One should also consider the normal behavior of a person, as well as the tone and context of the communication taking place. It may be the case that some subjects have a tendency of behaving over-controlled when interrogated by strangers. Others may seem agitated during an interrogation because they had just returned from their morning jog. According to Burgoon’s Expectancy Violations Theory (EVT) [9], if in a communication there is considerable deviation of the observed behavior from the expected behavior, then this is a cause for suspicion. For example, an interrogator may become suspicious of a suspect who is relaxed at the beginning of the interrogation but becomes agitated as soon as they are questioned about a crime. Furthermore, in their Interpersonal Deception Theory (IDT) [6, 10], Buller and Burgoon state that deception is a dynamic process, whereby liars adjust their behavior according to how much they believe they are suspected of being deceitful. It is likely that during their interaction, liars will unintentionally reveal some behavioral cues as a result of their deception and suspicion [11].
Motion Profiles for Deception Detection using Visual Cues
3
Motivated by the importance of deception detection and the limitations of the widely used polygraph, we propose a novel, automatic and covert approach for detecting deception in interview responses, using visual cues. In every frame we track the movements of a subject’s hands and head relative to their body, as well as some of their facial expressions and their 3D head pose. We aggregate these movements and expressions over each response and extract what we call motion profiles (see Sect. 3.3). In order to implicitly establish the baseline truthful responses for a subject and discriminate them from their deceptive responses we formulate this problem as a Nearest Neighbor classification problem. This formulation, together with our motion profiles, significantly outperforms the method proposed in [11] for a similar interview scenario. The rest of our paper is organized as follows. Section 2 describes previous attempts in solving the problem of deception detection. Section 3 describes our approach. More specifically, we describe the tracking components of our approach in Sects. 3.1 and 3.2, and we describe our feature set in Sect. 3.3. We describe our experimental results in Sect. 4, we discuss some future extensions of this work in Sect. 5 and we end with some closing remarks in Sect. 6.
2
Previous Work
Having stressed the importance of automatic and covert deception detection in the previous section, we now briefly discuss a few of the research attempts to solve this problem. Some researchers look for physiological indicators which can correlate to deception, in a similar fashion to the polygraph [5]. For example, the authors of [12], build a thermodynamical model to monitor increases in blood flow around the eyes of a subject. However, this method needs a controlled environment and expensive non-standard equipment, thus hindering its broad deployment. Since the method cannot track head movements, its accuracy suffers if the subject’s head is moving or at an angle to the camera. Similarly, some researchers, such as the authors of [13–15], use functional Magnetic Resonance Imaging (fMRI) to monitor brain activity during interviews. However, methods based on fMRI cannot be used in a covert scenario, they require specialized equipment and a cooperative subject. Other researchers move away from physiology and attempt to analyze behavioral indicators, instead. Zhang et. al. [2] look at which facial Action Units are activated in a particular facial expression, in order to determine whether it is faked or real. Their method, however, is currently based on static images. Lu et. al. [16] track hand and head skin blobs of subjects to classify their movement signatures as over-controlled, relaxed or agitated. However, it is not convincing that the equation they used for state estimation generalizes to unseen data, given they only tested it on five subjects. One may need to learn subject specific models, since state thresholds can vary across the population. Tsechpenakis et. al. [17] extend the work of [16], translating blob features into illustrator and adaptor behaviors and combining these via a hierarchical Hidden Markov Model [18] to decide if the subject is agitated, relaxed or over-controlled. In the work of
4
Nicholas Michael, Mark Dilsizian, Dimitris Metaxas, Judee K. Burgoon
Meservy et. al. [11], the step of classifying behaviors [16, 17] is bypassed and the authors attempt to directly derive deceptive cues, using blob analysis as in [16]. They segment the video data of interviews into responses and use summary data of each segment, such as the velocity variances of blobs, to make predictions but they do not achieve high accuracy. We believe that relying on the parametric representation (mean and variance) of the summary data used in [11, 16, 17], causes a lot of useful information about a feature’s distribution to be lost and smooths out any abrupt motions and micro-expressions that briefly occur, when a subject is being deceitful. Eckman and Friesen call this leakage [19], while Buller et. al. call this non-strategic behavior [20]. We propose to extract motion profiles, which differ from the movement signatures of [16], in that ours are nonparametric representations of the distributions of both blob and facial features. In this way, this richer representation captures any such leakage that occurs during an interview response.
3
Method
As already discussed, the main idea of our approach is to extract motion profiles of subjects within each response. These motion profiles consist of similar features used in [11, 16, 17] and are described in Sect. 3.3. In order to extract the features that make up the motion profiles, we use the skin blob tracker of [16] and the Active Shape Model (ASM) tracker of [21]. Sections 3.1 and 3.2 briefly review the skin blob and the ASM trackers respectively. The extracted features are then represented using log-scale histograms, which we describe in Sect. 3.3. 3.1
Head and Hand Blob Tracking
Following the method in [16], we use color analysis, eigen shape decomposition and Kalman filtering to track the position, size and orientation of the head and hand blobs. Instead of a 3D Look-Up-Table (LUT), we build a 2D LUT with Hue and Saturation color components, based on the Hue-Saturation-Value (HSV) skin color distribution of the face and hands. The Value component of the HSV representation is not used, so as to make the representation more robust to illumination than the normalized Red-Green-Blue (RGB) color representation used in [16]. The LUT is built offline from skin color samples. The system extracts face and hand like regions in each frame using the LUT and computes candidate elliptical head and hand blobs. Subsequent eigen shape decomposition and Kalman filtering, prunes the candidate blobs keeping only the most probable ones taking into account the shape of the candidates and the previous position of each of the blobs (see [16] for a more detailed description). A sample frame illustrating the detected blobs and the skin color samples used in building the color model is depicted in Fig. 1. From the tracked positions of the blobs we compute derived features, as in [11], which are designed to capture behavioral agitation and over control by characterizing relative positioning of the hands, postural shifts and postural
Motion Profiles for Deception Detection using Visual Cues
5
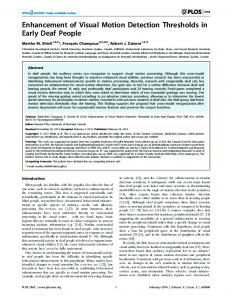
Fig. 1. Sample frame showing the tracked head (blob 0) and hands (blobs 1 and 2) of an interviewee. The tracker records the (x,y) coordinates, area and axis lengths of each detected blob. The skin color samples are shown in the upper right corner
Fig. 2. Illustration of quadrant features. They are used to capture the positions of a subject’s hands relative to their body
6
Nicholas Michael, Mark Dilsizian, Dimitris Metaxas, Judee K. Burgoon
Fig. 3. Illustration of triangle area feature. It is used to quantify the degree of posture openness of a subject
Fig. 4. Illustration of distance features of each of the blobs to the triangle’s center
Motion Profiles for Deception Detection using Visual Cues
7
Fig. 5. Illustration of angle features of the blobs relative to the triangle’s center
openness of a subject. We divide frames into quadrant regions and these are shown in Fig. 2. Imagining that the hand and head blobs form the vertices of a triangle, we can use the area and centroid of this triangle to quantify the openness of a subject’s posture and any postural shifts. These features are shown in Figs. 3, 4 and 5 (refer to [11] for a more detailed explanation of these features). In order to account for differences in subject sizes and positioning, we also look at changes in feature values. For example, we compute blob displacement (∆xti , ∆yti ) at time ti , which is also proportional to velocity, using: ∆xti = xti − xti−1 , ∆yti = yti − yti−1 ,
(1) (2)
where (xti , yti ) is its position at time ti . 3.2
Face Tracking
Face tracking is a challenging problem because the tracker needs to generalize well to unseen faces and handle illumination changes. It should also cope with occlusions (to some degree) and pose changes, such as head rotations, which cause drastic changes in the shape of the face, causing it to lie on a non-linear manifold.
8
Nicholas Michael, Mark Dilsizian, Dimitris Metaxas, Judee K. Burgoon
Fig. 6. Sample frame showing tracking of the 79 facial landmarks. The circle in the upper left corner depicts the estimated 3D vector of the head pose. Underneath it are the estimated values of the pitch, yaw and tilt angles of the head
Kanaujia et. al. [21] tackle the problem with an Active Shape Model (ASM), which is a statistical model of facial shape variation. In the ASM framework, a facial shape S is represented by N landmarks, each of which is characterized by its (x, y) image coordinates, so that S = {x1 , y1 , . . . , xN , yN }. By applying Principal Component Analysis (PCA) on an aligned training set of facial shapes, a subspace is learned which captures the major modes of shape variation by projecting shapes along the eigenvectors of the shape covariance matrix with the highest eigenvalues. In this way, an aligned shape X = Φ(S), where Φ is ¯ of the the linear transformation that aligns a shape S to the mean shape X subspace, can be approximated as: ¯ + Pb , X≈X
(3)
where P is the eigenvector matrix and b is a column vector of shape parameters (encoding). The authors of [21] additionally propose a piecewise approximation to the non-linear shape manifold using overlapping linear subspaces. Basically this means learning separate ASM models for each subspace and dynamically switching subspaces as the pose of the tracked face changes through a rotation. Their system is made to run in real time by incorporating a Sum of Squared Intensity Differences (SSID) point tracker to track image patches across successive frames assuming small displacements. Moreover, using a Bayesian Mixture of Experts
Motion Profiles for Deception Detection using Visual Cues
9
they are able to estimate the 3D pose of the head from the tracked landmarks (refer to [21] for more details). Figure 6 shows a sample frame with the 79 tracked landmarks, along with the predicted 3D head pose. Using this method we were able to track the head pose and the (x, y) positions of the landmarks in every frame of the video sequences we analyzed. The tracked landmarks were used to compute derived features designed to capture facial micro expressions and asymmetries. Namely these are: change in angle between the mouth’s corner points, change in angle between the mouth’s centroid and each of its corner points, change in mouth area, displacement of inner and outer left and right eyebrows. The left/right mouth corner points are computed as the means of the three leftmost/rightmost mouth landmarks. The left/right mouth corner angle is the angle formed by the leftmost/rightmost mouth landmark and the two landmarks on either side of it. Finally, the displacement of the inner/outer eyebrow is computed using the mean displacement of the four innermost/outermost eyebrow landmarks. From this displacement we subtract the mean displacement of the six lower nose landmarks to account for head displacements, assuming that the nose is the most stable face component. 3.3
Motion Profiles
In order to summarize the tracked motions and expressions of subjects we propose to extract motion profiles. These are similar to the movement signatures of [16], however our motion profiles include facial expression information. In addition, our motion profiles are log-scaled in order to capture information important to deception detection, namely, little or no movement, and extreme movement. In each subject’s response the majority of frames involve a small amount of motion. In other words, subjects rarely make extreme movements for the entire duration of their response. Therefore we change the scale of our data representation in order to properly space out the data to allow for discrimination. All motion is histogrammed into five bins, with each bin having an exponentially increasing size. Therefore, the first bin covers a very small range (corresponding to little or no motion) and the fifth bin covers the largest range (corresponding to all extreme motions). This new representation of the data is successful at isolating the over-controlled and agitation responses that Ekman et. al. point to as being important indicators of deception [1]. In Fig. 7 we show the size of each bin for hand motion averaged over all responses for two different subjects. The graph on the left demonstrates a subject exhibiting agitated deceptive behavior: when responses are deceptive, the no motion bin shows a dip and the high motion bin shows a spike, relative to their truthful responses. The graph on the right demonstrates over-controlled deceptive behavior: when responses are deceptive, the no motion bin shows a spike and the high motion bin shows a drop, again, relative to their truthful responses. Let {xi,j }F i=1 be the set of F features we extract from frame j as described in Sects. 3.1 and 3.2. By grouping together features extracted from m consecutive F frames, we form a feature set of the form {{xi,j }F i=1 , . . . , {xi,j+m−1 }i=1 }, which forms the basis of the motion profile over a response rq of m frames. For each
10
Nicholas Michael, Mark Dilsizian, Dimitris Metaxas, Judee K. Burgoon
Fig. 7. Average hand motion shown for two different subjects. Graphs show 5 velocity bins from “no motion” to “high motion”
of the F feature channels, we compute a k–bin normalized log-scale histogram of the feature values xi,j for j = 1, . . . , m, resulting in F histograms having a total of kF bins. We call xrq a motion profile because the histograms capture the distribution of feature values within the response. For classification we use a Nearest Neighbor classifier, whereby for a given test response, we assign it the label of its nearest training neighbor.
4
Experiments and Results
A laboratory experiment was conducted during which interviewees, who represented diverse cultural backgrounds, responded to 13 one-word answer questions and 13 longer questions posed by trained interviewers. Interviewees answered some questions truthfully and some deceptively according to a predetermined sequence. Half were randomly assigned to follow a truth-first sequence and half were randomly assigned to begin with a deception-first sequence. During the interview, three high-speed digital cameras recorded kinesic behavior: one recorded full body profile view, one recorded full body frontal view and one recorded frontal facial view only. After each block of three questions, interviewees rated their truthfulness in answering each question on a 0 (not at all) to 10 (completely truthful) scale. Interviews were typically 20 - 30 minutes long. The recruitment efforts netted a multi-culturally diverse sample of 220 participants. Demographically, the mean age for the total sample was 28.9 years (while σ = 13.34), with 36% aged 21 and under, 48% aged 22 to 40, and 16%
Motion Profiles for Deception Detection using Visual Cues
11
over 40 years of age. By gender, 55% were male and 45% were female. However, recording difficulties allowed only 147 interviews to be analyzed to date. We focused on the responses to the first 12 out of the 13 longer questions in each interview, meaning that in total we had 1764 responses (half deceptive and half truthful). The data set composition in terms of number of frames involving deceptive and truthful responses is shown in Table 1.
Total
Deceptive Truthful Total 882 882 1764
Table 1. Data set composition showing number of deceptive and truthful responses (six of each kind per subject) used for Leave One Out Cross Validation. Numbers based on 147 subjects
Method Precision Recall Accuracy Mock Theft Experiment [11] 59.2% 63.6% 60.0% SVM 68.0% 70.1% 68.5% Nearest Neighbor 81.7% 81.5% 81.6% Table 2. Comparison of classification accuracy. Although the experimental design and classification protocol of [11] was different, it was the most similar to ours in that it dealt with classifying interview responses as deceptive or truthful
NN Conf. Matrix Pred. Deceptive Pred. Truthful True Deceptive 81.5% 18.5% True Truthful 18.3% 81.8% Table 3. Mean confusion matrix of Nearest Neighbor classifiers
Each video interview was analyzed and features were extracted from each frame. The full body frontal view was analyzed by the blob tracker and the facial frontal view was analyzed by the ASM face tracker, while the profile view was not used in our current analysis. We used 5 histogram bins per feature channel with uniform log space width (specific to the current subject). In this way, the first two bins were wide enough to capture the very small feature values corresponding to over-controlled behavior, while the width of each of the remaining bins was successively increased to capture increasingly larger movements corresponding to relaxed and agitated behaviors, respectively. We built
12
Nicholas Michael, Mark Dilsizian, Dimitris Metaxas, Judee K. Burgoon
147 separate Nearest Neighbor models (one for each of the 147 subjects), using Leave One Out Cross Validation (LOOCV), where for each of the interview responses, we hold one out to be used for testing and train the model on the rest, reporting the average LOOCV performance over all 147 NN models. We also tried an SVM classifier for each of these 147 subject-specific models with an RBF kernel (scale and complexity parameters determined by cross validation for each subject). Our motion profile NN models achieve an accuracy of 81.6%, which is significantly better than the accuracy of the method in [11] for a similar interview scenario, and ours is over a larger dataset, too. However, note that, unlike our work, the authors of [11] attempt to build models that generalize over all subjects, and are, thus, doing LOOCV per subject. Instead, we build 147 subject-specific models, doing LOOCV per response per subject. It is, therefore, clear that our subject-specific models perform better than a general model over all subjects. We attribute this to the fact that different subjects may have different deceptive behaviors and different baseline truthful behaviors, as opposed to there being a universal deception cue or “threshold”, which holds for everyone and discriminates truth from deception. All results are shown in Table 2, while Table 3 shows the mean confusion matrix from all NN models. Our proposed system as presented has the limitation that training data must first be collected for a test subject so that the model can be trained. Acquiring such training data might not be trivial in the situations where such a system can be useful. Nevertheless, the proposed work can serve the purpose of providing the foundation for understanding exactly what constitutes the peculiarities that characterize the deceptive tactics of different individuals.
5
Future Work
In our current work we extended the feature vectors used in the previous work of [11, 16, 17], who focused only on blob features, by augmenting features extracted from the face, such as eyebrow displacements and mouth angle changes (see Sect. 3.2). In the future, we plan to inspect these facial features more closely and look at texture changes around key parts of the face, such as the eyes, mouth and nose. Such texture changes may be more information-rich than shape changes, possibly serving as a better indicator of behavioral state. Additionally, we have already started looking at interview data where the subjects originate from many different cultures, since we are trying to discover culture-specific patterns in deception tactics. Once this hurdle is passed, then collecting training data will become easier because it need only be culture-specific (at least), instead of subject-specific. In this way, the applicability of the proposed method can be improved. Moreover, our current method looks at motion profiles in a static context. Surely, utilizing temporal information of how the motion profile varies within a response could be beneficial, as shown in the proof of concept study of [17], so our future work will attempt to augment this temporal dimension to the model.
Motion Profiles for Deception Detection using Visual Cues
13
Lastly, the problem can also be posed as a Multiple Instance Learning (MIL) problem in which bags are the interview responses and their instances are all motion profiles computed within them. This intuitive learning approach may yield even more promising results.
6
Conclusion
We proposed a novel and fully automatic method for deception detection from video input. Experimental results show that this approach has great potential and contributes to understanding deception detection from visual input in general. We achieved 81.6% classification accuracy, outperforming the 60.0%, which was previously achieved by [11] on a similar but smaller dataset and under similar conditions, showing that subject-specific models work better than general models. Consistent performance over many subjects and cross-validation indicate that the model does not overfit the data. However, data from additional psychological studies of deception would help to further confirm that the behaviors discriminated by our learning algorithms are the deceptive behaviors we are attempting to isolate. Nevertheless, our results show a convincing proof of concept and suggest a promising future for the identification of deceptive behavior from video sequences. Acknowledgments. We acknowledge the efforts of the CMI group at the University of Arizona (http://cmi.arizona.edu). Led by Dr. Judee K. Burgoon, the group was responsible for conducting the interviews and collecting all video data used in this work. We also thank Fei Yang for his assistance with processing the video data. This research has been partially supported by the following grants to Dr. Dimitri Metaxas: ONR-N000140910104 and NASA-NSBRI-NBTS01601.
References 1. Ekman, P.: Telling lies: Clues to deceit in the marketplace, politics, and marriage. Volume 2. WW Norton and Company, New York (1992) 2. Zhang, Z., Singh, V., Slowe, T.E., Tulyakov, S., Govindaraju, V.: Real-time automatic deceit detection from involuntary facial expressions. In: IEEE CVPR. (2007) 3. George, J., Biros, D.P., Burgoon, J.K., Nunamaker, J.: Training professionals to detect deception. NSF/NIJ Symposium on Intelligence and Security Informatics, Tucson, AZ (2003) 4. DePaulo, B., Lindsay, J., Muhlenbruck, L., Charlton, K., Cooper, H.: Cues to deception. Psychological Bulletin 129 (2003) 74–118 5. Vrij, A.: Detecting lies and deceit: The psychology of lying and its implications for professional practice. Wiley, Chichester, UK (2000) 6. Buller, D., Burgoon, J., White, C., Ebesu, A.: Interpersonal deception: VII. Behavioral Profiles of Falsification, Equivocation and Concealment. Journal of Language and Social Psychology 13 (1994) 366–395
14
Nicholas Michael, Mark Dilsizian, Dimitris Metaxas, Judee K. Burgoon
7. Ekman, P.: Lying and nonverbal behavior: Theoretical issues and new findings. Journal of Nonverbal Behavior 12 (1988) 163–176 8. Vrij, A., Edward, K., Roberts, K., Bull, R.: Detecting deceit via analysis of verbal and nonverbal behavior. Journal of Nonverbal Behavior 24 (2000) 239–263 9. Burgoon, J.K.: A communication model of personal space violations: Explication and an initial test. Human Communication Research 4 (1978) 129–142 10. Buller, D., Burgoon, J.: Interpersonal deception theory. Communication Theory 6 (1996) 203–242 11. Meservy, T.O., Jensen, M.L., Kruse, J., Burgoon, J.K., Nunamaker, J.F. In: Automatic Extraction of Deceptive Behavioral Cues from Video. Volume 3495/2005 of LNCS. Springer Berlin/Heidelberg (2005) 198–208 12. Buddharaju, P., Dowdall, J., Tsiamyrtzis, P., Shastri, D., Pavlidis, I., Frank, M.G.: Automatic thermal monitoring system (ATHEMOS) for deception detection. IEEE CVPR 2 (2005) 1179 13. Johnson, R., Barnhardt, J., Zhu, J.: The contribution of executive processes to deceptive responding. Neuropsychologia 42 (2004) 878–901 14. Kozel, F.A., Johnson, K.A., Mu, Q., Grenesko, E.L., Laken, S.J., George, M.S.: Detecting deception using functional magnetic resonance imaging. Biological Psychiatry 58 (2005) 605–613 15. Ganis, G., Kosslyn, S.M., Stose, S., Thompson, W.L., Yurgelun-Todd, D.A.: Neural correlates of different types of deception: An fmri investigation. Cerebral Cortex 13 (2003) 830–836 16. Lu, S., Tsechpenakis, G., Metaxas, D., Jensen, M.L., Kruse, J.: Blob analysis of the head and hands: A method for deception detection and emotional state identification. In: Hawaii International Conference on System Sciences, Big Island, Hawaii (2005) 17. Tsechpenakis, G., Metaxas, D., Adkins, M., Kruse, J., Burgoon, J., Jensen, M., Meservy, T., Twitchell, D., Deokar, A., Nunamaker, J.: HMM-based deception recognition from visual cues. In: IEEE ICME, Los Alamitos, CA, USA, IEEE (2005) 824–827 18. Rabiner, L.R.: A tutorial on hidden markov models and selected applications in speech recognition. Proceedings of the IEEE 77 (1989) 257–286 19. Ekman, P., Friesen, W.V.: Nonverbal leakage and clues to deception. Psychiatry 32 (1969) 88–106 20. Buller, D.B., Burgoon, J.K., Buslig, A., Roiger, J.: Interpersonal deception: Viii. nonverbal and verbal correlates of equivocation from the bavelas et al. (1990) research. Journal of Language and Social Psychology 13 (1994) 396–417 21. Kanaujia, A., Huang, Y., Metaxas, D.: Tracking facial features using mixture of point distribution models. In: ICVGIP. (2006)