The Prague Bulletin of Mathematical Linguistics
NUMBER 104
OCTOBER 2015
63–74
MT-ComparEval: Graphical evaluation interface for Machine Translation development Ondřej Klejcha , Eleftherios Avramidisb , Aljoscha Burchardtb , Martin Popela a
Charles University in Prague, Faculty of Mathematics and Physics, Institute of Formal and Applied Linguistics b German Research Center for Artificial Intelligence (DFKI), Language Technology Lab
Abstract The tool described in this article has been designed to help MT developers by implementing a web-based graphical user interface that allows to systematically compare and evaluate various MT engines/experiments using comparative analysis via automatic measures and statistics. The evaluation panel provides graphs, tests for statistical significance and n-gram statistics. We also present a demo server http://wmt.ufal.cz with WMT14 and WMT15 translations.
1. Introduction For language processing tasks like parsing or fact extraction, the expected results can be more or less clearly defined and it is comparably easy to assess the quality of a given system output. Due to the variation of language, ambiguity, etc. evaluating Machine Translation (MT) output can be almost as difficult as the translation itself. The evaluation methods and tools used in practice range from automatic measures that compare MT output against human reference translations via human error annotation up to usability studies. Even if we focus on automatic measures, we are confronted with several measures, options, and ways of measuring that have certain strengths and weaknesses in their diagnostic capacities and that often lead to different assessments of given systems or system variants to be compared. Therefore, often a mix of measures and eventual examination of random samples are used in development cycles. However, the common practice of running many experiments over a period of time soon makes bookkeeping and tracing results challenging. © 2015 PBML. Distributed under CC BY-NC-ND. Corresponding author:
[email protected] Cite as: Ondřej Klejch, Eleftherios Avramidis, Aljoscha Burchardt, Martin Popel. MT-ComparEval: Graphical evaluation interface for Machine Translation development. The Prague Bulletin of Mathematical Linguistics No. 104, 2015, pp. 63–74. doi: 10.1515/pralin-2015-0014.
PBML 104
OCTOBER 2015
MT-ComparEval, the open-source tool described in this article has been designed in order to help MT developers by implementing a back-end evaluation system with a graphical user interface that allows comparing and evaluating different MT engines/experiments and settings through the use of several measures that represent the current best practice. The system helps to tie the development cycles together by linking three ingredients: • An evaluation panel, which provides a graphical interface for comparing the performance of various systems on the same output, visualizing automatic scores and various types of statistics and manual checking of translation quality on a sentence level. • A back-end that monitors some pre-defined storage locations for the addition of new translation outputs. Whenever a new translation output is detected, a new task is added in the background database. • An evaluation mechanism that calculates MT evaluation scores based on a set of automatic evaluation metrics and statistical tests. These results are associated with the translation tasks in the database The structure of this paper is as following: Section 2 compares our tool with previous work. Section 3 outlines the main functionality of the graphical interface. Section 4 describes the back-end and the evaluation mechanism and Section 5 provides information about the requirements, installation and implementation. Finally, Section 6 includes a summary and our aims for further improvements. Demo server In order to showcase the features of MT-ComparEval, we present a demonstration server http://wmt.ufal.cz. The interface includes pre-loaded system outputs from the WMT Shared Task 2014 and 2015 (Bojar et al., 2014, 2015).
2. Related Work The state-of-the-art MT decoder Moses (Koehn et al., 2006) provides a similar evaluation interface as part of the Experiment Management System (Koehn, 2010). EMS is a set of scripts that automate and parallelize the full pipeline of training and testing SMT models with variable settings. On the one end of this pipeline, the developers have the possibility to display the testing results in a web-based interface. Comparing and contrasting our tool with EMS, we can see that: • similar to our tool, the EMS interface organizes trained systems into groups of experiments. It includes a table for comparing the performance of different configurations of the same experiment, based on automatic scores, statistical significance tests, n-gram statistics and color-coded n-gram correctness markup for the output sentences. 64
Klejch et al.
MT-ComparEval (63–74)
• additional to our tool, EMS provides features due to its tight binding with the developed SMT systems, such as the phrase table coverage and the bilingual concordance analysis. • contrary to EMS, which is tightly connected with the training pipeline and optimized for the Moses SMT scripts, our tool provides more flexibility, since the evaluation interface can be run independently of the production of the translation systems. The users can therefore import any translation, irrelevant of how it was constructed. Apart from SMT output, one can therefore import output by other types of systems, such as rule-based, dependency-based or hybrid systems. • MT-ComparEval focuses on comparing two systems and shows their translations sorted by the difference in sentence-level BLEU (or another metric). Also the color highlighting shows the n-grams where one system is better than the other (while in EMS, the color corresponds to the length of the matching ngram). Similar evaluation panels are available through websites such as Evaluation Matrix,1 which is used for displaying comparable scores for the translation system outputs participating in the translation shared task of the Workshop of Machine Translation (Callison-Burch et al., 2007). Commercial MT services, such as Kantan and Asia Online2 also include graphical panels with automatic evaluations in their interface for training models. No system mentioned in this paragraph offers open-source code nor advanced sentence-level comparisons, to the best of our knowledge. The concept of sentence-by-sentence evaluation is available within post-editing tools such as PET (Aziz et al., 2012) or human evaluation panels such as Appraise (Federmann, 2010), although these include no automatic evaluation scores and graphical comparison panels. MT-EQuAl (Girardi et al., 2014), a graphical tool for manual error annotation, allows for visualizing erroneous words and phrases that have been pre-computed by Hjerson (Popović, 2011), based on edit distance from the reference. Hjerson has been integrated also into Addicter3 (Zeman et al., 2011; Berka et al., 2012), which shows sentences (from the train or test corpus) with source-target alignment, manual or automatic word-level error classification and color highlighting and overall summaries. MultEval4 (Clark et al., 2011) focuses on computing statistical signficance using approximate randomization (Riezler and Maxwell, 2005) for three metrics: BLEU, TER and METEOR. 1 http://matrix.statmt.org 2 https://www.kantanmt.com/
and http://www.asiaonline.net
3 https://wiki.ufal.ms.mff.cuni.cz/user:zeman:addicter 4 https://github.com/jhclark/multeval
65
PBML 104
OCTOBER 2015
Similarities to our tool can also be seen in Asiya (Giménez and Màrquez, 2010), in the sense that it wraps the functionality of many automatic evaluation metrics in one program, although there is no graphical interface. See MT-ComparEval wiki for a table of comparison with related tools.5
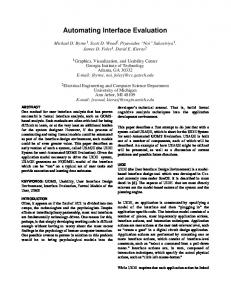
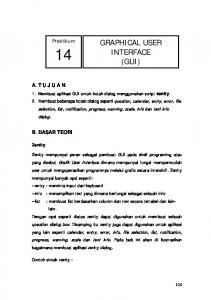
3. Evaluation Panel Here, we present all basic screens and panes of the Evaluation panel, which is the graphical front-end of MT-ComparEval. 3.1. Listing of experiments and tasks The start-up screen of the evaluation panel (Figure 1) provides a list of all the experiments that have been imported. An experiment consists of several tasks – variations of the same experiment with different settings. All tasks of the same experiment share the same source and reference transFigure 1. Part of the start-up screen of lation and only the translated text varies. So a task can be a new version of a previously the evaluation panel with a list available experiments at wmt.ufal.cz. imported system, or a totally different system that nevertheless has been run on the same data. Once the user selects an experiment, an evaluation table with all relevant tasks (Figure 2) is shown. The table contains (document-level) scores for each task entry calculated by (a selected subset of) the included automated metrics. The panel also includes a graphical representation to monitor the improvement of the scores among different versions of the same system.6 The metrics currently supported are Precision, Recall and F-score (all based on arithmetic average of 1-grams up to 4-grams) and BLEU (Papineni et al., 2002).7 MT-ComparEval computes both case-sensitive and case-insensitive (CIS) versions of the four metrics, but the current default setup is to show only case-sensitive versions in the Tasks screen. Users are able to turn the individual metrics on and off, to allow for easier comparisons. 5 https://github.com/choko/MT-ComparEval/wiki/Related-tools 6 7
(updates are welcome)
The line graph can be switched to a bar graph, which is more suitable for comparing unrelated systems.
BLEU uses a geometric mean of 1-grams up to 4-grams, so it needs smoothing for sentence-level scores. We have reimplemented the “official” BLEU script ftp://jaguar.ncsl.nist.gov/mt/resources/ mteval-v13a.pl with the option --international-tokenization.
66
Klejch et al.
MT-ComparEval (63–74)
Figure 2. Listing of tasks of the “Newstest 2015 en-cs” experiment at wmt.ufal.cz.
Additionally, the users have the possibility to delete or hide particular tasks from this panel, e.g. in order to focus on a comparison between particular versions of their systems which show specific progress. The name and the description of each task is editable,8 whereas the description text is collapsed by default to permit a better appearance of the table. The table can be re-sorted on demand, based on each automatic metric. For inspection of the differences between two tasks (say, systemA and systemB), the user needs to mark the tasks’ checkboxes and click “Compare”. A new screen presents four panes: Sentences, Statistics, Confirmed n-grams and Unconfirmed ngrams, which are described in the following subsections.
8
Editing descriptions and deleting tasks and experiments is disabled at wmt.ufal.cz.
67
PBML 104
OCTOBER 2015
Figure 3. Sentences pane with one sentence shown.
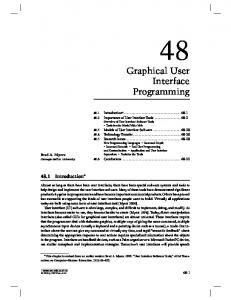
3.2. Sentences pane This pane displays all sentences from the given testset translated by both the systems, one below the other, along with source sentence, reference sentence and scores (see Figure 3).9 The sentences are sorted according to the differences in the chosen sentence-level metric scores. This means that the sentences shown at the top are those, where systemB outperforms systemA the most. Such a view is very useful when checking for regressions of new versions of an MT system against a baseline or a previous version of the same system. A set of checkboxes allow the user to highlight differences between the two systems in several ways: • Confirmed n-grams are n-grams occurring both in the system output and in the reference.10 These are shown with light yellow (for systemA) and blue (for 9 10
The sentences are loaded lazily as needed when the user scrolls down.
If a given n-gram occurs e.g. three times in the system output and only twice in the reference, a heuristic algorithm (based on the longest common subsequence) is used to select two occurrences of the n-gram that will be marked as confirmed in the system output.
68
Klejch et al.
MT-ComparEval (63–74)
systemB) background. The confirmed n-grams are highlighted also in the reference, where light green color marks n-grams occurring in both system. • Improving n-grams are confirmed n-grams occurring in only one of the systems. These are highlighted in the system outputs with darker yellow and blue. • Worsening n-grams are unconfirmed n-grams (i.e. probably wrong translations) occurring in only one of the systems. These are highlighted with red. • Diff of the reference and one of the systems: words in the longest common subsequence of the two sentences are underlined in green, other words in red. Although multiple kinds of highlighting and sentences can be displayed simultaneously, users usually use checkbox options to enable only those they are currently interested in. One can for example hide everything except for the references with confirmed n-grams highlighted in light yellow, blue and green (for n-grams occurring in systemA only, systemB only and both systems, respectively). Highlighting the improving and worsening n-grams is also very useful because these are the “culprits” of the BLEU scores differences. Diff is useful e.g. for checking word-order differences (an n-gram may be confirmed, but not underlined in green because it is not in the same position as in the reference).
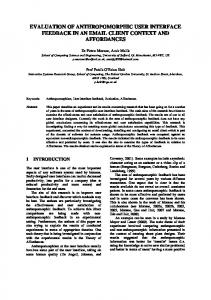
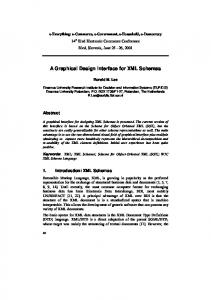
Figure 4. Evaluation panel for bootstrap resampling
69
PBML 104
OCTOBER 2015
3.3. Statistics pane (Bootstrap resampling) This pane shows four area charts depicted at Figure 4 and all document-level metric scores (not depicted here). The bottom two charts show (non-paired) bootstrap resampling (Koehn, 2004) for systemA and systemB, respectively, to assess BLEU confidence intervals for the individual systems. The x-axis lists 1,000 resamples (generated from the original testset) sorted by their (document-level) BLEU, which is the y-axis. The upper right chart shows paired bootstrap resampling (Koehn, 2004), where the x-axis lists 1,000 resamples and the y-axis is the difference in BLEU between systemA and systemB for the given resample. One-tailed p-value is in the chart header. The upper left chart shows sentence-level BLEU difference (y-axis) for all the sentences in the testset (x-axis).11 3.4. Confirmed and unconfirmed n-grams panes MT-ComparEval counts how many times was an n-gram seen as improving for systemA (as defined in 3.2) in the whole testset. The top ten n-grams are shown in table “systemA wins” in the Confirmed n-grams pane (there are four such tables: for 1-grams up to 4-grams, but Figure 5 shows only the 1grams). Similarly, the “systemB wins” table shows the top ten n-grams improving systemB. Unconfirmed n-grams work analogically for n-grams worsening systemA/B (the tables are labeled “systemA/B loses”). The user can click on any n-gram in the tables Figure 5. Confirmed 1-grams overview. to see all sentences containing the n-gram (with the n-gram highlighted). In near future, we would like to improve this pane to show the difference of current “systemA wins” and “systemB wins” scores for each n-gram, so the top 10 n-grams shown are more informative about the real problems and differences in the two systems. 11 According to this chart in Figure 4, about third of the sentences are translated better by Neural-MT (green area), third by uedin-jhu-phrase (red area) and for the last third the BLEU difference is negligible (or exactly zero). Also the confidence intervals in the bottom two charts are overlapping. Note that those two observations are not enough to conclude that the BLEU difference is not significant. For such claim we need a proper significance test, e.g. by paired bootstrap resampling, as shown in the upper right chart, which says that Neural-MT wins in only 36.7% of the resampled testsets, so it is worse than uedin-jhu-phrase, but not significantly (p-value=0.367 is higher than the conventional threshold 0.05, marked by the vertical red line at 95%).
70
Klejch et al.
MT-ComparEval (63–74)
4. Back-end The back-end is responsible for monitoring a particular directory for new experiments and systems. The directory has to be specified in a configuration file. Consequently, a new experiment has to be imported in a new directory containing the source and the reference, and several sub-directories, one for each task (system). Additionally, metadata files allow adding names and descriptions to the imported experiments and tasks. Once a new experiment directory or task sub-directory is detected, a set of background processes make sure that the sentences are analyzed and evaluated by the metrics and statistics. The sentences and the pre-computed results are entered into the database, so that they can be displayed without re-computation. Sentences can be imported with conventional file moving options (scp, sftp). One additional possibility for fixed development cycles of wider development communities, is to sync the development translations with a storage cloud or a version management system, such as git, and include the commit ID in the description of each task. This has been tested in practice within the QTLeap project.12
5. System Description 5.1. Requirements and installation MT-ComparEval has been designed and implemented to run in a Linux environment based on common free software utilities. The basic requirements needed to run MT-ComparEval are PHP 5.4 and SQLite 3.13 In the basic installation, no webserver is required to run MT-ComparEval because a simple webserver packaged with PHP is available. In a more optimized installation, webservers like Apache or Nginx can be also used.14 Database storage can be optimized through the use of more robust database engines, such as MySQL or MariaDB. Concerning the installation, MT-ComparEval comes with a script bin/install.sh that installs locally all required PHP packages. After the installation is finished, there are two scripts that are needed to run MTComparEval. First, bin/server.sh, which runs the application on localhost:8080. Second, bin/watcher.sh, which monitors the data directory data and imports all new experiments and tasks added to this folder.
12 http://qtleap.eu/ 13 https://php.net/
and https://www.sqlite.org/
14 http://httpd.apache.org/
and https://www.nginx.com/
71
PBML 104
OCTOBER 2015
5.2. Implementation MT-ComparEval is an open-source tool developed in PHP, based on the Nette framework.15 This provides an architecture with a set of de-coupled and reusable PHP components, which is highly extensible. The visual interface is organized by a template engine, whereas there is easy access to the database and error logging. The modular interface can allow several extensions, such as the easy inclusion of additional automatic metrics. The development process has been organized via a Git repository,16 so that it can continue as a community effort. All insights and ideas for extensions and improvements are collected as GitHub issues.
6. Summary and Further Work We have outlined the main functionality of the evaluation panel and back-end of MT-ComparEval. The system includes several functions for aiding the process of evaluating systems with automatic scores, pairwise bootstrapping etc. Although the evaluation interface already offers a vast amount of evaluation functions, we consider its expansion with more automatic metrics, which could possibly focus on specific issues and phenomena. Additionally, the possibility to have it run as a multi-user environment, where registered users can upload their systems’ output and organize them in projects or based on their language pair, is considered to be a valuable extension. Finally, a set of exporting functions for tables and images in common flexible formats (comma-separated values, LaTeX, PDF) would be useful for aiding the authoring of academic papers and project reports.
Acknowledgments This work was supported by the grants FP7-ICT-2013-10-610516 (QTLeap), SVV 260 104, and it is using language resources hosted by the LINDAT/CLARIN project LM2010013 of the Ministry of Education, Youth and Sports.
Bibliography Aziz, Wilker, S Castilho, and Lucia Specia. PET: a Tool for Post-editing and Assessing Machine Translation. In Eighth International Conference on Language Resources and Evaluation, pages 3982–3987, Istanbul, Turkey, 2012. URL http://wilkeraziz.github.io/dcs-site/ publications/2012/AZIZ+LREC2012.pdf. Berka, Jan, Ondřej Bojar, Mark Fishel, Maja Popović, and Daniel Zeman. Automatic MT Error Analysis: Hjerson Helping Addicter. In Proceedings of the 8th International Conference 15 http://nette.org 16 https://github.com/choko/MT-ComparEval
72
Klejch et al.
MT-ComparEval (63–74)
on Language Resources and Evaluation (LREC 2012), pages 2158–2163, İstanbul, Turkey, 2012. European Language Resources Association. ISBN 978-2-9517408-7-7. Bojar, Ondřej, Christian Buck, Christian Federmann, Barry Haddow, Philipp Koehn, Johannes Leveling, Christof Monz, Pavel Pecina, Matt Post, Herve Saint-Amand, Radu Soricut, Lucia Specia, and Aleš Tamchyna. Findings of the 2014 Workshop on Statistical Machine Translation. In Proceedings of the Ninth Workshop on Statistical Machine Translation, pages 12–58, Baltimore, USA, 2014. ACL. URL http://www.aclweb.org/anthology/W/W14/W14-3302. Bojar, Ondřej, Rajen Chatterjee, Christian Federmann, Barry Haddow, Matthias Huck, Chris Hokamp, Philipp Koehn, Varvara Logacheva, Christof Monz, Matteo Negri, Matt Post, Carolina Scarton, Lucia Specia, and Marco Turchi. Findings of the 2015 Workshop on Statistical Machine Translation. In Proceedings of the Tenth Workshop on Statistical Machine Translation, pages 1–46, Lisboa, Portugal, September 2015. Association for Computational Linguistics. URL http://aclweb.org/anthology/W15-3001. Callison-Burch, Chris, Cameron Fordyce, Philipp Koehn, Christof Monz, and Josh Schroeder. (Meta-) Evaluation of Machine Translation. In Proceedings of the Second Workshop on Statistical Machine Translation, pages 136–158, Prague, Czech Republic, June 2007. ACL. Clark, Jonathan H., Chris Dyer, Alon Lavie, and Noah A. Smith. Better Hypothesis Testing for Statistical Machine Translation: Controlling for Optimizer Instability. In Proceedings of the 49th Annual Meeting of the Association for Computational Linguistics: Human Language Technologies, pages 176–181, Portland, Oregon, USA, June 2011. Association for Computational Linguistics. URL http://www.aclweb.org/anthology/P11-2031. Federmann, Christian. Appraise: An Open-Source Toolkit for Manual Phrase-Based Evaluation of Translations. In LREC 2010, pages 1731–1734, Valletta, Malta, May 2010. European Language Resources Association (ELRA). ISBN 2-9517408-6-7. URL http://www.lrec-conf. org/proceedings/lrec2010/pdf/197_Paper.pdf. Giménez, J and L Màrquez. Asiya: An Open Toolkit for Automatic Machine Translation (Meta-)Evaluation. The Prague Bulletin of Mathematical Linguistics, 2010. URL http://ufal. mff.cuni.cz/pbml/94/art-gimenez-marques-evaluation.pdf. Girardi, Christian, Luisa Bentivogli, Mohammad Amin Farajian, and Marcello Federico. MTEQuAl: a Toolkit for Human Assessment of Machine Translation Output. In COLING 2014, pages 120–123, Dublin, Ireland, Aug. 2014. Dublin City University and ACL. URL http: //www.aclweb.org/anthology/C14-2026. Koehn, Philipp. Statistical significance tests for machine translation evaluation. In Lin, Dekang and Dekai Wu, editors, Proceedings of the 2004 Conference on Empirical Methods in Natural Language Processing, pages 388–395, Barcelona, Spain, 2004. ACL. Koehn, Philipp. An Experimental Management System. The Prague Bulletin of Mathematical Linguistics, 94:87–96, 2010. doi: 10.2478/v10108-010-0023-5. URL http://ufal.mff.cuni. cz/pbml/94/art-koehn-ems.pdf. Koehn, Philipp, Wade Shen, Marcello Federico, Nicola Bertoldi, Chris Callison-Burch, Brooke Cowan, Chris Dyer, Hieu Hoang, Ondrej Bojar, Richard Zens, Alexandra Constantin, Evan Herbst, and Christine Moran. Open Source Toolkit for Statistical Machine Translation. In Proceedings of ACL, pages 177–180, Prague, Czech Republic, June 2006. 73
PBML 104
OCTOBER 2015
Papineni, Kishore, Salim Roukos, Todd Ward, and Wei-Jing Zhu. BLEU: a method for automatic evaluation of machine translation. In Proc. of ACL, pages 311–318, Stroudsburg, PA, USA, 2002. ACL. URL http://dx.doi.org/10.3115/1073083.1073135. Popović, Maja. Hjerson: An Open Source Tool for Automatic Error Classification of Machine Translation Output. The Prague Bulletin of Mathematical Linguistics, 96:59–68, 2011. doi: 10. 2478/v10108-011-0011-4. URL http://ufal.mff.cuni.cz/pbml/96/art-popovic.pdf. Riezler, Stefan and John T. Maxwell. On Some Pitfalls in Automatic Evaluation and Significance Testing for MT. In Proceedings of the ACL Workshop on Intrinsic and Extrinsic Evaluation Measures for Machine Translation and/or Summarization, pages 57–64, Ann Arbor, Michigan, June 2005. Association for Computational Linguistics. URL http://www.aclweb.org/anthology/ W/W05/W05-0908. Zeman, Daniel, Mark Fishel, Jan Berka, and Ondřej Bojar. Addicter: What Is Wrong with My Translations? The Prague Bulletin of Mathematical Linguistics, 96:79–88, 2011. ISSN 0032-6585.
Address for correspondence: Martin Popel
[email protected]
Institute of Formal and Applied Linguistics Faculty of Mathematics and Physics, Charles University in Prague Malostranské náměstí 25, 118 00 Praha 1, Czech Republic 74