CLIN. CHEM. 41/8(B),
1248-1255
(1995)
#{149} Beckman
Mu Itivariate Receiver-Operating Screening as an Example Edward
K.
Conference
Characteristic
this include
introduction
a multivariate
of a new methodological extension
to
a current
techanalytical
technique, receiver-operating characteristic (ROC) curve analysis (MultiROC analysis). This extension to ROC methodology allows the comparison of composite test rules in a format similar to that of ROC curves. Statistical properties, guidelines for use, and a detailed example are described. MultiROC is used in the outcomes analysis of the
value
of screening
for prostate
cancer.
The
effect
of
age and different test decision thresholds are examined in an extension of a previously published outcomes analysis. The results indicate that the variations in test performances caused by these components are important in assigning a final cost:benefit ratio of screening for
prostate
cancer.
Terms: decision assessment/prostatic
Indexing come
frees/decision diseases/mass
support techniques/outscreening/MultiROC
Society has increasingly emphasized evaluation of long-term costs and outcomes care. Consistent with this is an evolution
the critical in medical of laboratory
analysis of test performance to include these concepts. Outcomes analysis of current laboratory testing procedures could significantly change current practices. Consider reference ranges that are typically derived from the middle 95% of a nondiseased population. In practice, clinicians use the values as action thresholds in deciding whether the patient is diseased or not. Do the action diagnosis
thresholds or the cost
reflect of a falsely
the cost positive
of a missed diagnosis and
subsequent workup? After subtraction of these costs from the benefits received by patients diagnosed correctly, what is the net value derived from the decision threshold? Would another decision threshold give more value? These questions are not easily answered, requiring analyses rarely done in the laboratory. Yet in an era of constrained resources, it is crucial to focus on these questions and other laboratory practices to determine the ultimate benefits received. New challenges require new tools. This paper will try to provide an approach to answering the above questions first by introducing a new methodological techInformation Science, Dartmouth-HitchCenter, Lebanon, NH, and 1 Department of Veteran Affairs Medical Center, White River Junction, VT 03756. ‘Address for reprints and correspondence. Fax 603-650-4845; E-mail
[email protected]. Received February 22, 1995; accepted May 2, 1995. Program
in Medical
cock Medical
1248
Analysis:
Prostate
Cancer
Shultz
The evolution of test performance analysis should include the long-term costs and benefits associated with testing. Evolutionary laboratory techniques to achieve nique,
Curve
CLINICAL
CHEMISTRY,
Vol. 41, No. 8(B), 1995
nique and second by providing an example examining the long-term costs and outcomes of different decision levels. The first section will present a multivariate extension to a current analytical technique, receiveroperating characteristic (ROC) curve analysis, with appendicitis and prostatic disease as examples.2 The second will perform an outcomes analysis examining the impact of different decision levels on the cost: benefit
ratio
Multivariate
in screening
for prostate
ROC Curve Analysis
cancer.
(MuItiROC)
ROC analysis has gained popularity in laboratory medicine over the last 30 years as a powerful tool for evaluating test performance. Originally a method for evaluating falsely positive and truly positive interpretations of signals on radar screens, the technique was adopted by radiologists (1,2) and subsequently laboratory scientists as a means to evaluate the sensitivity and sjecificity of medical tests over a variety of decision thresholds. In contrast to reference ranges, which are test result intervals statistically derived to reflect only the range of values found in a specific normal population, ROC curves simultaneously show the proportion of both diseased and nondiseased subjects correctly diagnosed at various test cutoff points. This graphical display not only facilitates the selection of an optimal threshold but also enables easy comparison of different tests. Multiple papers have increased the utility of the ROC curve by developing statistical measures to compare ROC curves and single points on these curves. These techniques have been summarized with emphasis on the techniques of interest to the laboratory scientist (3, 4). Although mathematics has added power and statistical exactitude to the interpretation of ROC curves, the simple, graphical display of the tradeoff
easily between
interpretable sensitivity
and specfficity at each decision threshold remains the major strength of these curves. While ROC curves offer significant gains in test performance evaluation, they address a subset of all medical testing decisions. They are limited to the display of the performance of a single test, or the comparison state. In
of single tests, for the detection of a disease medicine, it is recognized that a group of results often offers more sensitivity or specificity than any of the individual tests, depending upon the particular way the test results are combined and interpreted 2Nonsdard
abbreviations:
ROC,
receiver-operating
teristic; MultiROC, multivariate receiver-operating tic; WBC, white blood cell; PSA, prostate-specific prostatic acid phosphatase; TRUS, transrectal and DRE, digital rectal examination.
charac-
characterisantigen; PAP, uhtrasonography;
5-7). Although powerful statistical techniques such as inear discriminate analysis and logistic regression ffer the ability to combine test results, they have had )nly limited popularity at individual hospitals, in part ecause of the statistical expertise necessary to use ;hem, and in part because they have not provided the ntuitive, easily interpreted graphs available in ROC malysis. Laboratory scientists have developed many rules for ;he interpretation of clusters of tests, but the precision chieved by the laboratory professional in interpretaion of individual tests is lost when multiple test esults are combined to form a diagnostic impression. )ne is rarely able to give the sensitivity and specificity an interpretation involving multiple tests, and typcally these rules either are created in collaboration vith a statistician or have evolved over years of expeience. It would clearly be desirable for the clinician tnd laboratory scientist to be able to analyze the erformance of their own decision rules on data from heir own institutions and perhaps to refine rules )ased on the This report
results of their analyses. introduces a new extension
to
ROC
urves that is designed to address these needs. In the nodel proposed, a simple graphical method of combinng tests into rules is presented, allowing comparison of lifferent rules over varying test thresholds, as is found n traditional ROC analysis. As will be demonstrated, ise of this method, MultiROC, allows quick refinement f decision rules to derive rules with superior diagnosic performance. An example and guidelines for inter)retation of MultiROCs will be presented.
IuftiROC
Methods
Review of ROC analysis. In traditional ROC analyis, each patient is categorized by some “gold standard” o have or lack a specific attribute, typically the diagiosis of a disease. A test (usually less expensive than he gold standard in financial or health cost) is then xamined for its diagnostic performance by using a plot f the sensitivity (true-positive rate) on the y-axis vs alse-positive rate (1 specificity) on the x-axis. The urve is generated by choosing all possible test decision utoffs and graphing the result. This results in a curved line from x,y coordinates 0,0 o 1,1 (Fig. 1). In Fig. 1, three tests have been examined or their performance in diagnosing appendicitis. Each point on the ROC curves represents a different decision hreshold. A test without discrimination would result ri a straight line from 0,0 to 1,1. A test that achieves lerfect diagnostic discrimination for a specific decision hreshold will form a right-angle graph, going from 0,0 o 0,1 (where sensitivity equals 100% and there are 0 alse positives) to 1,1. For two ROC curves that do not verlap, comparison of the areas under the curves can e used to decide if one test is superior to the other, by ising statistical results developed elsewhere (3). Likerise, by comparison of individual points on two curves I is possible to determine whether statistically signifcant differences are present (3). Thus, the ROC curve -
0.9 0.8 0.7 -
-
-
WBC Count Neutrophil
0.5 0.4
-
Band form %
0.3
0.2 0.1
0 0
0.2
0.4
0.6
0.8
1 Specificity -
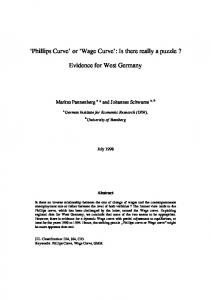
Fig. 1. ROC curves of individual tests for appendicitis. Each point on each curve represents the test performance decision threshold jr deciding if appendicitis is present.
for a different
is a useful visual guide to performance of a test both alone and in comparison with other tests. In Fig. 1, the visual interpretation is that the white blood cell (WBC) count is overall a better test for the diagnosis of appendicitis than is the percentage of W.BCs that are band forms. Although whether the apparent superiority is statistically significant remains to be answered, the qualitative result is readily apparent. Construction of the MultiROC curve. In MuItiROC, a diagnostic rule is created from multiple tests, and the threshold of an individual component contained in the rule is varied to create the curve. The rule will typically consist of a Boolean expression (i.e., containing “and,” “or,” “not”) of different tests related by algebraic operators (addition, subtraction, multiplication, division, equivalence, less than, greater than) as the components of the expression. Each component of the rule is fixed at a diagnostic threshold except for one threshold, which is varied over all of its possible values, and the corresponding sensitivities and false-positive rates are plotted (e.g., “Diagnose as positive for the disease if test 1 is >100 or test 2/test 3 is greater than a variable threshold.”). From the curve created, one can determine whether the rule component being varied can potentially improve diagnostic performance over the rest of the rule, whether the improvement is statistically significant, and how many diagnoses will be affected. Rules incorporating additional tests can likewise be constructed, and comparison with previous rules will indicate whether there is any potential incremental gain in sensitivity or specificity. Visual interpretation of the MultiROC curve. Although the curves generated are similar in many respects to ROC curves, some unique properties assist in interpreting MultiROCs. Because a single variable is changed to create a Mu1tiROC, a single graphical segment will always be formed, as short as a single point or potentially a curve extending from where the CLINICAL
CHEMISTRY,
Vol. 41, No. 8(B), 1995
1249
sensitivity and false-positive rates equal 0 to where they equal 1, which is always true for a ROC curve. To evaluate visually the contribution of the parameter being varied to the total rule, one can construct a rectangle with the two ends of the curved segment placed at opposing corners (Fig. 2). Interpretation within this rectangle is similar to a conventional ROC curve. If a straight line is formed between the two corners, then the parameter being varied adds no diagnostic information beyond chance alone (see Appendix). If it forms a right angle to the upper left hand corner of the rectangle, then the threshold at the upper left corner perfectly diagnoses a subset of the population that is not correctly diagnosed by the other parameters of the rule. As with a ROC, the greater the area under the curve but within the rectangle, the better the overall performance of the parameter being examined (8). The height and width of the rectangle formed give a direct indication of the proportion of cases diagnosed by the test being varied (e.g., MultiROCs that form higher rectangles will affect a greater proportion of ill patients, whereas wide rectangles will affect a greater proportion of well patients). A MultiROC consisting of a single point implies that the test being varied will not change the diagnosis of any patients and therefore is not a useful addition to the rest of the existing rule. Not all cases are affected by the parameter being varied, because the fixed part of the rule may have already diagnosed the case as disease positive or negative. Statistical interpretation of the MultiROC curve. The area under a ROC curve has been used to compare the overall performance of two tests, or whether a test performs better than chance alone (8). Similarly, comparison of the areas under two MultiROCs may be useful in determining which of two additional tests offers the most diagnostic gain to a rule. Drawing the rectangle framing the ends of the MultiROC curve (as described above and observed in Fig. 2) is mathematically equivalent to isolating the fraction of the popula-
0.98 0.96
2
4
6 :1
0.94 p0.92
0.9 Cl)
If WBC10 000 orBand form % variable
-‘---
0.88 -
0.86
-
-
MuIIIROC Interpretation Rectangle
0.84
over less
each area
0.8 0
I
I
0.2
0.4 1
I
-
0.6
0.8
Specificity
Fig. 2. MuItiROC. Each number along the curve indicates a different value for the vanable threshold (i.e., the percentage of band forms) contained in the rule. If the rule is true, then it is interpreted as positive for diagnosing appendicitis. See text for interpretation of the dashed box.
CLINICAL
CHEMISTRY,
Vol. 41, No. 8(B), 1995
other beneath
(Fig. 1). In these it may represent
cases, the
a curve preferred
wit) test
depending on the desired sensitivity and specificity. Software tools. MultiROCs can be generated by ape cialized or generalized computer programs. Most full featured spread sheets today are capable of the neces sary calculations and the requisite plotting of results All graphs presented here were calculated by use o Microsoft EXCEL (Microsoft, Redmond, WA). Data source. As a test case, a well-known data se from the literature was examined by the use of Multi ROC. Marchand et al. (9) examined the laboratory testi from 106 consecutive patients operated on for sus pected appendicitis. They previously published thl smoothed individual ROC curves of each test for thl diagnosis of appendicitis, and three exact ROCs an presented in Fig. 1. In the following discussion, onl the total WBC count and manually counted band-forn percentages are analyzed.
MuftiROC
0.82
1250
tion that is being diagnosed by the individual param eter being varied (see Appendix for further details) Within this rectangle, if one scales it to a 1 x 1 square one can calculate the area under the curve and procee by using the standard methods previously described fo: the comparison of areas under a ROC curve (3, 8). J U-test, Wilcoxon test, or Mann-Whitney test (all pro duce equivalent results) can be performed on thi: subset of the total population to determine if th parameter being varied adds statistically significan discrimination beyond chance to the rest of the rule. Another question is whether two points, on separati curves, are statistically different. Usually, points ar chosen where either sensitivity or specificity is equal and the significance of the different estimates for th other parameter is examined. Comparison between i ROC and a MultiROC as well as between two Multi ROCs is possible. Subjects and test specimens for eaci ROC or MultiROC should be identical to ensure tha subtle errors in population selection will not bias re sults. As always, the subjects selected for testini should be representative of the population that wil eventually be diagnosed by the tests in question. Th methods are identical to those between two RO( curves and are further described in the Appendix. Use of the area under a ROC or a MultiROC curve ii often not appropriate in laboratory medicine. Becausi the underlying distribution of test values found ii laboratory tests is rarely symmetrical and of equa variance between populations, curves for the sami disease but derived from different tests will often cros
Results
The first MultiROC constructed used the rule, “Con sider the test positive for appendicitis if the WBC coun is 10’#{176}IL or the percentage of WBCs that are ban forms is greater than or equal to a variable to bi determined,” where all band-form percentage value from 0 to 100 are examined. Interpreting Fig. 2, we sei the performance tradeoff of the composite rule for al selected cutoff band-form percentage values.
Each
point
on the
curve
represents
mance resulting from selecting the variable part of the rule. the curve labeled 6 corresponds
the
a different Specifically, to the
rule
perfor-
threshold for the point of rule, “Consider
the test positive for appendicitis if the WBC count is >10101L or the percentage of WBCs that are band forms is >6%.” Because the morbidity of operating for a nonexistent appendicitis is less than that from peritonitis, it is reasonable to select a decision rule that emphasizes sensitivity at the expense of specificity. Note that only above 10% does the sensitivity drop off. Of the 27 cases with WBC values s1010fL, 12 are from patients with proven appendicitis. One can use either the area under the curve within the box shown in Fig. 2 or the Mann-Whitney U-test to show the band-form percentage values from these 27 patients add discriminatory value above that of the fixed WBC threshold value of 10101L alone (P 10#{176}/Land have therefore already been categorized. Selecting
a threshold
of 10%
band
forms,
a logical
next question would be to examine the WBC cutoff in our rule to optimize its decision threshold. Fig. 3 shows the MultiROC of the rule, “If the WBC count is greater than or equal to a variable (to be determined) or the band-form percentage is 10%, then we conclude that appendicitis is present.” As Fig. 3 shows, if the rule is, “Consider laboratory tests positive for appendicitis if the WBC count is 8.8 x i0/L or the band-form percentage is 10%,” then a
sensitivity of 99% and a specificity of 57% are obtained from this data set. It is not necessary to stop at this point, because more complex rules involving ratios or more tests are possible. This brings out the power of the MultiROC concept, for one can use and refine any rule with which one is familiar or that makes medical sense. The performance of the final rule should be statistically compared with simpler rules to determine if significantly greater discriminatory ability has been added. The use of Mu1tiROC helps to avoid illusory performance gains from panels of tests. As can be seen from the data of Chan (10), the combination rule for positives, “If the prostate-specific antigen (PSA) is >4.0 or the prostatic acid phosphatase (PAP) is greater than a variable threshold,” offers more sensitivity (91%) than using the PSA threshold of 4 g/L alone. However, as seen in Fig. 4, there is no advantage in combining the two tests. The MultiROC has performance equivalent to that of PSA alone at only two points and is inferior at all other PAP thresholds.
MuItiROC
Comments
Because diagnostic decisions combining multiple tests are commonly encountered in medicine (5-7), the ability to compare their relative performance across a variety of decision thresholds is as desirable as the ability to compare individual tests. The utility of ROC analysis has been limited by the fact that it examines only one test at a time. A MultiROC compares the performance of multivariate rules, rather than individual tests, and yet retains the simplicity of interpretation of the ROC curves. It has been suggested that decision rules will be ignored if they are not understandable, even if demonstrated to perform correctly (11). MultiROC avoids this danger by allowing the user to create his or her own intuitively correct niles, although it does not guarantee that the optimal combination of tests will be chosen. Where statistical exactness is desired, the host of statistical tools previously created for the ROC curve are adaptable and
0.98 0.96
0.9 0.94
0.8
.to.92
0.7
0.9
-
c0.88
-
-
-
WBC Count
0.5
Band form % 10 or WBC Variable
-
0.86
PSA VarIable
0.4 -
0.3
0.84
-
PSA4
-
or I’AP
0.2
0.82
Variable
0.1
0.8 0
0.2
0.4
1
-
0.6
0.8
0
1
0
Specificity
Fig. 3. MuItiROC and ROC curves. Interrupted fine, ROC curve for WBC count; heavy line, MultiROC curve for the rule. In this case, the rule is, “Diagnose appendicitis if the band-form percentage is 10% or Ifthe WBC count is greater than or equal to a variable threshold.” The best variable point appears to be a WBC count of 8.8 x 10#{176}/L.
0.2
0.4
0.6
0.8
1
1- Specificity Fig.
4. Prostatic
MuItiROC
and
ROC
curves
compared.
The rule combining PSA and PAP concentrations is inferior at all but terminal points to the use of PSA concentrations alone. There is no benefit in using the rule, no matter what PAP concentration is chosen as part of a rule.
CLINICAL CHEMISTRY, Vol. 41, No. 8(B), 1995
1251
applicable MultiROC
to MultiROC (3). A second strength concept is the ability to build on
of the previous
rules to derive rules with superior performance. Finally, as with other types of statistical analysis, this method provides insight into the relative pathophysiological importance of the parameters used in the creation of rules. For instance, the example suggests that the WBC differential adds important information beyond simply knowing whether the total WBC count is above or below i0’#{176}IL in the diagnosis of appendicitis. A categorical test (i.e., data that are not quantifiable, such as the presence or absence of a morphologic feature on a tissue stain) can be incorporated into a rule also but results in a single point(s) if it is the parameter varied. For this reason, it is more useful to vary the other parameters of a rule containing categorical data. For example, a Boolean nile that specifies, “If a positive psoas test is present and the WBC count is greater than a variable threshold,” will result in a MultiROC even though the psoas test is not quantitative. Categorical semiquantitative data, even though not evenly ordered, can be treated as any other quantitative variable. Thus, the use of “0, 1+, 2+, 3+” or “none, few, many” to describe a parameter such as iron stores on a bone marrow slide or the presence of eosinophils on a tissue section is completely compatible with the MultiROC method. A common problem with statistical methods is lack of independence among the various tests being combined. Results of analysis from highly correlated tests are typically imprecise, leading to large errors of estimation, The lack of independence of individual tests in rule-based systems has been rarely addressed. In the case of MU1tiROC, the structure of the rule will be a factor in how reliable the results are. In general, when each component of a nile separated by “and” or “or” contains a single test, such as the rule in Fig. 1, the rule will result in relatively stable performance even when the tests are highly correlated. When two or more tests are contained in a component of the rule, the result begins to be subject to the problems found with traditional statistical procedures. If a rule derived by MultiROC is, “Diagnose positive if test A/test B >100 or test C is greater than variable,” the performance of the rule is more sensitive to a high correlation between tests A and B than between test C and either of the other two. A MultiROC can answer whether a new test should replace an older test, be used in combination with the older test, or form a component of a larger panel with the older test. Two identical ROC curves do not allow one to determine whether the two tests are duplicates of each other (and hence the more expensive should be discontinued) or whether the tests address different subsets of the total population so that the combination of the two tests may offer superior performance. MultiROCs will allow discrimination between these two alternatives by using the medical intuition of the laboratory scientist as a guide in the creation of reasonable rules. 1252
CLINICAL
CHEMISTRY,
Vol. 41, No. 8(B), 1995
Although multivariate statistics is accepted to be a complex subject, the traditional simplicity of ROC analysis has been preserved with Mu1tiROC. A single glance at a MuItiROC reveals the performance of the rule as a whole and the worth of the particular component being examined. The number of cases affected by the new component is graphically displayed, and comparison with tests of no discrimination and perfect diagnostic ability on that subset of cases is readily apparent. A danger in the creation of a MultiROC is the ability to refine a rule only for a particular data set and therefore derive too optimistic an evaluation of its general performance. This problem in predictive analysis exists anywhere the set of data used to derive diagnostic rules is also used to evaluate their performance. The danger is decreased by deriving the rule from part of the data set and using the remaining data to evaluate the rule. Another method is “leaving one out,” where the rules are developed but a sample is left out of the analysis. The single sample is then diagnosed by the rule. This process is done successively for every point in the database, and a final estimate of the sensitivity and specificity of the rule is obtained. This method, called jackknifing (12), provides a more accurate estimate of the true performance of the diagnostic rule achieved but, to be practical, requires a computer. Other methods include bootstrapping (12) and, potentially, smoothing of the curves constructed. I am unaware of a suitable method for smoothing the curves created by MultiROC currently. Hopefully, these or other methods can be incorporated into programs dedicated to calculating MultiROCs. Contained in the MultiROC concept is simultaneous variation of more than one threshold in the rule. This create a graphical area with the traditional ROC rather than a single-line segment. Interpretation and refinement of this extension are potential areas for exploration. Computer demands would be significantly greater than those of the more limited Mu1tiROC presented here. would axes,
MuItIROC
Analysis
in Outcomes
Analysis
of Prostatlc
for
older
Screening Prostate
screening
programs
men
than
50
years are increasing each year and are at least partly responsible for a sixfold increase in radical prostatectomies between 1984 and 1990. Although a significant number of men die each year from prostate cancer, in a much larger number their prostate cancer remains indolent. In addition, screening is expensive and there are significant morbid side effects to surgical treatment for prostate cancer. As a result, studies have called into question the overall cost effectiveness of prostate screening (13-15). Although these studies typically compare different sequential test strategies, they have not examined the effect of different test decision thresholds on the overall results. Another issue ignored is that, studies
although have not
results are often stratified considered the differences
by age, the in PSA test
performance that result from the different specificity of PSA at different ages. This article extends a previously published outcomes analysis (15) to include the effect of choosing different PSA decision thresholds. In the prior study, the dollar costs per life-year saved were examined with two strategies. In the first strategy, it was assumed that men ages 50-70 years would undergo a screening PSA evaluation and would be followed up by transrectal ultrasound (TRUS) evaluation and digital rectal examination (DRE) if the screening PSA was >4 gfL. Those positive by PSA and one of the other tests would receive a biopsy, and patients with positive biopsies would undergo radical prostatectomy. In the second strategy, there would be no screening procedure, and patients would be dealt with when prostatic carcinoma appeared clinically, with the use of radiation and hormonal therapy for symptomatic relief. The estimated aumber of life-years lost were calculated on the basis of the patients’ normal expected life span and the expected life span based on the two strategies. With an iterative process [Markov model (16)1, the costs and Life-years were incrementally computed each year, and the cost per life-year saved was computed. The overall undiscounted incremental costs per life-year over no screening varied from $47 000 at age 50 to $102 000 at age 70 years. The effects of many of the parameters were examined for impact on the final result (sensitivity analysis). However, the sensitivity of the results to different decision levels (i.e., different than 4 g/L) was uot analyzed. In addition, the fact that test performance can be expected to vary with the patient’s age was not taken into account. This is potentially an important variable to examine. Although younger men have a lower incidence of prostatic cancer, this is offset by their lower PSA concentrations (17), increasing the specificity of PSA determination in a group who have the most to be gained by an early correct diagnosis. The prior study was therefore extended to include analysis assuming various thresholds in differing age groups. The model was replicated by using the publication 15) and a supplemental report describing its details. The detailed decision model and methods are available as document 05144, National Auxiliary Publication Service, P.O. Box 3515, Grand Central Station, New York, NY 10163-3513.) The present study adopted their assumptions and calculations and should not be regarded as an independent assessment of its validity. Fig. 5 shows a decision tree of the decision model that was implemented. The square box indicates where the wo strategies diverge. Circles indicate where different results occur based on estimated probabilities. For the 15 years after the beginning of the model, all patients are followed annually to see whether they remain well, have cancer without or with progression, or have a cancer or a noncancer-related death. The probability of each event represents the best estimates of results found in the literature by the authors of the previous paper and were adopted with as little change as possible for this paper. The costs associated with the two
Ba Test
DecIsIon
+
Tx
+
I
Bi
B2 Marlcov
-
Al
A2 Bi
82 Fig. 5. Prostatic screening decision tree. The decision tree shows alternative strategies that branch at the square box. The lower branch assumes no screening, and that disease Is treated symptomatically as symptoms appear. The upper branch evaluates with a screening program, followed by radical prostatectomy for biopsy-positive cases. Al through B2 represent different cancer stages. The Markov model Is an algorithm that evaluates costs and life-years gained as patients sequentially stay unchanged, progress, or die each year. It repeats for 15 years.
strategies were also evaluated, allowing the ratio of cost per life-year saved to be calculated. Life tables from 1990 were used as the source of life expectancy estimates (18). Age-specific estimates of the distribution of PSA in apparently healthy men were adopted from the report of Oesterling et al. (17). The stage distribution of PSA in men with prostatic cancer was taken from the report of Hudson et al. (19). An estimate of the combined sensitivity and specificity of the whole screen [PSA, TRUS, and DRE combined] was done by first combining tests while assuming conditional independence of the individual components and then adjusting the totals by multiplying by a single correction factor the totals observed when multiple tests
were
used
in
a screening
program
(15,20).
This
procedure
allows for test covariance where it is not known more exactly. With the two sets of data, agecorrected estimates of the sensitivity and specificity of the MultiROC rule, “If either TRUS or DRE is positive and the PSA is greater than a variable decision cutoff, then the screen is positive,” were derived. These derived estimates of sensitivity and specificity were then substituted into the replicated model of Krahn et al. (15) to derive new estimates of the cost per life-year saved.
Outcomes
Modeling
Results
and Comments
The overall cost per life-year saved decreases with an increasing decision threshold at all ages (Fig. 6). The data for men at age 75 years is not graphed because of the estimated net decrease in life expectancy at all decision levels. This differs from the original study by Krahn et al. (15), which found screening expensive but showed a net gain in life expectancy at age 70 years. The difference reflects the poorer performance of the PSA test when adjusted for age. The most benefit is achieved for younger men at decision thresholds that are very specific (i.e., have very few false positives). CLINICAL
CHEMISTRY,
Vol. 41, No. 8(B), 1995
1253
300
-
-
Is
clinically apparent disease. One might assume that their PSA would be higher than that in screening populations and therefore more easily detected. Comrn parison with the limited data from screening populations that are available does not indicate a significant difference (20). However, the overall costs would bE
Age 65 Age 55
-#{176}-
250
-
>09’”....--#{149}--Age45
200
>0.5
0
>3.0
-
150
biased lower than they would be with a true screening population, and the conclusion would be reinforced. II would also be desirable for the positive and negative patients to be drawn from the same population. LargE trials are currently in progress to realize this, but the current data represent the best estimates available.
100 50
>2.5
00.2
0.4 PSA
0.6
1
0.8
Conclusions
Specificity
Fig. 6. Cost per incremental life-year in undiscounted dollars. This is marginal cost per additional life-year relative to no screening. In screening, the most cost-effective strategy results from using different decision levels based upon the patients’ ages. Younger patients have the most to gain from screening, but the overall cost is still high in all groups.
The data from Oesterling et al. contain estimates only up to the 95th percentile (17). Using even higher decision thresholds would probably result in still more cost per life-year gains. The overall cost per life-year is still higher than that generally spent on other programs, making the use of general prostate screening difficult to justify. Because results calculated here are in nondiscounted dollars (not devalued for the costs and benefits occurring in the future), direct comparison with other studies is difficult. The study by Krahn et al. (15) estimated that discounting would more than double the cost per lifeyear gain. By this rough approximation, an example of less expensive treatments per life-year saved is hospital hemodialysis, whereas price range is treatment emia with cholestyramine clusion
as
put
forth
in
technology in a comparable of asymptomatic hyperlipid(21). This is the same conthe
paper
that
was
extended
by
this analysis. Two factors would change this conclusion: If the treatment were more effective with lower morbidity overall, costs would be reduced and the resulting cost:benefit ratio might be within generally accepted fundable limits; or, a method could be developed for more accurate prediction of which carcinomas would eventually cause morbidity and decreased mortality. In a sense, the sensitivity and specificity of the tests described are illusions. They do reflect test performance for detection of prostatic cancer but not for the detection of clinically important prostatic cancer. Much of the cost and morbidity of the screening approach comes from treatment of carcinomas that would not have caused clinical disease in the patients’ lifetime. Although the grade and size of the tumor correlate with eventual outcome, these are both imperfect measures and difficult to ascertain accurately before surgery. Newer analyses, perhaps via ploidy analysis, gene probes, or the presence of specific antigens, may help detect the truly significant cancers. A weakness of this study is that the staged PSA values chosen (19) were not screening values but rather represented the PSA of men going to surgery for 1254
CLINICAL CHEMISTRY, Vol. 41, No. 8(B), 1995
The method presented forms a superset of the features offered by traditional ROC analysis. Incorpora. tion of this method into routine test evaluation offers significant promise for determining the incremental gain offered by new tests as well as the diagnostic utility of existing or potential panels of tests. An example of MultiROC decision analysis based on concepts familiar to the laboratory but absent in a recent prominent outcomes analysis on prostatic cancer was presented. Although the general conclusions ot the prior paper were not changed, the results were significantly affected by consideration of the tradeofi between sensitivity and specificity that is made clear by ROC or MultiROC analysis. Extension of test per. formance analysis to include outcomes is both feasible and necessary if the laboratory professional is to support the needs of patients, physicians, and society.
Appendix Definitions. 1. A MultiROC rule consists of two parts, a fixed proposition and a ROC proposition, connected by “and’ or “or” (e.g., if test A >100 or test B > a variable). When there is no fixed proposition as part of the MultiROC, the MultiROC is a conventional ROC proposition. 2. A fixed proposition consists of 0-n sitions between test variables and constant connected by “and,” “or,” and “not” (e.g., and test A/test B 100 (e.g., cases) tc an inequality
between a test variable and a variable threshold. It maps (a) the fraction of cases in a set to points that satisfr an equality and are tnily positive for an attribute to the y coordinate of each point and (b) the fraction of a truly negative set falsely classified as positive by the inequality to the x coordinate. 4. A MultiROC graph is formed by graphing the sensitivity (y-axis) vs the false-positive rate (x-axis achieved by varying the ROC proposition over all values possible for its variable parameter. Thesis. If one takes the rectangle formed by the end points of a MultiROC and scales it and the interio graph proportionately so as to form a 1 x 1 square then the resulting graph is itself a ROC graph. Proof Let some MultiROC rule consist of a fixe
)roposition
called
:onnected > variable). iegatives be
F and
a ROC
by a logical “or” Let x = (x1. for the attribute
.
proposition
called
R
(e.g., if test A >100 or test B Xml be cases that are truly in question. Let y = ty1 -
that are truly positive. Then, let FPF = x1... x1,} be those in x that satisfy F (the false )ositives). Because the original rule is an “or” rule, ‘}
those
iatisfying
either
proposition
satisfies
the
whole
OC rule. Therefore, FPF = {x1 x,,} lassifled and can be removed from further Ltion. Then [p/rn is the minimal false-positive he MultiROC rule. This forms the left-hand iate of the corner of the rectangle bounding iROC
Multi-
is finally considerrate of x coordithe Mul-
...
curve.
Because the threshold ero or more additional )roposition and ero or more. naximal false ind (fri + n)/m iand corner of ilone are affected
varies cases
in the ROC proposition, in x will satisfy the ROC
will increase the false-positive rate by Then let FPF’ = (x1... x1,,j be the positives mapped by the MU1tiROC rule be the x coordinate of the upper-rightthe rectangle. It can be seen that n cases by the ROC proposition portion of the
4ultiROC
rule. the rectangle bounding the MU1tiROC to a 1 < 1 square will divide all x coordinates by the fracional “width” of the rectangle. Let ([p + x)/m be the x oordinate of a point in the original rectangle for a )articular threshold in the MultiROC graph. Then a icaled x coordinate will be Scaling
([p+x
[p/([p+n
-
rn
-
rn)/m
-
x
rn)n
3ut this is the same as the false-positive rate lubset of n points for the particular threshold; bre,
of the there-
each
x coordinate of each point of the scaled satisfies the definition of a ROC curve. All of the above follows also for the set of truly )ositive cases, and the points mapped in the scaled ‘ectangle satisfy the y coordinate of a ROC curve. Also, tvery statement with a logical “and” can be converted o an equivalent statement with a logical “or” by using he contrapositive. Therefore, the above proof also pplies to Mu1tiROC when “and” is used; i.e., the scaled ‘ectangle is itself a ROC for all MultiROC. Statistical aspects. Within a scaled MultiROC rectrngle, the Wilcoxon (or Mann-Whitney) test is used, or omputation of the area under the curve and confilence regions can equivalently be performed. This will letermine whether the ROC portion of the rule adds
liagnostic value to the fixed portion. It can also be used o determine if one rule is superior to another, assumng that both rules lie within the same rectangle. Between two individual points, one can calculate a ralue from which is determined the level of significance ) of the difference in performance between the two tOCs or MultiROCs at the sensitivity/specificity level question. =
-
fI-1)2/(t+J’)
cases test/rule Data (9) were
that and
were incorrectly correctly labeled
labeled by the
from the studies of Chan (10) and used in the examples presented.
gratefully
by the ROC ROC B test/rule. from Marchland Their contribution
A
et al. is
acknowledged.
References 1. Goodenough D, Rossman K, Lusted L. Radiographic applications of receiver operating characteristic (ROC) curves. Radiology 1974;110:89-95. 2. Swets J. ROC curve analysis applied to the evaluation of medical imaging techniques. Invest Radiol 1979;14:109-21. 3. Beck .JR, Shultz EK. The use of relative operating characteristic (ROC) curves in test performance evaluation. Arch Pathol Lab Med 1986;11O:13-20. 4. Zweig MB, Campbell G. Receiver-operating characteristic (ROC) plots: a fi.mdamental evaluation tool in clinical medicine [Reviewl. Clin Chem 1993;39:561-77. 5. Committee on Rheumatic Fever and Bacterial Endocarditis of the American Heart Association. Jones criteria (revised) for guidance in the diagnosis of rheumatic fever. Circulation 1984;69:203-8. 6. Altman RD, Meenan RF, Hochberg MC, Bole GG Jr, Brandt K, Cooke TDV, et al. An approach to developing criteria for the clinical diagnosis and classification of osteoarthritis. J Rheumatol 1983;10: 180-3. 7. Tan EM, Cohen AS, Fries .JF, Masi AT, McShane DJ, Rothfleld NF, et al. The 1982 revised criteria for the classification of systemic lupus erythematosus. Arthritis Rheum 1982;25:1271-7. 8. Hanley J, McNeil B. A method of comparing the areas under receiver operating characteristic curves derived from the same cases. Radiology 1983;148:839-43. 9. Marchand A, Van Lente F, Galen R. The assessment of laboratory tests in the diagnosis of acute appendicitis. Am J Chin Pathol 1983;80:369-74. 10. Chan DW. PSA as a marker for prostatic cancer. Lab Manage
1988;January:35-9.
ectangle
x2 (It
where t equals the number of cases that were correctly labeled by the ROC A testirule and incorrectly labeled by the ROC B test/rule and f equals the number of
11. Shortliffe E. The computer and medical decision making: good advice is not enough. IEEE Eng Med Biol 1982;1:16-8. 12. Effron B, Gong G. A leisurely look at the bootstrap, the jackknife, and cross validation. Am Stat 1983;37:36-48. 13. Fleming C, Wasson JH, Albertsen PC, Barry MJ, Wennberg JE, Team PPOR. A decision analysis of alternative treatment strategies for clinically localized prostate cancer: Prostate Patient Outcomes Research Team. JAMA 1993;269:2650-8. 14. Johansson JE, Adami HO, Andersson SO, Bergstrom R, Holmberg L, Krusemo UB. High 10-year survival rate in patients with early, untreated prostatic cancer. JAMA 1992;267:2191-6. 15. Krahn MD, Mahoney JE, Eckman MB, Trachtenberg J, Pauker SG, Detsky AS. Screening for prostate cancer: a decision analytic view. JAMA 1994;272:773-80. 16. Beck JR, Pauker SG. The Markov process in medical prognosis. Med Decis Making 1983;3:419-58. 17. Oesterling ,JE, Jacobsen SJ, Chute CG, Guess HA, Girman CJ, Panser LA, et aL Senim prostate-specific antigen in a communitybased population of healthy men. JAMA 1993;270:860-4. 18. Centers for Disease Control and Prevention. Vital statistics of the United States, 1990: life tables. Atlanta, GA: Centers for Disease Control and Prevention, National Center for Health Statistics, 1990. 19. Hudson MA, Bahnson RE, Catalona WJ. Clinical use of prostate specific antigen in patients with prostate cancer. J Urol 1989;142: 10 11-17. 20. Babaian RJ, Mettlin C, Kane R, Murphy GP, Lee F, Drago JR, et al. The relationship of prostate-specific antigen to digital rectal examination and transrectal ultrasonography: findings of the American Cancer Society National Prostate Cancer Detection Project. Cancer (Phila) 1992;69:1195-200. 21. Laupacis A, Feeny D, Detsky AS, Tugwell PX. How attractive does a new technology have to be to warrant adoption and utilization? Tentative guidelines for using clinical and economic evaluations. Can Med Assoc J 1992;146:473-81.
CLINICAL
CHEMISTRY,
Vol. 41, No. 8(B), 1995
1255