Traditional tools to monitoring of service archtiectures typically consists of a centralized ... The crucial aspect of managing SOA systems in the enterprise is com-.
Multi-Agent approach to monitoring of systems in SOA architecture? Dominik Ry˙zko1 and Aleksander Ihnatowicz1 Warsaw University of Technology, Intitute of Computer Science, Ul. Nowowiejska 15/19, 00-665 Warsaw, Poland
Abstract. The paper introduces a novel approach to monitoring of systems in Service-oriented architecture (SOA) with the use of multi-agent paradigms. Intelligent agents located across the system perform asynchronous, distributed measurements separately for each selected service or process. Compliance with required performance measures or SLAs can be defined and appropriate warnings are generated and reported. Alignment with definition of business processes together with proactive nature of agents allows early prediction of problems. The approach is flexible and scalable and naturally reflects the distributed nature of SOA.
1
Introduction.
A Service Oriented Architecture (SOA) was introduced to overcome problems with integration of heterogeneous information systems and agile development of new solutions in the enterprise. It was thought to allow design and administration of flexible and scalable systems and facilitate communication between different company divisions responsible for its IT solutions and core operations. Despite its advantages SOA architecture brings several challenges. Dynamic nature of collaborating services means several issues can be experienced at runtime. Therefore monitoring of such systems becomes a crucial task. Administrators need to be able to pinpoint quickly where the source of the business process failure lies. Obviously any information which can help to anticipate potential problems in SOA is of great value. Traditional tools to monitoring of service archtiectures typically consists of a centralized module, which overlooks trafic on service bus and reports any anomalies. This approach has several limitations, including single point of failure, lack of scalability and distance from real problems occuring in varius places in the distributed environment. In such a setup its very difficult to predict problems early and react to them. The approach proposed in this paper shows how to overcome these limitations by the use of intelligent agents, which collaborate in order to deliver flexible, scalable and proactive monitoring capabilities. ?
The research was supported by the Polish National Budget Funds 2009-2011 for science under the grant N N516 3757 36.
2
Previous Work and Motivation.
The idea of bringing together SOA and Multi-Agent Systems has already been proposed in previous research. In [7] an agent-oriented SOA programming model is proposed. It is argued that this approach allows natural introduction into SOA of concepts such as autonomy, uncoupling, data-oriented interaction and coordination. Another architecture presented by Sheremetov and Contreras [8] combines Web services and intelligent agent technologies orchestrated by a business process management system. Hahn et al. [4] presents a model-driven approach to design interoperable agents in SOA. Monitoring of systems in SOA architecture has been studied extensively, since it is the key problem for implementing such solutions. Wang et al. [9] introduce a comprehensive QoS management framework for service level management (SLM) of SOA. The crucial aspect of managing SOA systems in the enterprise is compliance with Service Level Agreements (SLA), since any violations of SLA can cost money. Examples of managing this issue by SOA monitoring architectures can be found in [3], [1]. There already exist examples of application of agents for managing SOA performance. Some approaches try to attack the problem early at the design, development or testing phase. In [2] a framework for multi-agent based testing of Web Services is proposed. The system covers all phases of testing from their generation to execution and monitoring. In [6] it is argued that formal encoding of SLA goals within the business process development tools allows end-to-end management. Specificaly, runtime monitoring of services is described. In the proposed architecture light-weight agents collaborate to execute a larger process. However, with lots of existing legacy systems and possible changes in SLA, we need means of monitoring systems without any built-in facilities. Such approach is taken in [5], where agents collaborate on different levels in order to monitor SLA compliance and react in case of any deviations. Agents are grouped in clusters assigned to particular Web Services and act as proxies between WS and the client. The approach allows redirection of requests in case of problems, but creates significant overhead and, by becoming part of the flow, agents can generate problems by themselves. The main goal of the approach presented in this paper was the introduction of a generic, platform independent approach to monitoring of SOA systems, which would allow for early problem detection. The envisaged monitoring architecture is flexible, scalable and adapting to the changing SOA topology. We argue that the multi-agent architecture is the most suitable for this task. Intelligent, autonomous and proactive agents are able to monitor particular services and processes, while communicating with each other in order to exchange information about encountered problems and gathered statistics. Means of limiting the overhead generated by the agents have been introduced, by allowing the administrator to switch on and off monitoring of selected services and processes.
3
Multi-Agent Architecture for SOA Monitoring.
This section provides description of the Multi-agent architecture for monitoring of SOA systems. In general agents, with specific roles assigned to them, are located within a separate monitoring module. This multi-agent environment can be split over several physical servers. This allows for example agents monitoring a particular remote service to be placed on the same machine and gather relevant data localy. In such a setup only aggregated information and exception reports are passed over the network. 3.1
Agent Roles
Following roles, which correspond to abstract description of entity expected functions, were identified in the system: processes definition monitor, process instances monitor, service’s monitor, queue’s monitor, reporting tool. At the lowest level data is gathered by service, queue and business process instance monitors. The multi-agent architecture allows to differentiate the number of details caputured for each element. By default only exceptions and aggregate statistics are captured. However, whenever we want we can ask the monitors to pass more details to study in detail process execution. On the higher level process definitions monitors and reporting agents take care of administration and data presentation tasks. Each of the roles will be now described in more detail.
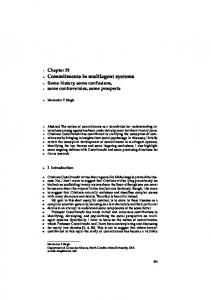
Fig. 1. Processes Definition Monitor
Processes Definition Monitor. Description: Processes Definition Monitor role is responsible for loading processes’ definitions, keeping track of changes in definitions. Other agents are able to get these definitions. Process Definition Monitor controls Service and Queue Monitor’s life cycle, which allows turn off/on agents at user request. Protocols and Activities: GetDefinition, GetDefinitions, CreateAgent and DestroyAgent. Permissions: Read processes definitions.
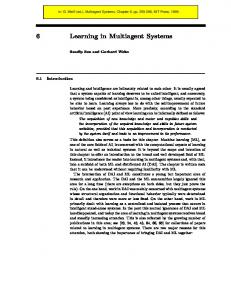
Fig. 2. Process Instances Monitor
Process Instances Monitor. Description: Process Instances Monitor gathers statistical data related to particular process instances within system. It generates messages about instances which take too long to complete. Protocols and Activities: LongInstance, NewInstance, SubscribeObserver, UnsubscribeObserver and InstanceCheck. Permissions: Read instance processing time in business process engine. Service Monitor. Description: Service Monitor collects data: processing time (min/max/mean value), processed messages (all/failed) from service and transmit it to related roles. Protocols and Activities: LongService, MessageFailed, GetStatistices, Error, SubscribeObserver, UnsubscribeObserver and ServiceMonitor. Permissions: Read service processing time, messages count and service status. Queue Monitor. Description: Queue Monitor checks message count in the queue. It signal new message arrival and informs about threshold exceeded (too many messages in the queue). Protocols and Activities: ThresholdExceeded, NewMessageQueue, SubscribeObserver, UnsubscribeObserver and QueueMonitor. Permissions: Read queue message count, queue state.
Fig. 3. Service Monitor
Fig. 4. Queue Monitor
Fig. 5. Report
Report. Description: Report is responsible for providing status reports and interaction with user. Protocols and Activities: LongInstance, NewInstance, GetDefinition, GetDefinitions, LongService, MessageFailed, GetStatistics, Error, ThresholdExceeded, NewMessageQueue, SubscribeObserver, UnsubscribeObserver, CreateAgent, DestroyAgent, Register and Deregister. Permissions: – Interaction Model for the Proposed System. Interaction models are used to represent links between roles. SubscribeObserver/UnsubscribeObserver. These two protocols allow observers to subscribe to the monitor (service, queue or instance) and unsubscribe from it. Event messages are sent only to registered observers. LongInstance. This protocol represent is used to inform about process instance which took long time to complete. NewInstance is sent to observer each time business process is invoked. GetDefinition/GetDefinitions. This protocol allows process definitions to be accessed by other roles in the system. LongService/MessageFailed/Error/GetStatistics. This protocol enables Service Monitor role to send messages related to state of the service. ThresholdExceeded/NewMessageQueue. This protocol permits observer to get information about queue’s state. UpdateQueue/UpdateService. This protocol allows Process Definition Monitor role to inform other roles about changes in definitions of processes. CreateAgent/DestroyAgent. This protocol allows Report role to ask Process Definition Monitor to turn on/off particular Service or Queue Monitor.
The attributes of each of the protocols are listed in Table 1. Table 1. Attributes of the protocol definitions Protocol
Initiator
SubscribeObserver/ UnsubscribeObserver LongInstance NewInstance GetDefinitions
Report
Responder
Service, Queue and Instance Monitor (Mon.) Instance Mon. Report Instance Mon. Report Queue&Service Definition Mon. Mon., Report LongService Service Mon. Service and Instance Mon., Report MessageFailed Service Mon. Service and Instance Mon., Report Error Service and Report, Instance Mon. Queue Mon. GetStatistics Report Service Mon. ThresholdExceeded Queue Mon. Report, Service Mon. NewMessageQueue Queue Mon. Report MessageFailed Service Mon. Report, Service and Instance Mon. UpdateService Definition Mon. Service Mon. UpdateQueue Definition Mon. Queue Mon. Destroy/Create Agent Report Service and Queue Mon.
3.2
Input
Output
Observer Id Accept/ Reject —— —— — / Definition Id ——
Instance Id Instance Id Process definition Service Id
——
Service Id
——
Error message
Service Id —— —— ——
Service Stat. Queue Id Queue Id Service Id
—— —— ——
Service update Queue update Acknowledge
Agents and Organisation of the System.
Agents are based on the reactive model, which is accurate for the task. Complex actions are the effect of interaction between agents and organisation, which is modelled as community of experts. There are four types of agents in the system: – monitoring agent for service and queue (which mapps Service Monitor and Queue Monitor roles); – instance monitoring agent; – process defintions monitoring agent; – reporting agent.
4
Experimental Results.
In order to test ideas presented in the paper a multi-agent system was built, which implements SOA monitoring capabilities. The scope of the tool includes identification and reporting of performance problems, errors and exceptions as well as non-compliance with SLA of services and business processes. The functions provided by this system are as follows:
– autonomous monitoring of services and business processes and broadcasting messages related to performance problems, errors and SLA violation; – collecting statistical data associated with services (e.g. processing time); – capturing failed messages; – detecting failed services and processes which take too much time to complete; – informing about events in the system – new message in the queue or new process instance; – providing status reports to the user through a GUI based agent. Elements of analysis and design methodology Gaia [10] were adopted to design the tool with the functionalities mentioned above. Apart from provided functionalities, it was crucial to design a tool in such a way that it does not overload SOA infrastructure and services. As a Enterprise Service Bus JBoss ESB 4.7 deployed on JBoss AS 5.1.0.GA was chosen with JADE 3.7 as the multi-agent platform. Agents use Java Management Extension interface and Aspect-Oriented Programming to communicate with the environment. 4.1
Test Scenarios.
This section presents results of test scenarios. The tool was tested using different scenarios which simulate performance problems, exceptions in the system, queuing new messages or invocation of new process instance. Tests were based on a business process, consisting of sequencial invocation of services and more complex one implementing an on-line shop (figure 6). 4.2
Scenario 1 – service’s long processing time.
The service level agreement for the process is set as throughput of 100 process instances per hour. One of the service for choosing delivery method (UPS) has a performance issue which results in SLA violation of the whole process. Monitoring system presents following output to the user (only relevant messages): ... 22341-Instance: New instance: 22341 UPS Service: new message on queue ... UPS Service: long service 22341-Instance: long service: UPS Service ... UPS Service: long service Order Process: SLA violation: suspected problem: UPS Service New instance is started in the environment (instance id 22341). Message is arriving to the queue and processing starts. After processing completion service monitoring agent recognise that UPS Service takes too long to complete (based on statistical data) and informs instance monitoring agent. Finally, if no actions are taken, SLA is violated and this fact is also reported to the administrator.
Fig. 6. Business process definition for on-line shop (Order Process)
4.3
Scenario 2 – messages queuing.
The SLA set for the system is completion time less than 10 seconds. Due to unusually large queue to one the service (Register) processing time is becoming longer. The output from the system is as follows: 22156-Instance: New instance: 22156 Register Service: new message on queue ... Register Service: many messages in the queue ... 22156-Instance: long service: Register Service ... Order Process: SLA violation: suspected problem: Register Service New instance is started. Messages are arriving to Register service queue. ThresholdExceeded warning is issued as soon as there are more messages waiting then the threshold set by administrator based on historical data. Finally, information about SLA violation is sent to Reporting agent. In situations as described above, the user recives warnings about performance issues before SLA is violated and can take actions after repeted warnings. Each warning includes information about specific problem class and source.
5
Conclusions.
The paper presents how to use intelligent agents to monitor SOA systems, by overlooking particular services and processes in the system. Relevant statistics are gathers and sent to a single point of reporting, where administrator can review them. Any exceptional situations are reported both to the administrator and other agents related by the business process flow. This proactive behaviour allows to detect problems early and anticipate issues before their occurance. Conducted tests proved feasibility of the agent-based approach to monitoring of Web Services in SOA systems. Cases such as service failure, overload with requests, long processing etc. have been simulated and reported successfuly. Monitoring of compliance with SLA was also demonstrated. The prototype system is platform independent and can be used to monitor different systems built according to SOA principles and with the use of most common standards (e.g. BPEL). It is only required to develop specific plugins for gathering information for monitoring agents. The monitoring architecture is lightweight and introduces little overhead. It is independent from the SOA layer and it’s failure does not interfere with the monitored functionality.
References 1. Ameller D., Franch X., Service level agreement monitor (salmon). Proc. of the 7th Int. Conference on Composition-Based Software Systems (ICCBSS), IEEE 2008 2. Bai X., Dai G., Xu D., Tsai W., A Multi-Agent Based Framework for Collaborative Testing on Web Services. Proc. of the The 4th IEEE Workshop on Software Technologies for Future Embedded and Ubiquitous Systems, and the 2nd Int. Workshop on Collaborative Computing, Integration, and Assurance (SEUS-WCCIA’06) 3. Berbner R. et al., An approach for the management of service-oriented architecture based application systems. Proceedings of the Workshop Enterprise Modelling and Information Systems Architectures (EMISA 2005), p. 208-221 4. Hahn C. et al., Meta-models, Models, and Model Transformations: Towards Interoperable Agents. Multiagent System Technologies, Springer 2006 5. Miede A. et al., Cooperation Mechanisms for Minitoring Agents in Service-oriented Architectures. Tagungsband der 9. internationalen Tagung Wirtschaftsinformatik 2009, vol. 1, p. 749–758, sterreichische Computer Gesellschaft, February 2009 6. Muthusamy V. et al., SLA-Driven Business Process Management in SOA. Proc. of the 2009 conference of the center for advanced studies on Collaborative research 7. Ricci A., Buda C., Zaghini N., An Agent-Oriented Programming Model for SOA & Web Services. Proc. of 5th IEEE International Conference on Industrial Informatics (INDIN’07), Vienna, Austria, July 2007 8. Sheremetov L., Contreras M., Industrial Application Integration Using AgentEnabled Sematic SOA: Capnet Case Study. Information Technology For Balanced Manufacturing Systems, Springer 2006 9. Wang G. et al., Service Level Management using QoS Monitoring, Diagnostics, and Adaptation for Networked Enterprise Systems. Proceedings of the Ninth IEEE International EDOC Enterprise Computing Conference, 2005 10. Wooldridge, M., Jennings, N., Kinny, D., The Gaia Methodology for AgentOriented Analysis and Design. Autonomous Agents and MAS 3 (2000)