Ecological Modelling 141 (2001) 201– 215 www.elsevier.com/locate/ecolmodel
Multi-agent simulation of group foraging in sheep: effects of spatial memory, conspecific attraction and plot size Bertrand Dumont a,*, David R.C. Hill b a b
INRA, Unite´ de Recherches sur les Herbi6ores, Theix, 63122 Saint-Gene`s-Champanelle, France ISIMA, Uni6ersite´ Blaise Pascal, Campus des Ce´zeaux, B.P. 125, 63173 Aubie`re Cedex, France
Received 28 April 2000; received in revised form 12 February 2001; accepted 23 February 2001
Abstract We describe the modelling of sheep spatial memory at pasture using an individual-based approach. As our modelling goal requires specification of stochastic and state-dependent random movements and some social aspects, we used a multi-agent system that can be regarded as a special case of an individual-based model (IBM). We used a three-phase approach to implement the synchronization kernel since this is particularly well adapted to spatial resource competition. One of the main differences between this model and most earlier IBMs is that we were able to use real field data from animal experiments for model validation. We thus compared real system behaviour with model predictions. As the simulation results were consistent with field data, we used the model as an extrapolation tool to investigate conditions that had not been tested, or that are not easily amenable to experimentation. This enabled us to show that conspecific attraction can have disruptive effects on the searching efficiency of foragers in habitats, where patches deplete rapidly. We also show that the advantages of a good spatial memory vary according to the size of the environment to be explored. © 2001 Elsevier Science B.V. All rights reserved. Keywords: Multi-agent system; Sheep; Foraging; Spatial memory; Social attraction; Plot size; Model validation
1. Introduction How herbivores learn and remember the location of a preferred food at pasture determines their diet selection, and so their impact on vegetation dynamics. This cognitive ability becomes essential, when sites with a preferred food are * Corresponding author. Tel: +33-473-624607; fax: + 33473-624118. E-mail addresses:
[email protected] (B. Dumont),
[email protected] (D.R.C. Hill).
distant and when no visual or olfactory cues are available for locating them. The use of spatial memory has been demonstrated in cattle (Bailey et al., 1989), sheep (Edwards et al., 1996) and deer (Gillingham and Bunnell, 1989), but further studies are needed to characterize its extent and limits. Grazing experiments are usually time-consuming, but ethological research can make use of simulation studies, which can generate a large amount of data, to test assumptions on the influence of animal or environmental factors on the grazing process. To study the spatial memory of individu-
0304-3800/01/$ - see front matter © 2001 Elsevier Science B.V. All rights reserved. PII: S 0 3 0 4 - 3 8 0 0 ( 0 1 ) 0 0 2 7 4 - 5
202
B. Dumont, D.R.C. Hill / Ecological Modelling 141 (2001) 201–215
als, we constructed an individual-based model (IBM). Modelling the foraging efficiency in a spatially and temporally heterogeneous environment requires that individuals remember both the immediate and a more distant past. Although modelling approaches were different, memory properties have already been incorporated in several foraging models (Benhamou, 1994; Bailey et al., 1996; Hirvonen et al., 1999). These last authors argued that for realism, interactions between individuals ought to be integrated into foraging behaviour and spatial memory models, including their consequences at levels higher than the individual, and concluded that this could be achieved by applying individual-based modelling (see Grimm, (1999) for review). Individual-based foraging models initially emphasized movement rules, without considering social interactions between animals. To model the foraging efficiency of a herbivore, Roese et al. (1991) used an IBM with a rule-based eventdriven approach. The forager was characterized in terms of physical, physiological and cognitive attributes but displayed no social behaviour. The model showed that the foraging efficiency of a herbivore varied with changes in the structural (i.e., size and variability of plants and individual bites available) and spatial properties of resources in the habitat. Turner et al. (1993) also used an individual-based approach to simulate the foraging success and consequent survival chance of herbivores according to their movement rules in different landscape patterns. They developed a spatial model implemented by a grid, where each cell could be considered as either a resource or a non-resource site. Though again no social interactions were handled by this model, the authors demonstrated that an individual-based spatial model developed for specific landscapes and species can help us understand herbivore population dynamics. More recently, Carter and Finn (1999) and Railsback et al. (1999) confirmed that movement rules strongly influence the outputs of individual-based foraging models, the last authors showing that one of the primary benefits of the individual-based approach is that it obviates simplifying assumptions. Social interactions between individuals have lately been integrated in herbi-
vore foraging models. Shiyomi and Tsuiki (1999) used a mathematical model with diffusion equations to investigate the spatial patterns formed by a small herd of grazing cattle. Distance between individuals was determined by a combination of attractive and repulsive behaviour operating among individuals, together with some random movement rules. This let the model accurately predict the closeness of individuals within a herd according to animal activity. Finally, Beecham and Farnsworth (1998) first used an individualbased approach with some degrees of sociability between individuals in a model developed to study foraging by herbivores in a complex environment. This model is also spatially oriented and the environment is described as a small map of hexagonal patches. Each animal can be viewed as an agent because it is implemented by autonomous threads and displays social behaviour. Sociality of an animal is determined by optimal spacing from other animals and by weighting of patch choice based on social factors related to food availability. The model demonstrated that social interactions can constrain patch choice, which can then result in a short-term reduction of intake and a greater degree of variability in the level of resources in patches. For our case study, we needed to specify stochastic and state-dependent movements (based on probability matrices) and social aspects, in addition to our main purpose, which was to study individual memory. This led us to choose the multi-agent approach, which can be regarded as a special case of an IBM. In the Multi-agent system (MAS) paradigm, agents perform their individual tasks with their own operational autonomy and social behaviour, but they influence the global behaviour of the simulated system through local interactions (Wooldrige and Jennings, 1995; Coquillard and Hill, 1997; Ferber, 1999). The MAS paradigm therefore enables us to simulate complex social behaviour (Drogoul et al., 1995). The simulation was developed using the multi agent visual interactive simulation (MAVIS) framework (Campos and Hill, 1998), which provides visualinteractive feedback to end-user at run-time. One of the main differences between our multi-agent model and most of the previously discussed IBMs
B. Dumont, D.R.C. Hill / Ecological Modelling 141 (2001) 201–215
is that we were able to use real field data from animal experiments (Dumont and Petit, 1998) for model validation. Another point is that we used a three-phase approach (To¨ cher, 1963; Pidd, 1992) to implement the synchronization kernel since this is particularly well-adapted to spatial resource competition. After stating our modelling goals, we discuss data collection, modelling choices and model operation. We then deal with model validation, and conclude on what the model tells us about the interactions between memory capacity, conspecific attraction and the size of the environment to be explored, on herbivore foraging efficiency.
2. Modelling goals Since grazing experiments are time-consuming, a simulation environment was developed as an ethological research tool. Our aims were (i) to use experimental data on how sheep learn the distribution of sites with a preferred food at pasture to calibrate a model on sheep searching behaviour, and (ii) to evaluate how the efficiency of this searching behaviour is affected by changes in some animal (memory capacity, strength of attraction between conspecifics) or environmental (plot size) factors, and by a combination of these factors. In this context, allowing for space, social interactions and random fluctuations also became modelling goals. We wanted to keep the model as simple as possible, although it is possible to integrate various field observations directly in IBMs. Since our main goal was to improve the under-
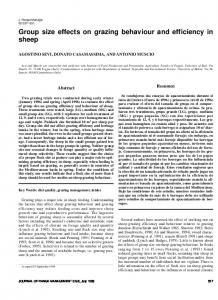
Fig. 1. The layout of the small and large plots; individual bowls are shown as dots.
203
standing of the biological system, we avoided incorporating too many realistic details. A better understanding can be achieved by making many replicates of experiments using a simpler model.
3. Biological data collection Biological data were collected in an experiment conducted during summer 1996 (Dumont and Petit, 1998). Our aim was to assess the effect of plot size and feeding site value on the use of spatial memory by sheep. For this purpose, 136 bowls containing a preferred food (pellets of maize+ beet pulp) were grouped together to create preferred feeding sites in a large (160× 160 m2) and a smaller (80× 80 m2) cocksfoot (Dactylis glomerata) plot, designated P160 and P80. In each plot, there were four rich sites with 25 bowls and four poorer sites with 9 bowls (Fig. 1), positions of the sites being chosen randomly. Distance between bowls in P160 was twice that in P80. The bowls were buried to the rim so that nothing distinguished them from the surrounding environment, but the animals could use distal landmarks to orient. The sward was maintained at about 5.5 cm by successive cuts. Four groups of three ewes were tested for 30 min each day, with sites of fixed location over series of 12 days. Two groups were observed in P80, and the other two groups were observed in P160, where site distribution was the same. After 12 days, the position of the sites was changed and each of the four groups was allocated to one of the two plots for another series. We successively used three site distributions. Before a group entered a plot, each bowl was filled with 5 g of pellets. For the test a first observer recorded the activity (grazing, eating pellets, walking or idling) of each animal every 30 s. A second observer recorded the succession of bowls visited by one of the three ewes (always the same in a series of trials), and whether the bowl was found with pellets or not. After 30 min, the ewes were removed from the pasture, and the number and position of the bowls visited was recorded. Each empty bowl was then refilled with 5 g of pellets for the next test. We used a Wilcoxon test for paired data to analyse the
204
B. Dumont, D.R.C. Hill / Ecological Modelling 141 (2001) 201–215
change in ewes’ behaviour over the series of measurements, and a Wilcoxon– Mann – Whitney test to detect differences between plots.
4. Model choices and description
4.1. Choice of simulation technique During the last decade the study and exploration of complex dynamic systems such as ecosystems has been intensively developed in interactive simulation environments (De Angelis and Gross, 1992; Breckling and Mu¨ ller, 1994). The need for interactive ecosystem simulation environments is obvious, if we consider that part of the simulation validation is an iterative and interactive process, where domain experts, as end-users, update a knowledge model, i.e., a set of ecological information items and rules (Coquillard and Hill, 1997). Simulation systems answering user inputs by changing the visual model state are also known as VIS, visual interactive simulation, and were introduced by Hurrion (1976); they are extensively discussed by Bell and O’Keefe (1987) and Hill (1996). Although the known risk in stochastic simulations is drawing conclusions from small visual samples, a VIS system provides a natural way for a domain expert to interpret the influence of simulation input parameters on results by their visual representation, and when the model behaviour is inconsistent the expert can try to change it. This is easier to achieve if all the rules are in separate entities rather than synthesized in aggregated variables (Huston et al., 1988). With individual based models, changes can be applied locally, facilitating the simulation validation. This has prompted scientists in the simulation field to adopt the software agent idea (Zeigler, 1990), when dealing with ecosystem simulations. It is possible to represent an environmental phenomenon as the consequence of the interactions of parallel agent sets, where each agent has its own operational autonomy (Campos and Hill, 1998; Ferber, 1999). The use of agent technology in computer simulation promotes the inclusion of social oriented cognition into individual-based simulations, emphasizing the emergence of macro-phenomena
from micro-level specifications (Doram, 1997). This approach is well suited to exploring and studying ecosystems with social animals (e.g., Tu and Terzopoulos, 1994; Drogoul et al., 1995) because these are separate individual organisms that perform tasks in parallel, and have individual actions that influence global behaviour. Most aspects of agent-oriented simulation systems can easily be embedded within object-oriented discreteevent simulation approaches (Uhrmacher, 1997). We used stochastic discrete event simulation as our main implementation technique, and in addition the multi-agent paradigm was selected because social interactions played a significant role in our real and simulated grazing experiments. It is now recognized that a MAS is used at its best if we need to simulate animal interactions and (or) complex social behaviour (Ferber, 1999). The model has been implemented under UNIX (LINUX) using the GNU C and C + + languages, the graphic user interface used Tcl/tk and the entire software is available on request.
4.2. Model operation The model is stochastic with a discrete state automaton to represent ewe agent activities and behaviour. Events occur discretely according to the simulation time, and we switched from one ewe activity to another depending on simulated events. Fig. 2 presents the approach used for the simulation synchronization kernel, which allows a true parallel competition for spatial resources. This is particularly important in our case, when we simulate grazing processes, agents that can move to the same spatial position or choices between foraging and other behavioural decisions, etc. Though the process approach introduced by Simula facilitates the design and implementation of MASs, we retained the ‘‘three-phase approach’’ initially proposed by To¨ cher (1963), not only for its faster execution, but also above all because, we found it perfectly adapted to handling both time and space competition between simultaneous agents. In a three-phase approach, a classification of activities is made to separate unconditional activities and those that are conditional upon the co-operation of different agents. This is in fact an
B. Dumont, D.R.C. Hill / Ecological Modelling 141 (2001) 201–215
Fig. 2. The three-phase approach used for agent modelling.
Fig. 3. Simple state chart for a virtual ewe agent. From day 2, states enclosed with dotted lines are only accessible when the ‘‘intake capacity’’ threshold is reached or when search for bowls has been unsuccessful for a parametrized duration. Stars indicate that once that activity is over, a new choice is made among the accessible states.
205
optimization of the activity approach first introduced in the Control and simulation language by Buxton and Laski (1962). The three-phase approach has been more recently revisited and used by Pidd (1992) and Hill et al. (1998) in an ecological modelling context. Classically, the first-phase deals with time management (clock-based with a time step of one second in our case), the second phase executes unconditional activities and the last phase focuses on conditional activities. In our case (Fig. 2), the third phase implements the random choice between simultaneous agents in competition for spatial resources; thus the equivalent of a ‘‘thread of control’’ is given sequentially but in a random order to each simultaneous agent. It is well known that the use of a quality random number generator is fundamental in stochastic simulation. We therefore used a statistically checked generator, using a shift register generator shuffled with a congruential generator. The software agents that model ewes move in environments they can partially memorize. They display social behaviour and interact with each other. Fig. 3 gives a simplified state chart that presents the main states defined for our virtual ewes. They correspond to activities; a ewe can: graze, use its memory to find a bowl, walk directly to a bowl in its field of view, have a ‘‘biased random walk’’, eat pellets in a bowl and rest for a while. Our iterative modelling process led us to select a set of parameters judged essential by ethologists. The time spent by ewes in these different activities are modelled by uniform laws where the minimum and maximum limits are specified. Once a bowl is reached, if it is not already empty the ewe eats all the pellets. If it is empty, it takes the ewe two seconds to react before moving on. We also specified an ‘‘intake capacity’’ threshold for each ewe using a uniform law; when this threshold is reached the animal can start grazing. This enables us to take into account the strong preference for pellets over the sward. On the first day of a series, the ewes start grazing and only begin to search for bowls once the first one has been visited. From the second day of a simulated series, the ewes
206
B. Dumont, D.R.C. Hill / Ecological Modelling 141 (2001) 201–215
know there are bowls containing pellets within the plots, and as they prefer these pellets to the sward, they immediately search for the bowls. The environment has been described as a map of small square patches, so that at each location an animal can walk to eight adjoining patches. Animal movement paths are determined by both the direction and speed of walking. When an animal uses its memory to reach a bowl, it walks to the targeted bowl with a certain error of a few meters. It then either walks directly to the bowl if it is in its field of view, or it adopts an area-restricted search (i.e., a tortuous and slow search path) to discover the targeted bowl. Otherwise, the biased random walks use the probabilities specified in two direction matrices, these non-uniform probabilities enabling the modelling of a more realistic behaviour consistent with observed trajectories. The directionality of movements is greater, when animals are walking rather than grazing. Walking speed is highest, when animals are targeting a bowl. Animals slow down, when they walk without targeting, and more markedly, when they graze. Though the model design makes use of the new emerging unified modelling language (UML), based on the notation of the leading object-oriented methods of the 1990s, the space and scope of this paper do not allow us to present design details. UML has been an object management group standard since November 1997 (Fowler and Scott, 1997). It is used to describe the class diagram (Fig. 4a) since the notation is easier to introduce for biologists. To represent the interaction between ewes in the same flock, we used a
Fig. 4. UML Class diagram: (a) the composite pattern and (b) its tree structure formed by an example of the Group – agent relationship.
software micro-architecture called the Composite pattern (Gamma et al., 1995). This approach provides a flexible design that helps communication between ewe agents via a concept of message. The message interdependences are modelled by a whole-part chain of messages, i.e., when an agent wants to send a message to its peers (in the composite tree structure, see Fig. 4b), it first passes it to the group object (flock), which will save it as an internal state and makes it available for its agents to consult. To do this, each agent shares a common interface attribute to access its group. After the message is processed by the group, a state variable will represent the message context that will be consulted by each agent in their next active time. The group state is modified only by the agents that compose it. Another modelling point is that social attraction between individual animals within a group works differently according to the activity of the animals. When animals are searching for bowls social attraction is weak, each animal being attracted by either of its two peers at a frequency of tx – attir percent of its walking decisions. When animals are grazing social attraction is strong, an animal being attracted by one of its peers each time it is located at more than a parametrized number of meters away. This is entirely consistent with a model output of Shiyomi and Tsuiki (1999), showing that the closeness of individuals within a small herd of cattle was stronger, when grazing than when walking. The application presented in this paper required careful modelling of agent memory, which is difficult because there are no generic rules or paradigms for this kind of abstraction. The memory object is an abstract data structure, which can be as simple as a tree, a list or an array, or as complex and advanced as an information network. However, it must have three main characteristics: a predefined maximum size, an indexed search method, and ability to get, save and forget information. Spatial memory has been represented as a two-part code, reference and working memory (Bailey et al., 1996). Reference memory is the map-like representation of the foraging environment. Here, it is characterized by its size, i.e., the number of bowl locations that can be stored
B. Dumont, D.R.C. Hill / Ecological Modelling 141 (2001) 201–215
in memory, which is for each animal randomly chosen between a minimum and a maximum (min – mem and max – mem). When the number of bowls visited over the successive tests reaches memory size, the locations of the less frequently visited bowls are forgotten. This forget procedure has been used to make dynamic use of the memory, deleting old data to make way for new information if the data has not been consulted for a certain time. In the model of Hirvonen et al. (1999), weights for past events were exponentially decayed to emulate the behaviour of the individual’s memory, whereas in that of Bailey et al. (1996) memory declined in a sigmoid manner. Here memory devaluation rate is low because we use high values for memory size (min – mem = 60 and max – mem =80). Thus it takes time for each animal to fill up its memory, and the number of bowls to be forgotten is low compared with the locations in memory. Devaluating past experience with a low rate is, according to Hirvonen et al. (1999), the most successful tactic in a stable environment such as here, i.e., the bowls were filled with pellets every day. Another parameter that characterizes this memory decay is the probability of remembering each bowl’s location on a given day (tx – mem), which we use to indirectly specify that ewes remember the location of sites rather than that of bowls, so as to favour those sites where most bowls have already been found. Memory decay between days is the same for all the animals. When an animal is searching for pellets, it walks (with a parametrized spatial uncertainity) to the nearest location with a non-visited bowl. It avoids the bowls in which it has already consumed pellets on that day, which allows us to take into account working memory, i.e., the learning of the already visited parts of plots where search for food would be unsuccessful. We have modelled a decay of that working memory, since each day an animal gradually forgets which bowls it has already visited. Animals also know that they are searching for clustered food items. Each time an animal discovers a bowl with pellets, it consumes them before adopting an area restricted search around the bowl location to discover, with increased efficiency, the bowls likely to be close to it. The gain in efficiency for a predator searching
207
for clustered prey items with a mechanism of this type has been quantified by Benhamou (1994). Here, this intensive search mode stops when the animal is at a parameterized distance from the last bowl found with pellets. On the other hand, animals can also adopt a more extensive search mode. When an animal is searching for bowls, it usually uses its memory. However, it sometimes opts for a biased random walk, which can help it discover a new feeding site. The probability of using memory instead of a biased random walk is parametrized in the model, and is the same for all the animals.
4.3. Model 6erification and 6alidation During the model development phase the main goal was to find the rules and assumptions necessary for virtual ewes to learn the parcel in a way similar to real ewes. Thus the main modelling activity consisted in determining the right set of parameters, and calibrating, verifying, validating and analysing the simulated situations in comparison with reality, in order to improve the model. Models are often used to predict the behaviour of ecological systems, although very few are really validated due to the lack of biological data. Here, as in the usual simulation terminology, we take verification to mean a process intended to check that the implementation of the model is correct, and validation to mean a process ensuring that the simulation program is capable of reproducing with sufficient accuracy the input/output transformation of the system being modelled. Simulation program deficiencies can then be due to an inadequate model, implementation errors (insufficient numerical accuracy, programming bugs, etc.), or else to inappropriate, inaccurate or insufficient data. We know that perfect model verification will not be possible until a program proof theory is available, and of course a model is valid only for a particular set of experimental conditions. We implemented two software programs; VIEWBOWL for verification and STATZON for validation. VIEWBOWL mainly provides a graphical time sequence of visited bowls, formatted results and output data. STATZON mainly offers statistical analysis of the previous data.
208
B. Dumont, D.R.C. Hill / Ecological Modelling 141 (2001) 201–215
Many curves had to be fitted between reality and simulation, so that the use of VIS was crucial for the success of this case study. Each time, the desired number of replications for a given situation was obtained, the screen displayed two sets of curves: the first showing the average number of bowls visited by groups of three ewes and by one ewe within each of these groups, over the series of 12 days, and the second showing the time course of activity directed towards the bowls (proportion of time spent walking for and eating in bowls), over a 30 min test. Three scripts were developed to do basic statistics on simulation results, and to obtain some additional information: zcon draws the curve of the average number of sites visited by an animal in 30 min, over the series of 12 days, nbzon draws the curve of the average number of times an animal switches between sites in 30 min, over the series of 12 days, and simu calculates the average number (and confidence interval) of bowls visited by an animal each time it enters either a rich or a poorer site.
5. Predictive validity and extrapolation of the model The next sections will discuss how we tested the predictive validity of the model by comparing real system behaviour with model predictions. We then used simulation as an exploration tool that enables us to investigate a large number of conditions that were not or could not be concretely tested in the fields.
5.1. Comparing reality with simulation results Comparison of the real system behaviour and of model predictions was successful for both the visual features of animal movement paths and for the main model outputs. When the simulated data were within the 95% confidence interval of real data, we considered that the calibration was correct. We could have opted for a reverse approach, trying to fit real data within the confidence interval of the simulation results, but this would have meant considering the model as reality, a common pitfall in many stochastic simulation studies. In
the real experiment, the groups and also individual animals within the groups visited more bowls in each plot with increased experience of a particular site distribution (PB 0.05). The number of bowls visited in 30 min then levelled off. In each plot, ewes exploited exactly the same number of bowls on days 5 and 6 as on the last two days of the series. We therefore considered that a plateau was reached from day 5 (Dumont and Petit, 1998). It was higher in P80 (PB 0.01) for both groups (126 vs. 82 bowls) and individual ewes within those groups (73 vs. 40 bowls). The curves in Fig. 5 show the total number of bowls found by each individual ewe in the two plots over 12 measurement days. We give the mean real data after two replications in each of the three distributions, and simulation results with 30 replications in each of the same three distributions. In P160, simulation results on the number of bowls found by each ewe are in the 95% confidence interval of real data, except for day 2. In P80, they are always in the 95% confidence interval of real data from day 3. The quality of the simulations performed on groups of three ewes is similar. The main discrepancy between real and simulated data is thus in the number of bowls discovered in the first days of series, which is particularly low in simulated data. This is the result of the learning of the test principle by the experimental ewes. When the distribution of bowls was changed between two series the performance of ewes was poor. However, they had learned that bowls were hidden in the plot, and consequently searched for them more than did the simulated ewes, for which no effect of previous experience was considered. As in the extrapolations, we will consider results at the plateau or average results over 12 days, such differences in behaviour over the very first days of series are of lesser importance. In both plots, ewes in the real experiment encountered more and more empty bowls in a 30min test. Consequently, the time spent walking and eating in bowls decreased over a test, and the ewes switched to graze the sward. Data in Table 1 describe the evolution of the activity directed towards the bowls over a test, within the two plots. Again, we give the mean real data after two replications in each of the three distributions and
B. Dumont, D.R.C. Hill / Ecological Modelling 141 (2001) 201–215
209
Fig. 5. The number of bowls found by an individual ewe in each of the two plots over 12 measurement days. Open symbols indicate real experiment results ( 9 95% confidence intervals) with two replications in each of the three distributions. Curves with full symbols are simulation results with 30 replications in each of the same three distributions. Table 1 Evolution of the activity directed towards the bowls (proportion of time an individual ewe spends walking for and eating in bowls) over a test in the real experiment and in the simulation 0–5%
5-10%
10–15%
15–20%
20–25%
25–30%
Mean
80×80 m2 Reality 95.5 (995% CI) (91.9–99.1) Simulation 89.4
75.9 (63.9–87.9) 82.8
47.9 (33.9–61.9) 68.0
28.6 (15.3–41.9) 47.0
17.6 (9.4–25.8) 28.1
10.5 (5.0–16.0) 17.3
46.0 (38.4–53.6) 55.4
160×160 m2 Reality 86.5 ( 995% CI) (82.5–90.5) Simulation 73.4
56.8 (41.6–72.0) 62.1
37.6 (16.7–58.4) 60.3
22.0 (9.7–34.2) 51.0
19.0 (8.9–29.2) 37.5
16.5 (7.9–25.2) 25.3
39.7 (28.4–51.1) 51.6
simulation results with 30 replications in each of the same three distributions. A decrease is observed in the real and simulation data, but it is stronger in real data. Ewes in the real experiment spent on average less time walking for pellets and eating them than those in the model. Consequently, they were more efficient in finding the bowls. In the experiment, a ewe visited on average 3.0 and 5.0 bowls/min of activity directed towards the bowls in P160 and P80, respectively. In the model, it is only 2.0 and 4.0 bowls per min.
At the plateau, individual ewes in each test visited more sites in P80 than in P160 (7.8 vs. 5.8; PB 0.01), and also walked more frequently from site to site in P80: a ewe switched between sites 18 times in 30 min vs. only 9 times in P160 (PB 0.01). In P80, a ewe visited on average 6.4 bowls within a rich site and 2.6 bowls within a poorer one. In P160, a ewe visited on average 6.9 bowls within a rich site and 2.1 bowls within a poorer one (Dumont and Petit, 1998). In the model, a ewe visits at the plateau 7.2 and 5.1 sites in each
210
B. Dumont, D.R.C. Hill / Ecological Modelling 141 (2001) 201–215
test in P80 and P160, respectively. Each ewe switches between sites 23 times in P80 and 18 times in P160. In P80, a ewe visits on average 6.0 bowls within a rich site and 2.6 bowls within a poorer one. In P160, a ewe visits on average 4.7 bowls within a rich site and 1.8 bowls within a poorer one. In both plots, ewes in the model miss more preferred sites than was experimentally observed, which partly explains why they are less efficient in finding the bowls than were those in the real experiment. They also leave the preferred sites too soon, especially in the large plot where the number of bowls visited per site is too low and the frequency of switching between sites twice that observed in the experiment. This could have been corrected by calibrating the parameters differently in the two plots, but this was not done, as we wanted to extrapolate the results of this simulation to other plot sizes.
5.2. Extrapolations As the predictive validity of the model was successfully tested, we were able to use this simulation as an extrapolation tool. Our aim was to investigate how variations in conspecific attraction and memory ability of an animal could affect its foraging efficiency. We therefore present data on individual animals, which is also meaningful from an evolutionary point of view. Four new square plots were tested, of side 40, 120, 200 and 240 m, designated P40, P120, P200 and P240, respectively. For statistical analyses, extrapolations were made with 10 replications in each of eight site distributions (the three previously used distributions and five randomly chosen ones, each with four sites containing 25 bowls and four sites with 9 bowls). We used the GLM procedure of SAS (1989) to analyse data, and a multiple comparison test (Duncan test; alpha= 0.05) to detect differences between treatments. To assess the effect of conspecific attraction, when animals are searching for bowls, the social parameter tx – attir was successively varied from 0 to 100, in steps of 15 units (10 units between the first two levels), in plots P80 and P160. In P80, increasing the strength of social attraction, when animals are searching for bowls
has no effect on the average number of bowls visited by each individual ewe in a test, whereas in P160 there is a maximum for tx – attir = 25 and a significant decrease (PB 0.01) for the highest levels of social attraction. In both plots, such an increase in social attraction also increases the number of bowls found by an animal per minute of searching (PB 0.001; Table 2). However, the three animals in each group tend to find the same bowls, and so both the average amount of pellets consumed by an animal in a test and its instantaneous intake rate (in g of pellets consumed per min of searching) are reduced (P B 0.001; Table 2). The curves in Fig. 6 show the effect of plot size on the evolution of the number of bowls visited by each ewe, when the position of preferred feeding sites is not changed. Animals find more and more bowls as plot size decreases (PB 0.001), mostly because the bowls are easier to find. This is so from the first day of a series, when random phenomena have a major influence on model behaviour (PB 0.001 on day 1; only P200 and P240 do not significantly differ), to the last days, when simulated ewes mainly use their memory (PB 0.001 on day 12; all plots are significantly different). As in real data, the number of bowls found by the ewes over the series of 12 measurement days first increases and then levels off. The larger the plot, the lower but also the later the plateau. Owing to the restricted number of data this last point was not formally demonstrated in the experiment. The curves in Fig. 7 present the height of the plateau (number of bowls visited in 30 min on day 12) according to plot size and memory capacity of the animals. We first calculated the model output (M) according to plot size. Memory size and memory persistence parameters were then each successively reduced and increased by 20%, 40%, 60%, 80% and 100% to assess the effect of variations in the memory capacity of an animal according to plot size. The greater increase in plateau height due to an increase in memory capacity is observed in the intermediate-size plots (25 bowls between treatments M− 100 and M +40 in P200, 22 bowls between M − 100 and M+ 60 in P160, 22 bowls in P120). It is lower (PB 0.05) in P80
B. Dumont, D.R.C. Hill / Ecological Modelling 141 (2001) 201–215
211
size plots. Finally, we calculated the efficiency of ewes’ searching behaviour as the amount (in g) of pellets consumed per animal and per minute of searching (averaged over the 12 days of a series). The curves in Fig. 8 show the interaction between plot size and memory capacity on an animal’s searching efficiency. Whatever the size of the plot, searching efficiency increases with memory capac-
(16 bowls) and in P240 (11 bowls). In P40, the maximum number of bowls visited in 30 min first increases (15 bowls between M −100 and M− 40) and then decreases (12 bowls between M − 40 and M + 100) with the increase of memory capacity. These variations in plateau height related to changes in memory capacity are, however, weaker (P B 0.05) that those observed in the intermediate-
Table 2 Effect of the social attraction (tx – attir), when animals are searching for bowls on the performance of individual ewes foraging in a group of threea tx – attir 80×80 m2 No. of bowls visited Pellets consumed (g) Efficiency of search In bowls/min In g of pellets/min 160×160 m2 No. of bowls visited Pellets consumed (g) Efficiency of search In bowls/min In g of pellets/min a
0
10
25
40
55
70
85
100
Significance of effect
65.3
66.0
65.6
66.1
65.4
66.1
65.2
64.7
NS
179.9a
180.4a
176.0b
175.2b
169.7c
168.5c
162.1d
158.0e
PB0.001
3.90a 10.77a
3.93a 10.74a
3.92a 10.52b
4.00b 10.59ab
4.00bc 10.41bc
4.03bc 10.30c
3.99b 9.91d
4.05c 9.90d
PB0.001 PB0.001
31.9abc
31.3bc
34.2a
33.3ab
33.4ab
30.3c
30.8bc
29.6c
PB0.01
107.8a
103.2ab
108.6a
103.2ab
100.5b
89.2c
86.8cd
82.2d
PB0.001
2.02a 6.84a
2.06b 6.81ab
2.10b 6.68abc
2.14c 6.66abc
2.21d 6.65abc
2.25e 6.65bc
2.28e 6.45d
2.34f 6.55cd
PB0.001 PB0.001
Within each row, letters with different subscripts differ (PB0.05).
Fig. 6. Extrapolation of simulation results to the effect of plot size on the number of bowls visited by an individual ewe foraging in a group of three, during 12 days, when the position of preferred feeding sites was not changed. For each plot size, the arrow indicates the day from which the number of bowls visited in a test is not significantly different from that on day 12.
212
B. Dumont, D.R.C. Hill / Ecological Modelling 141 (2001) 201–215
Fig. 7. Extrapolation of simulation results to plateau height (number of bowls visited by each ewe in 30 min on day 12) according to plot size and memory capacity of the animals. M represents model outputs with the memory size (min – mem and max – mem) and memory persistence (tx – mem) parameters used to validate it. These parameters were then each successively reduced and increased by 20%, 40%, 60%, 80% and 100% (in treatment M− 100, memory size and memory persistence parameters have been reduced by 100%, etc.).
Fig. 8. Extrapolation of simulation results to sheep searching efficiency (g of pellets consumed by an individual ewe per minute of searching) according to plot size and memory capacity of the animals. M represents model outputs with the memory size (min – mem and max – mem) and memory persistence (tx – mem) parameters used to validate it. These parameters were then each successively reduced and increased by 20%, 40%, 60%, 80% and 100% (in treatment M −100, memory size and memory persistence parameters have been reduced by 100%, etc.).
B. Dumont, D.R.C. Hill / Ecological Modelling 141 (2001) 201–215
ity (PB0.001). The effect of an increase in memory capacity on searching efficiency (always considered between M −100 and M +100) is higher (P B 0.05) in the two smaller plots (+ 6.4 g/min in P40, + 4.3 g/min in P80) compared with the four larger ones (between 2.2 and 3.2 g/min).
6. Conclusion The model presented here is the result of close collaboration between ethologists and simulationists. We were able to validate this model on two plots of different sizes grazed by groups of three sheep. Social behaviour and interactions played a significant role in model calibration, thus justifying the choice of the multi-agent approach. As the situation under study was complex, it was important to recreate an artificial universe in a reduced simulated laboratory where all parameters could be added, removed and their values precisely controlled by domain experts. The VIS helped domain experts perform an active task in the simulation flow. The purpose was to use the system like a small laboratory where a domain expert could provide feedback, moving the entities, changing their behaviour and modifying the environment states. The model design could be enhanced by adding a Geographical information system link. This would enable the study of spatial memory with simulations on explicit maps. We could adopt an approach close to that proposed by Carter and Finn (1999) in an expert system that allows the creation of spatially explicit IBMs. Simulation results are consistent with field data, and enable us to describe this system further. For example, we show that as plot size increases, the lower but also the later the plateau of number of bowls visited in a test. This last point could have been assumed from the analysis of some of the curves obtained in the experiment, but given the limited number of replicates, statistical analyses were not powerful enough to demonstrate it formally. But the main interest of this simulation work is that it enables us to test the effect of model inputs on the behaviour of the system, and to extrapolate to conditions not amenable to experimentation. For example, by changing the degree of social
213
attraction between animals, when they were searching for bowls, we showed that foraging efficiency of an animal (expressed in g of pellets consumed per minute of searching) decreased together with the increase in conspecific attraction within the group. The ewes missed the opportunity to find new sites with pellets being frequently attracted by their peers feeding on previously discovered sites, and on sites they faced the effects of feeding competition for a rare resource. Beauchamp et al. (1997) argued that conspecific attraction could prevent social foragers from learning feeding site value in habitats, where feeding sites deplete rapidly, and that this would reduce their foraging efficiency. Our results support Beauchamp’s conclusion that conspecific attraction can have marked and often disruptive effects on the spatial distribution of foragers in a patchy habitat. The second main conclusion of this extrapolation work is that the advantages of having a good spatial memory vary according to the complexity of the environment. Spatial complexity influences the use of spatial memory, which has already been shown by changing the number and (or) size of locations to be remembered (Olton et al., 1981; Benhamou, 1994), testing animals with or without proximal cues near the rewarded locations (Edwards et al., 1996; Laca and Ortega, 1996) in a stable or a variable environment (Howery et al., 2000), or manipulating the spatial distribution of the resource the animals are searching for (Dumont et al., 2000). Food-storing birds possess advantages over non-storing birds in their learning and spatial memory abilities and their accuracy in a spatial task was slightly less affected by the proximity of distractors than non-storers (McGregor and Healy, 1999). Here, we varied the difficulty of finding the preferred food by offering sheep a fixed number of bowls in plots of different sizes, and we simultaneously and directly manipulated their memory capacity. In the small plots, increasing the memory capacity of animals had a limited effect on the number of bowls visited in a test, because bowls were easy to find whatever the animals’ searching tactic. In the smallest of all plots, increasing the memory capacity of animals even caused them to visit fewer bowls because they returned very efficiently to previously visited sites and did not explore the whole plot. Under
214
B. Dumont, D.R.C. Hill / Ecological Modelling 141 (2001) 201–215
such conditions, it would be advantageous for animals to keep plasticity in the way they use their spatial memory. However, it is in these small plots that the increase in searching efficiency (in g pellets/min) with memory capacity was the strongest. Spatial memory would thus still have an adaptive value there if the time allowed to foraging was constrained by the need to meet high nutrient requirements (Belovsky, 1978), to avoid predators (Berger, 1991) or to limit the effects of harsh climatic conditions (Parker et al., 1996). As plot size increased, the bowls became more and more difficult to find, so that an increase in memory capacity resulted in an increase in the number of bowls visited. The effect of memory capacity on an animal’s searching efficiency was, however, weaker, indicating that the increase in number of bowls visited was mainly the consequence of a prolonged searching effort. Finally, in the largest plot where bowls were even more difficult to find, an increase in memory capacity had only a limited effect on both the number of bowls visited and the animal’s searching efficiency. Under these constraining environmental conditions, spatial memory lost a lot of its adaptive value.
Acknowledgements We thank C. Roux for help in the model implementation, and J.A. Beecham, P. D’hour, A. Boissy and F. Blanc for helpful comments on the manuscript.
References Bailey, D.W., Rittenhouse, L.R., Hart, R.H., Richards, R.W., 1989. Characteristics of spatial memory in cattle. Appl. Anim. Behav. Sci. 23, 331 –340. Bailey, D.W., Gross, J.E., Laca, E.A., Rittenhouse, L.R., Coughenour, M.B., Swift, D.M., Sims, P.L., 1996. Mechanisms that result in large herbivore grazing distribution patterns. J. Range Manage. 49, 386 –400. Beauchamp, G., Be´ lisle, M., Giraldeau, L.-A., 1997. Influence of conspecific attraction on the spatial distribution of learning foragers in a patchy habitat. J. Anim. Ecol. 66, 671– 682.
Beecham, J.A., Farnsworth, K.D., 1998. Animal foraging from individual perspective: an object orientated model. Ecol. Model. 113, 141 – 156. Bell, P.C., O’Keefe, R.M., 1987. Visual Interactive Simulation: history, recent developments and major issues. Simulation 49, 109 – 116. Belovsky, G.E., 1978. Diet optimization in a generalist herbivore: the moose. Theor. Pop. Biol. 14, 105 – 134. Benhamou, S., 1994. Spatial memory and searching efficiency. Anim. Behav. 47, 1423 – 1433. Berger, J., 1991. Pregnancy incentives, predation constraints and habitat shifts: experimental and field evidence for wild bighorn sheep. Anim. Behav. 41, 61 – 77. Breckling, B., Mu¨ ller, F., 1994. Current trends in ecological modelling and the 8th ISEM conference on the state-ofthe-art. Ecol. Model. 75, 667 – 675. Buxton, J.N, Laski, J.G., 1962. Control and simulation language. Comp. J. 5, 194 – 199. Campos, A.M.C., Hill, D.R.C., 1998. An agent-based framework for visual-interactive ecosystem simulations. SCS Trans. 15, 139 – 152. Carter, J., Finn, T., 1999. MOAB: a spatially explicit, individual-based expert system for creating animal foraging models. Ecol. Model. 119, 29 – 41. Coquillard, P., Hill, D.R.C., 1997. Mode´ lisation et simulation d’e´ cosyste`mes-Des mode`les de´ terministes aux simulations a` e´ ve´ nements discrets. In: Collection Ecologie. Masson, Paris, p. 273. De Angelis, D. and Gross, L.J., 1992. Individual-based models and approaches in ecology: populations, communities, and ecosystems, Chapman and Hall, New York. Doram, J., 1997. From computer simulation to artificial societies. SCS Trans. 14, 69 – 77. Drogoul, A., Corbara, B., Lalande, S., 1995. MANTA: new experimental results on the emergence of (artificial) ant societies. In: Gilbert, N., Conte, R. (Eds.), Artificial Societies: The Computer Simulation of Social Life. UCL Press, London, pp. 190 – 211. Dumont, B., Petit, M., 1998. Spatial memory of sheep at pasture. Appl. Anim. Behav. Sci. 60, 43 – 53. Dumont, B., Maillard, J.F., Petit, M., 2000. The effect of the spatial distribution of plant species within the sward on the searching success of sheep when grazing. Grass For. Sci. 55, 138 – 145. Edwards, G.R., Newman, J.A., Parsons, A.J., Krebs, J.R., 1996. The use of spatial memory by grazing animals to locate food patches in spatially heterogeneous environments: an example with sheep. Appl. Anim. Behav. Sci. 50, 147 – 160. Ferber, J., 1999. Multi-Agent Systems – An Introduction to Distributed Artificial Intelligence. Addison-Wesley, Reading, MA. Fowler, M., Scott, K., 1997. UML Distilled. Addison-Wesley, Longman, p. 183. Gamma, E., Helm, R., Johnson, R., Vlissides, J., 1995. Design Pattern-Elements of reusable Object-Oriented Software. Addison-Wesley, Reading, MA.
B. Dumont, D.R.C. Hill / Ecological Modelling 141 (2001) 201–215 Gillingham, M.P., Bunnell, F.L., 1989. Effects of learning on food selection and searching behaviour of deer. Can. J. Zool. 67, 24 – 32. Grimm, V., 1999. Ten years of individual-based modelling in ecology: what have we learned and what could we learn in the future? Ecol. Model. 115, 129 –148. Hill, D.R.C., 1996. Object-Oriented Analysis and Simulation. Addison-Wesley, Reading, MA, p. 291. Hill, D.R.C., Coquillard, P., de Vaugelas, J., Meinesz, A., 1998. An algorithmic model for invasive species: application to Caulerpa taxifolia (Vahl) C. Agardh development in the North-Western Mediterranean Sea. Ecol. Model. 109, 251 – 265. Hirvonen, H., Ranta, E., Rita, H., Peuhkuri, N., 1999. Significance of memory properties in prey choice decisions. Ecol. Model. 115, 177 – 189. Howery, L.D., Bailey, D.W., Ruyle, G.B., Renken, W.J., 2000. Cattle use visual cues to track food locations. Appl. Anim. Behav. Sci. 67, 1 – 14. Hurrion, R.D., 1976. The design, use and required facilities of an Interactive Visual Computer Simulation Language to explore production planning problem, PhD Thesis, Univ. of London. Huston, M., De Angelis, D., Post, W., 1988. New computer models unify ecological theory. Computer Simulation shows that many ecological patterns can be explained by interactions among individual organisms. BioScience 38, 682– 691. Laca, E.A. and Ortega, I.M., 1996. Integrating foraging mechanisms across spatial and temporal scales. In: West N.E. (Ed.), Rangelands in a Sustainable Biosphere. Proceedings of the Fifth International Rangeland Congress, Salt Lake City UT, vol. II, pp. 129 –132. McGregor, A., Healy, S.D., 1999. Spatial accuracy in foodstoring and nonstoring birds. Anim. Behav. 58, 727 –734. Olton, D.S., Handelmann, G.E., Walker, J.A., 1981. Spatial memory and food searching strategies. In: Kamil, A.C.,
.
215
Sargent, T.D. (Eds.), Foraging behavior – Ecological, Ethological, and Psychological Approaches. Garland STPM Press, New York, pp. 333 – 354. Parker, K.L., Gillingham, M.P., Hanley, T.A., Robbins, C.T., 1996. Foraging efficiency: energy expenditure versus energy gain in free-ranging black-tailed deer. Can. J. Zool. 74, 442 – 450. Pidd, M., 1992. Object-orientation and three phase simulation. In: Proceedings of the Winter Simulation Conference, pp. 689 – 693. Railsback, S.F., Lamberson, R.H., Harvey, B.C., Duffy, W.E., 1999. Movement rules for individual-based models of stream fish. Ecol. Model. 123, 73 – 89. Roese, J.H., Risenhoover, K.L., Folse, L.J., 1991. Habitat heterogeneity and foraging efficiency: an individual-based model. Ecol. Model. 57, 133 – 143. SAS, 1989. SAS/STAT® User’s Guide (Release 6.11), SAS Inst. Inc., Cary, NC. Shiyomi, M., Tsuiki, M., 1999. Model for the spatial pattern formed by a small herd in grazing cattle. Ecol. Model. 119, 231 – 238. To¨ cher, K.D., 1963. The Art of Simulation. English University Press, London. Tu, X., Terzopoulos, D., 1994. Artificial fishes: physics, locomotion, perception and behaviour. In: Proceedings of SIGGRAPH. ACM Press, Orlando, FL, pp. 43– 50. Turner, N.G., Wu, Y., Romme, W.H., Wallace, L.L., 1993. A landscape simulation model of winter foraging by large ungulates. Ecol. Model. 69, 163 – 184. Uhrmacher, A.M., 1997. Concepts of object- and agent-oriented simulation. SCS Trans. 14, 59 – 67. Wooldrige, M., Jennings, N.R., 1995. Intelligent agents: theory and practice. Knowl. Eng. Rev. 10, 115 –152. Zeigler, B.P., 1990. Object-oriented simulation with hierarchical, modular models – Intelligent agents and endomorphic systems, Academic Press, San Diego, CA.