Multi-Channel Interference Measurements for Wireless Sensor Networks ... Our observa- tions show that adjacent spectrum interference influences the data ...
Multi-Channel Interference Measurements for Wireless Sensor Networks Ozlem Durmaz Incel, Stefan Dulman, Pierre Jansen, Sape Mullender Department of Computer Science, University of Twente PO-Box 217, 7500 AE Enschede The Netherlands {durmazo, dulman, jansen, sape}@cs.utwente.nl Abstract
erate on multiple channels (the terms “channel” and “frequency” are used interchangeably in the text) rather than a single channel, multiple transmissions can take place on the wireless medium without interfering with each other. Today’s transceiver hardware, which is used for sensor nodes, supports the operation on multiple frequencies. For example, the Ambient µNode’s [1] radio and the CC2420 radio [2] for MICAz and Telos sensor nodes can be tuned to different frequencies. Using multiple channels instead of a single one in multihop wireless ad hoc networks has been shown to be able to improve the network throughput considerably [10]. Many MAC and routing protocols that use multiple channels were introduced for wireless ad hoc networks [6, 8, 12]. Moreover, multi-frequency MAC protocols especially designed for WSN have also been recently introduced [5, 16]. Several practical experiments have been performed to test the link layer characteristics of WSN for singlefrequency systems, [11, 14, 15]. Kurth et al. [7] and Mishra et al. [9], have presented experiments and observations about the behavior of multi-frequency systems for ad-hoc networks. When we look into the WSN, characteristics are quite different from the ad-hoc networks. A typical sensor device is usually equipped with a single half-duplex radio transceiver, which can not perform simultaneous transmission and reception, but can work on different channels separately. On the other hand, traditional wireless ad-hoc networks usually assume more powerful radio hardware and multiple transceivers per node. For instance, the typical bandwidth offered by WSN is usually very limited (e.g., 50Kbps). Because of the above reasons, it is interesting to experiment and observe the multi-channel interference behavior in WSN. Moreover, there is no standard protocol for multichannel communication in WSN so far and our observations have implications for the design of multi-frequency WSN protocols. If the channels are orthogonal, simultaneous transmissions can take place on multiple channels without interfer-
This paper presents measurements of radio interference using ”Ambient µNode” sensor nodes. By varying distances and frequencies we get a measure of the interference caused by transmissions on adjacent bands. Our observations show that adjacent spectrum interference influences the data delivery, considerably. Channels should be separated in the spatial or in the frequency domains if interference is to be avoided. In addition, the distance to simultaneous transmitters and the number of simultaneous transmissions are highly correlated with channel spacing. Therefore, channel spacing can be adjusted according to spatial distances so that multiple concurrent transmissions can be performed without interference. We also give proposals for further investigation on the usage of this correlation that are relevant to the design of future multi-channel protocols.
1
Introduction
Wireless Sensor Networks (WSN) is an evolving technology that is the fundament of various ubiquitous applications. A WSN is embedded into the real world and enables monitoring, inspection and analysis of unknown, untested environments. It typically comprises a large number of battery operated, tiny sensor devices. Sensor nodes are designed to collect sensor data and to transmit readings by wireless communication. With the growing interest, in the near future, WSN will be deployed in large numbers everywhere [4] — perhaps on the order of hundreds or thousands [3]. Besides the deployment in large numbers, other factors which will cause a competitive communication environment are the limited channel capacity and the influence of interference due to external networks or electronic devices, that share the same parts of the spectrum. The main reason for this competition is that nodes share a single wireless channel. If the transceiver used for wireless communication is able to op-
1-4244-0419-3/06/$20.00 ©2006 IEEE
694
ence. However, radio signals are not bounded to a single point in the spectrum but are distributed around a ‘mid’ frequency. Therefore, channel overlap is examined between adjacent bands. The primary objective of our experiments is to observe the level and the effect of adjacent spectrum interference. Another issue is the spatial reuse of the channels due to the multi-hop nature of WSN. The relationship between these factors is investigated: what is the correlation between spatial distances and required channel distances? We show that there is a high correlation between channel spacing and spatial spacing. Hence, channel spacing can be adjusted according to the spatial distances so that multiple concurrent transmissions can be performed without interference. In conclusion, the number of channels that can be used simultaneously changes according to the spatial distances between the transmissions. Moreover, the number of simultaneous transmissions on different channels may affect the performance of wireless links. The relationship is also investigated with different number of simultaneous transmissions. The rest of the paper is organized as follows: Section 2 explains the methodology, the hardware and the parameters that are used during the experiments. Section 3 introduces the experiments related with distance and channel spacing, and also the correlation between these factors. Section 4 presents the experiments about the number of simultaneous transmissions and its effects on the channel spacing. Section 5 discusses some concluding remarks and suggestions for future work.
nodes are not directly put on the ground but elevated by placing on 20cm-high boxes. We place the nodes on a line topology with 15m distance between each other.
2.3
Methodology
The ”Ambient µNode” sensor node platform is used during the experiments. The platform has a Texas Instruments MSP430F169 processor with 48 kB Flash memory (code) and 10kB of RAM (data) and operates on a 32 kHz clock. 4Mb EEPROM memory is available for permanent storage. The sensor platform is equipped with a single-chip radio transceiver that can operate on the 868/915 MHz ISM band. The modulation of the transceiver is Gaussian Frequency Shift Keying (GFSK) and the data is internally Manchester coded. The transceiver automatically generates preamble and CRC (cyclic redundancy check). An on-board dipole antenna is integrated. The radio frequency of the platform is adjustable. It provides 512 channels with 200kHz channel width and 200 kHz channel spacing.
In the experiments, there are three different roles of the nodes: transmitter, receiver, and jammer. The transmitter sends out packets with sequence numbers every 1/8 second. The number of packets is set to be 256 packets for each run. The receivers maintain a log of the received packets in their EEPROM and operate on the same frequency as the transmitter. At the end of the tests, the data from the loggers of the receivers are downloaded to a laptop. The jammer node is a transmitter whose operating frequency is adjusted to a different channel at each run. The transceiver provides 512 channels, thus in each turn both the transmitter and the jammer are set to send 512*256 packets. They are set to transmit the packets simultaneously to observe the level of interference among different channels. The jammer’s position is changed to observe the relationship between distance and channel spacing. Each run takes 8 seconds, and each turn takes approximately 68 minutes for each position of the jammer. To prevent variations due to different battery status, all the sensor nodes are equipped with brand-new batteries. Interference level is used as an indicator for the link quality. We define the interference level as the loss rate at the receivers. There are various factors that can influence the data delivery performance in wireless networks: the environment, the network topology, traffic patterns, hardware characteristics, etc. Environmental characteristics and obstacles cause signals to be reflected, diffracted and scattered. Background noise, human activity, temperature, humidity are all external factors that can influence the data reception. Also the activity of other networks sharing the same unlicensed portions of the radio spectrum may affect the results. Hardware characteristics such as antenna type, antenna gains, transmission power, receiver sensitivity, battery status, modulation schemes are the other factors that may affect the performance. In our experiments, external factors, such as the topology, the indoor environment, and the sensor nodes are the same. We perform the experiments during the evenings to reduce the effect of human activity on the results. In order to see the stability of the links over time, we repeat the experiments on different days. Results of the experiments are averaged for different sets which are performed on different days.
2.2
3
2 2.1
Preliminaries Hardware and Transceiver Platform
Environment and Topology
Tests are performed in a large office corridor which is about 150m long and 2m wide. The floor is carpeted. The
Spatial Distance versus Channel Distance
We investigate the interference level versus channel spacing with respect to the distance of a receiver to the jam-
695
mer and the transmitter. By varying the position and the operating frequency of the jammer, the amount of interference is measured on adjacent bands for different spatial distances. In the rest of the paper, we use the following abbreviations for the parameters:
100
Interference Level(%)
90
• ∆ represents the distance between the transmitter and a receiver. • Γ represents the distance between the jammer and a receiver. • Ψ represents the channel spacing between the jammer’s frequency and a receiver’s frequency.
80 70 60 50 40 30 20 10
Γ:-45 Γ:-30 Γ:-15 Γ:0 Γ:15 Γ:30
0 -15
, , , , , ,
-13
∆:-15 ∆:-15 ∆:-15 ∆:-15 ∆:-15 ∆:-15 -11
-9
-7
-5
-3
-1
1
3
5
7
9
11
13
15
11
13
15
ψ
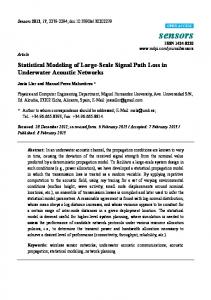
Note that these parameters can take negative values. For instance, when the jammer is positioned to the left of a receiver, Γ is negative and when it is to the right of a receiver it has a positive value. When the jammer is transmitting on channel 134 (in decimal) and a receiver is receiving on frequency 144, Ψ equals to -10. There are four receivers, located at 30m, 45m, 60m, and 75m from the jammer’s initial position. The transmitter is positioned at 15m, during all the experiments. We do not use more nodes and do not locate them further than 75m. This is because, our aim is to see the multi-channel interference within a single-hop (the reception rate at a receiver located further is found to be very low without the presence of a jammer). The jammer is placed at a different position for each run:
Figure 1. Interference level at 30m 100
Interference Level(%)
90 80 70 60 50 40 30 20 10
Γ:-45 Γ:-30 Γ:-15 Γ:0 Γ:15 Γ:30
0 -15
-13
, , , , , ,
∆:-30 ∆:-30 ∆:-30 ∆:-30 ∆:-30 ∆:-30 -11
-9
-7
-5
-3
-1
1
3
5
7
9
ψ
• At 0m. • At 15m, next to the transmitter (in the text, when we refer ”the jammer is next to”, this means that the distance to the jammer is 20cm, due to width of the boxes on which the nodes are placed. However, we present Γ=0, in these cases). • At 30m, next to the first receiver. • At 45m, next to the second receiver. • At 60m, next to the third receiver. • At 75m, next to the fourth receiver.
Figure 2. Interference level at 45m
3.1
Observations
We observe that the level of interference on adjacent bands can be adjusted according to spatial and frequency distances. There is a high correlation between channel spacing and spatial spacing. Hence, the channel spacing and, in turn, the number of channels that can be used simultaneously, changes according to the spatial distances between the transmitters. The correlation between these factors is computed in Section 3.2 in terms of the level of interference. Furthermore, we also explore the usage of this correlation for WSN. First, we explain our observations and discuss possible reasons for the observations. A general observation is that, as channel distance (Ψ) changes, the level of interference changes as a function of the spatial distance at every receiver. For instance, independent from the location of a receiver, if ∆=Γ, every receiver experiences interference by the jammer when it operates on the same channel as the transmitter and/or on adjacent channels (−1 ≤ Ψ ≤ 1) at different interference levels. According to this observation, when both the jammer and the transmitter are using the same channel, co-channel interference
The transmitter and receivers always operate on a base frequency of 873.6MHz (channel 144) and the jammer adjusts its transmitting frequency over 512 channels at each run. The operating frequency of the receivers and the transmitter is also changed to test whether the interference behavior is the same. This behavior is found to be similar for different operating frequencies. However due to lack of space, we will not present all the results in this paper. Figures 1, 2, 3, 4 show the results for the interference level at the receivers versus the channel spacing.In the figures only a subset of the channels are shown instead of all the 512 channels, also due to the limited space. For the channels not shown, the interference level at the receivers is 0%.
696
if −5 ≤ Ψ ≤ 7 or Ψ = 10. The same observation holds for all the receivers. Therefore, when the jammer operates on adjacent spectrum, this also affects the transmissions due to out-of-band emissions.
100
Interference Level(%)
90 80 70 60
When the jammer is closer than the transmitter, there is always interference at all receivers. However, when the distance between a receiver and both the jammer and the transmitter is the same, in most of the cases there is interference but there are also cases with no interference effect. For instance, when ∆ = −15 and Γ = 15, the receiver at 30m is at the same distance to the jammer and the transmitter (Figure 1). One would expect higher interference level implying that neither of the packets or few of the packets are received correctly. However, the receiver loses only 30% of the packets when Ψ=0 and it is not interfered when Ψ �= 0. This observation shows that, the idealized collision model – when transmissions are simultaneous and initiated from the same distance, packets are lost due to collision– is not always correct but simultaneous transmissions can successfully be decoded. In other words, one packet may be corrupted while the other is received correctly. One possible explanation of this observation is that signal strength is not isotropic, so it varies on different directions [11, 15].
50 40 30 20 10
Γ:-45 Γ:-30 Γ:-15 Γ:0 Γ:15 Γ:30
0 -15
, , , , , ,
-13
∆:-45 ∆:-45 ∆:-45 ∆:-45 ∆:-45 ∆:-45 -11
-9
-7
-5
-3
-1
1
3
5
7
9
11
13
15
11
13
15
ψ
Figure 3. Interference level at 60m 100
Interference Level(%)
90 80 70 60 50 40 30 20 10
Γ:-45 Γ:-30 Γ:-15 Γ:0 Γ:15 Γ:30
0 -15
-13
, , , , , ,
∆:-60 ∆:-60 ∆:-60 ∆:-60 ∆:-60 ∆:-60 -11
-9
-7
-5
-3
-1
1
3
5
7
9
When the transmitter is closer than the jammer, in most of the cases there is no interference at the receivers. However, there is an exception: when Γ = -75, the receiver at 75m is interfered when the jammer is on the same channel or on the adjacent channels (Figure 4). Therefore the receiver cannot receive any packets from the transmitter, although the jammer is positioned further. This can be explained by environmental factors such as the multipath effect. The shape of the corridor allows the wireless signals to be reflected by the walls so that multiple copies of the jammer’s signals may be received stronger than the transmitter’s. Thus, signals initiated from a further position are not always weaker than the signals that are initiated from a closer distance. On the other hand, we do not observe other examples of this conflict in this result set.
ψ
Figure 4. Interference level at 75m occurs. In addition, when they are using adjacent channels,“Adjacent Channel Interference” (ACI) occurs. The level of interference varies at different receivers since Γ also varies for each receiver. Non-perfect receiver selectivity can result in ACI between consecutive channels. Imperfections in the transmit filter also cause the signal energy to spread over the adjacent spectrum (out-of-band emission). For the experimental radio platform, the 1st adjacent channel transmission power is −27 dBc and 2nd adjacent channel transmission power is −54 dBc. Also receiver selectivity values are given as follows: for the 1st adjacent channel −7dB, for the 2nd adjacent channel −16dB, respectively. According to our observations, when the jammer is getting closer to a receiver, the interference over the adjacent spectrum spreads over a larger interval, thus the channel spacing should be larger to prevent interference. For example, in Figure 2, the receiver at 45m does not experience any interference when Γ = −45. When Γ = −30, there is interference if −1 ≤ Ψ ≤ 1. When the jammer comes closer, such that Γ = −15, the interference occurs if −1 ≤ Ψ ≤ 1 and Ψ = 4. When the jammer is just next to the receiver (Γ = 0), the receiver experiences interference
Another observation is about the symmetry of the channel spacing. In the figures, mostly the interference level is symmetric with respect to the operating frequency, such that the same level of interference occurs between −n ≤ Ψ ≤ n. However, this is not true for some of the cases. For instance, in Figure 3 the receiver is 100% interfered when −8 < Ψ < 8 and Γ = 0. On the other hand, when Γ = 15, there is interference when −5 < Ψ < 7. 80% of the results are found to be symmetric in the result set. Producing small error margins would take massive amounts of measuring, given that small, local factors (as we explain in Section 2.3) change performance dramatically. Thus, unexpected asymmetry is insignificant.
697
3.2
Correlation between Distance and Channel Spacing
Receiver’s Position 30m 45m 60m 75m
According to the results explained above, we investigate the correlation between Γ, ∆ and Ψ. The term “interference interval” is used to indicate the number of channels on which the receiver is interfered by the jammer. One could say that the interference interval should be two times the required channel spacing to avoid interference. However, the interference level with respect to channel spacing is not symmetrical around the mid operating frequency. Computations on the interference interval are given in Section A. Signal strength decreases with the square of the distance [13] according to the free space path loss model (for the simplicity of discussion, we assume an open-space environment). Moreover, the background noise and simultaneous activities (interference) affect the received signal strength. If this is above the receiver’s selectivity threshold value, then the signal is received correctly by the receiver. The signal-to-Interference Ratio (SIR) is calculated as follows: SIR =
( P athPtLoss ) N oise
Table 1. Correlation coefficients SIRd in decibels is: SIRddB = 10log(SIRd )
T ) ( P athPLoss T J ( P athPLoss ) J
(1)
(2)
SIRd represents the signal strength ratio of the jammer and the transmitter with respect to distance. PT and PJ represent the sending power at the transmitter and the jammer, P ath LossT and P ath LossJ represent the path losses of the transmitter and the jammer respectively. Since both the transmitter and the jammer send out packets with the same power, SIRd is basically the ratio of the path losses. We simplify Equation 2 as: SIRd =
P ath LossJ P ath LossT
(3)
According to model, loss is calculated as follows: Loss =
(4Πd)2 λ2
(4)
where d is the distance between antennas and λ is the wavelength of the carrier. Since both of the senders have the same values for λ, SIRd is the ratio of the square of the distances. Simplifying Equation 7: SIRd =
Γ2 ∆2
(6)
After computing the interference interval and SIRd we obtain the correlation coefficients for each receiver. Table 1 shows the correlation coefficients, for the receivers. According to the results, the correlation between two parameters for all receivers is close to −1. This means that there is a negative relationship between SIRd and the interference interval, when one increases, the other decreases. In other words, when the signal strength decreases at the receiver due to jammer’s position, the number of channels on which the receiver’s performance is degraded, increases. Besides computing the correlation coefficients for individual receiver behaviors, we computed the coefficients for all the results. The overall correlation is found to be −0.856978532. These results show that, with a high probability, one can predict the value of one parameter by knowing the value of the other. With the knowledge of this correlation, channel spacing can be adjusted according to the spatial distances so that multiple concurrent transmissions can be performed without interference. For instance, when a WSN is deployed, the positions can be adjusted such that interference interval is smaller and more simultaneous transmissions can take place on more frequencies. Moreover, proper channel assignment can be performed by the sensors locally by collecting interference data and infer the value of the proper channel to be used. This relationship is an important information for the MAC layer at the channel assignment phase. The correlation between the interference interval and SIRd can also be used to estimate the relative positions of sensor nodes. For instance, three sensor nodes can estimate their relative positions by using the same methodology in our experiments: assign roles (jammer, transmitter, receiver), perform transmissions, collect data and infer the relative positions. They can further exchange their roles to provide more accurate results. Moreover, these results can be used to calculate the optimal throughput with perfect knowledge of position and channel spacing requirements. For instance, if two channels mostly overlap and the throughput is reduced by, say 15% on each channel, we still have 1.7 times the bandwidth of one channel. These calculations can represent the upper bound which is a maximum that can be achieved, with
where Pt represents the signal power at the transmitter. We adopt Equation 1, to calculate the relative signal strengths of the transmitter and the jammer with respect to distance. We simplify SIR for the receivers as follows: SIRd =
Correlation Factor -0.985429 -0.966700 -0.910817 -0.977221
(5)
698
Γ:45 Γ:30 Γ:15 Γ:0 Γ:-15
100
80
, , , , ,
∆:-15 ∆:-15 ∆:-15 ∆:-15 ∆:-15
Γ:30 Γ:15 Γ:0 Γ:-15 Γ:-30
100 90 Interference Level(%)
Interference Level(%)
90
70 60 50 40 30
80 70 60 50 40 30
20
20
10
10
0
0 -28
-24
-20
-16
-12
-8
-4
0
4
8
12
16
20
24
28
-28
-24
-20
-16
-12
-8
-4
ψ
0
4
8
12
16
20
24
28
ψ
Figure 5. Interference level at 30m
Figure 6. Interference level at 45m
global knowledge. The performance of multi-channel MAC algorithms can be compared with this maximum. To summarize, adjacent channel interference also plays an important role besides the co-channel interference, on the data delivery rate. The observations expressed so far have an important impact on multi-channel protocol design for WSN. If the channels are assigned properly, simultaneous transmissions can take place without disturbing each other. Observing only the co-channel interference is not sufficient for multi-frequency systems, also the adjacent spectrum interference should be considered.
4
∆:-30 ∆:-30 ∆:-30 ∆:-30 ∆:-30
, , , , ,
100 Γ:15 Γ:0 Γ:-15 Γ:-30 Γ:-45
Interference Level(%)
90 80 70
∆:-45 ∆:-45 ∆:-45 ∆:-45 ∆:-45
, , , , ,
60 50 40 30 20 10 0 -28
Spatial Distance versus Channel Distance Multiple Jammers
-24
-20
-16
-12
-8
-4
0 ψ
4
8
12
16
20
24
28
Figure 7. Interference level at 60m
The number of simultaneous transmissions in the environment is another important factor which may affect the results. In this set of experiments, the effect of the number of jammers is investigated. We experiment with double jammers and also with triple jammers. However, due to the space limitations, the results for the double jammers are not presented. Instead, results for triple jammers is presented where the data delivery rate is worse than the results for the double jammers. The results of this set can be compared with the results in Section 3 where only a single jammer is active. The transmitter and the receivers operate on 873.6MHz (144 Decimal) and the jammers adjust the operating frequency over 512 channels at each run and send out packets simultaneously with the transmitter. Since the jammers are always positioned together, Γ has the same meaning. Figures 5, 6, 7, 8 show the results on the interference level at the receivers. In Section 3 we mentioned that, when Γ=∆, independent from the location of a receiver, there is interference when the jammer operates on the same channel or on the adjacent channels. However, when triple jammers are positioned next to the transmitter, all the receivers expe-
100 Interference Level(%)
90 80 70 60 50 40
Γ:0 Γ:-15 Γ:-30 Γ:-45 Γ:-60
30 20 10
, ∆:-60 , ∆:-60 , ∆:-60 , ∆:-60 , ∆:-60
0 -28 -24 -20 -16 -12 -8
-4
0
4
8
12
16
20
24
28
ψ
Figure 8. Interference level at 75m rience interference when −12 ≤ Ψ ≤ 8. The interference level at different receivers is still similar over a wider adjacent spectrum with more jammers. When there are 3 jammers located next to the receiver at 30m (Γ=0), there is interference when −16 ≤ Ψ ≤ 16, over 32 channels. This is shown in Figure 5. However, the
699
Receiver’s Position 30m 45m 60m 75m
only co-channel interference but adjacent spectrum interference is also observed. We have tested the channel spacing between simultaneous transmissions for a specific indoor environment. There is a high correlation between the spatial distances and channel spacing. Therefore, channel spacing can be adjusted according to the spatial distances so that multiple concurrent transmissions can be performed without interference. Channel spacing and in turn the number of channels that can be used simultaneously changes according to the spatial distances between the transmissions. Implications about where and how this correlation can be used have been presented. Despite the hardware-specific results, the work in this paper opens up an interesting direction for further investigation and these tests should be performed on different hardware. We plan to investigate the usage of this correlation on the performance of channel assignment algorithms. In addition, it would be interesting to extract the interference information from the active traffic in a real network instead of measuring the interference separately.
Correlation Factor -0.880662 -0.915311 -0.966448 -0.987499
Table 2. Correlation coefficients for triple jammers
interference interval is −5 ≤ Ψ ≤ 8, as shown in Figure 1 with a single jammer. When triple jammers are transmitting next to the receiver at 45m (Γ = 0, Figure 6), the interference level is over 20% within the −24 ≤ Ψ ≤ 24 interval. Triple jammers next to the receivers at 60m and at 75m create interference on all channels mentioned in Figures 7 and 8 when Γ = 0. According to the results of this set, the channel spacing between simultaneous transmitters in the same spatial domain should be larger with more jammers. The required channel spacing for the receivers varies with respect to the spatial distances to the transmitters.
4.1
References
Correlation between Distance and Channel Spacing with more jammers
[1] Ambient-systems unode product sheet, http://www.ambientsystems.net/ambient/download/ambienteet.pdf, 2006. [2] Cc2420, 2.4 ghz, ieee 802.15.4 rf transceiver data sheet, inst.eecs.berkeley.edu/cs150/documents/cc2420.pdf, 2006. [3] I. F. Akyildiz, W. Su, Y. Sankarasubramaniam, and E. Cayirci. A survey on sensor networks. IEEE Communications Magazine, 40(8):102–114, 2002. [4] J. S. Gang Zhou and S. Son. Crowded spectrum in wireless sensor networks. In Proceedings of the Third Workshop on Embedded Networked Sensors (EmNets 2006), Cambridge, MA, May 2006. [5] O. D. Incel, L. van Hoesel, P. Jansen, and P. Havinga. Impact of network density on bandwidth resource management in wsn. Technical Report TR-CTIT-05-43, University of Twente, Enschede, September 2005. [6] N. Jain, S. Das, and A. Nasipuri. A multichannel csma mac protocol with receiver-based channel selection for multihop wireless networks. In Proceedings of the IEEE IC3N, pages 432–439, Phoenix, 2001. [7] M. Kurth, A. Zubow, and J.-P. Redlich. Multi-channel linklevel measurements in 802.11 mesh networks. In IWCMC ’06: Proceeding of the 2006 international conference on Communications and mobile computing, pages 937–944, New York, NY, USA, 2006. ACM Press. [8] C.-Y. Lin. A multi-channel mac protocol with power control for multi-hop mobile ad hoc networks. In ICDCSW ’01: Proceedings of the 21st International Conference on Distributed Computing Systems, page 419, Washington, DC, USA, 2001. IEEE Computer Society. [9] A. Mishra, V. Shrivastava, S. Banerjee, and W. Arbaugh. Partially overlapped channels not considered harmful. SIGMETRICS Perform. Eval. Rev., 34(1):63–74, 2006.
The number of simultaneous transmissions clearly affects the interference level. When there are more jammers, the interference signal is stronger and if the transmitter’s signal is weaker than the interference, packets might be corrupted. In Section 3, SIRd is used to mention the ratio of the signal strengths of the transmitter and the jammer with respect to distance for a single jammer (Equation 7). When there are multiple jammers, SIRd can be computed as; P ath LossT SIRd = � P ath LossJ
(7)
The interference created by the jammers is summed. We compute the correlation coefficients for triple jammers as given in Table 2. These coefficients imply a similar correlation between the spatial distances and the channel distances. Hence, these results support our conjecture about the correlation.
5
Conclusions and Future Work
We have investigated the data link interference behavior of a multi-channel WSN system with an example radio platform. When there are simultaneous transmissions operating on the adjacent spectrum in the same spatial domain, not
700
[10] A. Raniwala and T. cker Chiueh. Architecture and algorithms for an ieee 802.11-based multi-channel wireless mesh network. In Proceedings of IEEE INFOCOM 2005, volume 3, pages 2223–2234, March 2005. [11] N. Reijers, G. Halkes, and K. Langendoen. Link layer measurements in sensor networks. In Proceedings of 1st IEEE International Conference on Mobile Ad-hoc and Sensor Systems, 2004. [12] J. So and N. H. Vaidya. Multi-channel mac for ad hoc networks: handling multi-channel hidden terminals using a single transceiver. In MobiHoc ’04: Proceedings of the 5th ACM international symposium on Mobile ad hoc networking and computing, pages 222–233, New York, NY, USA, 2004. ACM Press. [13] W. Stallings. Wireless Communications and Networks. Prentice Hall Professional Technical Reference, 2001. [14] J. Zhao and R. Govindan. Understanding packet delivery performance in dense wireless sensor networks. In SenSys ’03: Proceedings of the 1st international conference on Embedded networked sensor systems, pages 1–13, New York, NY, USA, 2003. ACM Press. [15] G. Zhou, T. He, S. Krishnamurthy, and J. A. Stankovic. Models and solutions for radio irregularity in wireless sensor networks. ACM Trans. Sen. Netw., 2(2):221–262, 2006. [16] G. Zhou, C. Huang, T. Yan, T. He, J. A. Stankovic, and T. F. Abdelzaher. Mmsn: Multi-frequency media access control for wireless sensor networks. In Proceedings of IEEE Infocom, 2006.
Figure 9. Correlation coefficients for a single jammer.
A Appendix A.1
Interference Interval Calculation
When the jammer is transmitting on a specific channel, if the interference level at a receiver is above 0%, that channel is included in the interference interval. For instance, if the interference level is 100%, this means that 1 channel is totally affected. If the interference level is 40%, the receiver is affected by 40/100 = 0.4 of this channel. Then, we sum the number of channels that the receiver is affected for a specific position of the jammer (Figures 9 and 10).
A.2
SIRd Calculation
The SIRd is computed in dB (Equation 6). Results are shown in Figures 9 and 10. The columns represent the positions of the jammer: at 0m, 15m, 30m, 45m, 60m, 75m.
Figure 10. Correlation coefficients for triple jammers.
701