Advanced Engineering Informatics 24 (2010) 466–475
Contents lists available at ScienceDirect
Advanced Engineering Informatics journal homepage: www.elsevier.com/locate/aei
Multi-dimensional building performance data management for continuous commissioning Ammar Ahmed a,*, Joern Ploennigs a,b, Karsten Menzel a, Brian Cahill a a b
IRUSE, Department of Civil & Environmental Engineering, University College Cork, Ireland Institute of Applied Computer Science, Dresden University of Technology, Germany
a r t i c l e
i n f o
Article history: Received 15 June 2010 Accepted 23 June 2010 Available online 17 July 2010 Keywords: Data warehouse Multi-dimensional data analysis Building performance Energy management User interfaces
a b s t r a c t Current buildings’ performance assessment tools are deficient in their ability to integrate and process building monitoring data to generate actionable information that can assist in achieving a higher level of building performance. Therefore, this paper addresses this problem by proposing the design and implementation of a multi-dimensional data analysis concept for building monitoring data. Firstly, the development of the multi-dimensional performance data model is described based on data warehouse technology. Secondly, a dedicated graphical user interface is introduced bringing the benefits of the multi-dimensional model to different stakeholders. Finally, the advantages of multi-dimensional performance data management is demonstrated in a real life case study for on-site and e-service performance management. Ó 2010 Elsevier Ltd. All rights reserved.
1. Introduction The building Energy and Facility Management domain exhibits inefficiencies in the availability of consistent and complete building performance data. Traditional data storage solutions are insufficiently integrated with data management and analysis tools. Hence, their capabilities to contribute to an improved level of building performance are limited. Therefore, the development of an integrated information model is required, allowing the holistic, multi-dimensional management of building performance data in relation to the buildings energy usage [1]. This would support the aggregation and analysis of building performance data and convenient data extraction procedures that can contribute to accurate decision processes for building control and operation. Improved decision support systems (DSS) could be provided as an arrangement of computerized tools [2] that will assist decision making process ensuring flexible, adaptable, and profitable operation of a building over its life span [3]. The regular analysis and comparisons of building performance against previous measurements and intended performance in the design phase ensure efficient energy performance, particularly during peak usage periods. The evaluation of building performance is the comparison of the actual building performance and the expected criteria of its performance [4]. The continuation of building performance analysis over its life-cycle will result in a continuous * Corresponding author. Tel.: +353 87 680 5005/21 420 5453; fax: +353 21 420 5450/21 427 6648. E-mail addresses:
[email protected],
[email protected] (A. Ahmed). 1474-0346/$ - see front matter Ó 2010 Elsevier Ltd. All rights reserved. doi:10.1016/j.aei.2010.06.007
commissioning [5–8]. Performance analysis tasks are very common for different buildings [5,9,10]. During this process emphasis is given on measurement and assessment of various performance indicators covering the interests of owners, operators, and occupants in aspects like energy, lighting, thermal comfort, and maintenance [11,1]. The performance indicators are approximately identical for most buildings and, thus, the analysis tasks are often similar [10]. For example, in the case of an apartment block owner, there is a need to monitor energy usage for different apartment tenants. This can be further distilled into categories measuring comfort indicators such as room temperature. As a consequence, comparisons can then be made between real and optimized indicators to assist building control addressing the trade-off between energy consumption and comfort [9]. Energy savings of 10–40% are possible in commercial buildings by closely monitoring and supervising energy usage and related data [5,12–14]. Furthermore, the collection and analysis of sensed and metered building performance data allows for the discovery of previously unknown building performance characteristics, relationships, dependencies, or trends [2]. Important information is hidden in a building’s historical data that can assist in understanding a building’s performance over its life-cycle [15]. Performing data collection and building performance analysis in tandem supports timely identification and implementation of actions forming a continuous commissioning process [6,7,9,16]. The continuous development of wired building automation systems and the growing interest in ‘‘easy-to-integrate” wireless solutions has resulted in building performance data being abundantly available [17,18]. However, traditional database management systems (DBMS), with
A. Ahmed et al. / Advanced Engineering Informatics 24 (2010) 466–475
emphasis on building energy performance monitoring, lack the ability to create data aggregation and do not support the analysis of building performance data to deliver reports and actionable information [19]. In addition, information requirements become complex, as it is difficult for a DSS to extract information from the data found in buildings’ databases. Therefore, data warehouse (DW) technology is introduced to manage and analyze building monitoring data in an integrated way [2]. A DW is designed to support data analysis. It contains historical data derived from transaction data. It separates the analysis workload from the transaction workload. This helps to maintain historical records and enhance the understanding of the business processes [19]. A DW environment includes an extraction, transformation, and loading component (ETL), an online analytical processing engine (OLAP), and client analysis tools. Inmon [14] described DW as ‘a subject oriented, integrated, non-volatile, and time variant collection of data in support of management’s decisions’. DW adds data aggregation capabilities directly to the databases to prepare and deliver reports [20]. DW technology has been used in business and marketing to improve various processes [21]. It supports complex queries and more sophisticated features for aggregating, analyzing, and comparing data [22]. It is also used to discover trends and patterns in data [23], prove hypothesis [14], or create virtual sensor models [24]. DW technology has also been introduced to the construction management domain to improve the management of historical data [25,26]. Publications report about the development of modules designed to help the construction manager during the construction process [27] or to support the selection of the most appropriate site for development [28]. DW technology has also been applied to support the exchange of documents amongst multiple parties in construction projects [29] and used for context-sensitive information modeling for construction personnel using mobile handheld devices [30–32]. This paper describes the results of a research project in University College Cork (UCC). This research sees the development of the aptly named energy building information model (eBIM) which integrates a building management system (BMS) with wireless sensing and metering tools. This research also focuses on standardized building product and process modeling using industry foundation classes (IFC). The objective of this paper is to demonstrate how to integrate and analyze data from different data sources in buildings. This involves maintaining buildings’ performance data, and analyzing user comfort and energy consumption, which represent two major indicators of building performance. It also involves the design of data aggregation algorithms, and the development of a DSS for the planning and maintenance of facility management processes. This paper presents a multi-dimensional data analysis concept for building performance data. A DW was designed and
467
implemented using oracle 11g version 1 database engine, which utilizes and integrates data from different data sources in a building, or from a network of buildings to generate reports, actionable information, and data aggregation (see Fig. 1). The DW concepts will be introduced in Section 2, and a multidimensional DW design for building performance data will be developed in Section 3. Section 4 will introduce a modular graphical user interface providing analysis functions to different building stakeholders. The case study in Section 5 illustrates the benefits of DW technology by comparing the performance of analyzing energy consumption indicators of building performance.
2. DW technology DWs are built upon common database systems and add support to import data from different data sources. They can structure and aggregate data, and pre-compute queries, to quickly meet different stakeholders’ requests for analyzing data. Behind DW technology stands a multi-dimensional data modeling concept. Fig. 2 shows the basic process of data processing in DWs. (1) Existing data needs to be extracted from sources, transformed [33] and loaded into the DW. Different data sources like external tables from other databases, text files or programming interfaces like web interfaces are usually supported by common DW implementations to gather the required data from a broad range of data sources [34]. All source data is cleansed (unimportant parts are removed), transformed (data is restructured as needed) and consolidated (related data from different sources is combined) in a staging area, before being loaded into the DW-core in step (2) in Fig. 2. Data is either regarded as fact data or dimensional data in DWs [2]. Fact data is the plain bulk data that should be analyzed by the DW like the energy consumption of a building or many buildings. Dimensional data on the other hand is descriptive data that allows structuring fact data [35]. The aggregation of the fact data is conceptualized in cubes by assigning which dimensional data applies to what fact data and how the fact data is aggregated. Cubes are individually designed to solve a specific business problem [36]. For example, a cube is defined to aggregate all energy consumption measurements of a day. The energy consumption readings are the fact data. The hour is the lower level of the time dimension that represents the periods for aggregating relevant measurements. This process is supported using the mapping technique in step (3). Mapping defines logical links between data, cubes and dimensions, and defines how the data is moved for analysis. Hence, the same fact data can be used in several cubes by mapping it multiple times. Finally, DW partly pre-compute in step (4) the results of these cubes to prepare output queries that are called materialized views [37] such as aggregating the energy consumption measurements for all individual
Fig. 1. Integration of various data sources in DW.
468
A. Ahmed et al. / Advanced Engineering Informatics 24 (2010) 466–475
Fig. 2. Data flow in a DW.
Fig. 3. Service oriented architecture around the DW.
time units (hours, days, etc.). Materialized views provide fast access to data, like caching, as query speed is significant in building performance applications where the data aggregations rate is high and the views are complex [38], there is no need to re-compute the view for every stakeholder request. One limitation however is the disk space and memory use as fact data and, in parallel, materialized views (aggregation) continuously increases. A solution is to design materialized views appropriately [39]. Furthermore, DWs have the benefit that they keep historical records and are historically consistent to achieve better understanding of the business processes [19]. If, for example, a tenant is replaced by a new tenant, the entry of the old tenant is not removed from the DW, neither is the information of the rooms rented. Instead snapshots of the tenants and their rooms are stored in the DW allowing requests for lists of tenants and their rooms at any recorded time period. This consistency applies to all DW data. If the building is restructured and rooms are split or combined, as is commonplace in typical office buildings, the DW also keeps track of these changes.
3. DW technology for building performance management 3.1. DW architecture DW can fulfill a central position in building performance management as they cover different aspects from data gathered from different sources, to data storage and to data aggregation. Fig. 3 illustrates this and places the DW in a central location within the tool world as it is proposed by this paper. The illustration differs between a network layer, a data layer, and a tool layer. The network layer is the nervous system of the building in which its performance data is sensed and communicated. It bases itself on different technologies from common building management systems also known as building automation systems, such as BAC-
net, LON, KNX [40,41] to novel wireless technologies like ZigBee, EnOcean, Z-Wave [42], or RFID devices [43]. The data layer is the brain and memory of the building and supports the DW. Also building information models such as building performance models using IFC [44] are classified in this level. They contain not only a geometrical model of a building, the quantities and properties of its components, but may contain relevant information for performance analysis about the design of the network layer, such as the number and placement of sensors [45]. Building information models (BIM) are commonly defined as a digital collection of a building’s data during its life-cycle. The DW can be seen as a natural part of the BIM [46]. The tool layer is the face of the system architecture and comprises of end-user tools and graphical user interfaces that build upon the data layer. Such tools range from simple monitoring tools, to dedicated diagnosis and maintenance tools [46], to intelligent control and complex data mining and decision support tools [24], as well as energy simulation tools providing targeting data of ideal building performance [9]. To support the easy, interoperable integration of the different tools a service oriented architecture (SOA) encloses the DW that provides individualized, open-readable web-service interfaces to the different modules [47]. This whole architecture as shown in Fig. 3 is currently implemented in the Irish strategic research cluster ITOBO [48]. This paper’s results are relevant to this project and focus on introducing the central DW concepts. The targeted use-case of building performance analysis is now analyzed in detail to deduce the requirements for DW modeling. 3.2. Use-case scenario for building performance data management The UML use-case diagram for the case of building performance management using the DW [48] is shown in Fig. 4. Typically three different stakeholders are involved in building performance
A. Ahmed et al. / Advanced Engineering Informatics 24 (2010) 466–475
469
Fig. 4. Use-case for building performance management using DW.
management. The interest of the building owner is to oversee the energy consumption of one or several buildings, as well as of individual tenants with the aim of controlling costs and creating bills. The building operator’s interest is to provide a steady high level of user comfort with minimal energy consumption to increase profit, might be in many buildings. Thus, he is interested in the energy consumption as well as the user comfort of the building and tenants. The tenant and occupants are primarily interested in their own user comfort at their location (room/zone) and less in the energy consumption. 3.3. DW schema for building performance data management The DW supports all stakeholders by preparing the building performance data they request in a clear and a tangible format. As detailed in Section 2, The DW distinguishes data in fact data that needs to be aggregated, dimensional data that is used to structure fact data, and cubes that define how the fact data is aggregated using the dimensional data. Specific views in these cubes with pre-computed results are called materialized views that prepare the data for stakeholder queries. This section discusses how these concepts apply to building performance data management and develops an adequate DW design. The DW is designed top-down starting with the use-case defined in the last section. The use-case introduces different stakeholders with individual interests in building performance. Building performance indicators generally may range from electricity, gas and water consumption to temperature, illumination, air velocity, and humidity providing information relevant to occupant comfort [49]. The first aspect in analyzing performance data is relating it to time like analyzing the consumption progression over 1 year. Other relevant aspects in the use-case are different scales of abstraction from the owner, who see whole facilities consisting of several buildings, down to the occupant, who are more interested in their own building space. The owner is interested in monitoring the consumption of individual tenant organization, which relates consumption data to information about who is renting what spaces in the building. This defines the basic dimensions used in the proposed DW design namely: (1) The Measurement Dimension specifies the used performance indicators. (2) The Time Dimension relates time scales. (3) The Location Dimension handles aspects of localization within buildings or rooms. (4) The Organization Dimension relates information about the tenants of buildings.
Each dimension is organized into a hierarchy composed of numerous levels, each allowing to aggregate data at desired level of abstraction. The time dimension can consist of time periods covering years, quarter years, month, weeks, and days. Hierarchies do not need to cascade and form strict patterns or trees. Each level in a dimension can have additional attributes that provide descriptive characteristics about the facts to narrow the search, filtering, and classifying of the facts data [2], such as a name of a room. These attributes also may be subject to change. These descriptive attributes and attributes describing the dimension hierarchy is called dimensional data. Generalizing, the proposed DW for performance data management is designed as a multi-dimensional model. The four dimensions of the multi-dimensional model are in detail: (1) Times_Dimension is the structure of time providing access to the building’s historical records. This structure aggregates data from the hour level, day level, week level, month level, quarter level and to the year level, in a single standard calendar year hierarchy. Fig. 5 shows the Roll Up for the time dimension.2 (2) Locations_Dimension structures the physical locations of a building. It aggregates data from the zone level to the room level, floor level, building level, site level in a single hierarchy with a geographical Roll Up. Attributes of the dimension are ID (to uniquely identify the dimension in the DW module), name (providing a textual identifier), and descriptions (additional descriptive information for the dimension). Each level in the dimension has also the attributes ID (to uniquely identify the levels and define the hierarchy), names, and descriptions. Additional attributes are defined according to stakeholders’ requirements. Possible attributes, for example, for the zone level, are the volume, dimension, and the specific location in relation to the room it is located in. Fig. 6 shows the Roll Up for the location dimension and related attributes. Additional attributes are defined for each level. The hierarchy will facilitate aggregating building performance data at any level, for example, energy consumption can be aggregated for a zone (the smallest space sensed), up to a whole site at site level. (3) Organizations_Dimension is a structure reflecting the management aspects of a facility regarding tenants and the rooms rent. It aggregates data from a single occupant to the group level, department level, and to the organization
470
A. Ahmed et al. / Advanced Engineering Informatics 24 (2010) 466–475
Fig. 5. Roll Up for the time dimension and related attributes.
Fig. 6. Roll Up for the location dimension and related attributes.
level in a single hierarchy. Attributes at the dimension level are again ID, name, and description. Possible attributes for the occupant level would be the user name, the Zone_ID of the zone the user is sitting in, and personal comfort preferences. Fig. 7 shows the Roll Up for the Organizations Dimension. (4) Measurements_Dimension is a structure for the specification of the performance indicators categories of a building down to device level such as sensors and meters. Fig. 8 shows the Roll Up for the measurements dimension. One question not discussed so-far is how the fact data like measurements are related to the dimensional data. Expressed in terms of a relational database [35], all data regarding the dimensions is stored in corresponding dimension tables, and all measures are stored in a separate table. To provide query efficiency to the DW a de-normalized multi-dimensional star schema is used to relate these tables as shown in Fig. 9. Star schema, as a data modeling technique, eases implementation of multi-dimensional data analysis while preserving the relational structure of the dimensional and fact data [2]. The basic star schema has four components: facts, dimensions, attributes, and attribute’s hierarchies. Fact data is associated with numeric measures. Dimensional data categorize the facts [50]. The DW’s star schema in Fig. 9 shows the central table with the fact data consisting of the measurements and keys to a set of smaller tables detailing the dimensional attributes and hierarchial attributes, one table for each dimension [23]. The dimensions tables are displayed in a radial pattern around the fact table.
Fig. 8. Roll Up for measurement dimension and related attributes.
Fig. 9. De-normalized multi-dimensional star schema for building performance data management.
Fig. 7. Roll Up for the organization dimension and related attributes.
A. Ahmed et al. / Advanced Engineering Informatics 24 (2010) 466–475 Table 1 Fact data table for building performance data management. Name
Description
ReadingID Loc_Dim_ID Org_Dim_ID Time_Dim_ID Meas_Dim_ID Value Timestamp RoomID MeasurementID
A unique ID to identify a reading Foreign key from the locations dimension Foreign key from the organizations dimension Foreign key from the times dimension Foreign key from the measurements dimension The value of the reading (e.g., temperature) The exact timestamp of the reading The ID of the room the measurement is taken in The ID of the measurement type
Table 1 shows the fact table resulting from the star schema. It collects all the different performance readings such as energy consumption and comfort measures extracted from a network. All the other dimensions are related via their primary keys to the facts, in the fact table [36]. Thus, the fact data can be mapped to any designated cube that is designed to solve a specific business problem. 3.4. Aggregation of bulk performance data Based on the star schema the different dimensions now can be used by any cube to define data aggregations. The name cube associates with different dimensions spanning a multi-dimensional space in which each dimension can be used to address aggregated fact data. This eases the complex analysis of multi-dimensional data [23]. For example, the owner wants to analyze the electrical energy consumption of tenants for a time period and respectively uses the measurement, organization, and time dimension. The operator on the other hand is interested in the consumption of individual rooms and utilizes the measurement, time and location dimension instead. The occupant is interested in the mean comfort development of his room and can use the measurement, time, and the location or organization dimension. Each of these queries can be modeled by individual cubes in the DW using only the required dimensions and aggregations. Related objectives like aggregating
471
energy consumption for the owner and operator can be combined also in single cubes as long as not specified dimensions can be generalized for querying, e.g., using either location or organization dimension. A general concept of DW is to add redundancy to the data schema to support the efficient processing of complex retrieval patterns [51]. Materialization (pre-computation) of cubes is one aspect of this and important to optimize DW response time of queries and save storage space. This will be further analyzed in the case study in Section 5. The next section will introduce an adequate graphical user interface for the analysis. 4. Graphical user interface for building performance management The availability of aggregated data is a very important pre-requisite for optimized building management to oversee energy consumption, control operation and maintenance costs to provide a steady high level of user comfort with minimal energy consumption. This requires also tailored graphical user interfaces (GUI) facilitating the different tasks of the stakeholders, which concepts are introduced in [52]. Fig. 10 shows a GUI concept implemented for the building owner who wants to simply analyze his building’s energy consumption. The GUI is a light-weight browser applet implemented in Java that can be accessed by simple internet browsers. This allows access to the DW for owners, operators, and tenants where access to the internet is possible. The user logins will load individualized GUI layouts relevant to the stakeholders’ data requirements. Each layout takes use of the dimension defined above and is backed by its own cube. For example, the owner uses in Fig. 10 the dimension categories to specify the accumulated results shown in the graph on the top right. The owner can select the energy consumption for a whole building, a specific zone (rooms), a tenant organization, or equipment (e.g., under-floor heating). The calendar allows selecting the time dimension from years, to month, to single days. The main
Fig. 10. Graphical user interface for building performance analysis. Individualized view for building owners.
472
A. Ahmed et al. / Advanced Engineering Informatics 24 (2010) 466–475
Table 2 Expected data volume for the ERI. Unit
Interval
Reading/day
Reading/year
No. of units
Reading/year
Wired sensors Wireless sensors RFID doorway portal Total volume
15 min 1 min Event-based
96 1440 20
35,040 525,600 7300
180 80 1
6,307,200 42,048,000 7300 48,355,200
energy consumption measures (electricity, water, gas) and their individual total costs can also be selected. The detailed energy consumption is presented in bar chart format, providing a tangible and clear overview for a particular period. This allows convenient identification of trends of excess energy consumption. Energy consumption can be quickly identified by refining the search down to the most detailed level (hour per room). Due to the pre-computed queries defined by cubes, the DW quickly responds with results as demonstrated in Section 5.
dimensional tables. As the dimensional data also describes aspects like which devices provide which measures, where the devices are located and which tenant rent/occupy the room, it is possible for the DW to complete the fact table with the correct dimensional foreign keys as shown in Table 1. The target dimensional cubes are generated by another mapping process of fact and dimensional data to finally populate the target dimensional cubes. All logical definitions and their physical implementation comply with Oracle Corporation Specifications for Oracle DW 11g version 1 (11.1) [54].
5. Case study
5.3. Monthly energy consumption example
5.1. Building
The analysis of the monthly energy consumption by the owner is used as an example of the application of DW technology for different stakeholders. The owner uses the GUI introduced in Fig. 10 and queries the DW for the aggregated ‘‘electricity” energy consumption of ‘‘last year” for the group ‘‘IRUSE” in the ‘‘ERI-building” specifying the measurement, time, location, and organization dimension, respectively. This request is send by the GUI to the web-service interface of the DW offering these parameters. In parallel, the cube, energy_measures, has already calculated the total energy readings from the meters for all levels of measurements including time, location, and organization dimensions, as materialized views. The owner’s query now specifies a single result element in these results namely the category level (electricity is a category) in the measurements_dimension, the month level in the times_dimension, the building level in the locations_dimension, and the group level in the organizations_dimension. As this specific result is already precomputed, the DW can respond quickly to the query with the relevant results. To reduce disk and memory usage, materialized views and dimensional tables are stored in a compressed format in the database. This often leads to a better scale up for read-only operations (as in the case with our read-only materialized views). Data segment compression can also speed up query execution. The fact table is not stored in a compressed format as it has numerous insert and update activities. High update activity may work against compression by causing some space to be wasted. The cost in CPU overhead has been overcome by running the materialized views over night. A tabular sample of the energy consumption materialized view for the ERI is shown in Fig. 11 below as it is in the database before being displayed in the GUI. The view shows the power aggregation per hour, per day, per week, per month, per quarter, and per year. This materialized view uses a complete refresh mechanism (re-execute the materialized view query) to automatically load the new records from the fact table on a daily basis (runs overnight). A fast refresh inserts the new rows from the fact table and necessitates the creation of a materialized view log. This log stores rows, describing changes in the fact table, and updates the materialized view. The materialized log view grows unexpectedly. This phenomenon can affect the disk space consumption. Even though a fast refresh takes less time than a complete refresh, we implemented a complete refresh due to disk space limitations concerning the University DW server. Ideally with an industrial implementation, a fast refresh would be the obvious choice where disk space is
The capabilities of building energy performance data management with DWs will be demonstrated for the Environmental Research Institute (ERI) building Cork [53]. The ERI building is a 4500 m2 ‘‘Living Laboratory” located on the campus of University College Cork, Ireland. The building is equipped with multiple types of solar panels, geothermal heat pumps and an under-floor heating system. Building performance data is provided by 180 wired sensors and meters. Additionally, a test bed for wireless sensors, meters and actuators has been installed since April 2008 in three phases. Demonstrator 0 with 10 wireless sensor nodes is operational since June 2008. Additional 70 sensors are currently being installed in the building as Demonstrator 1. Table 2 shows the expected data volume for the ERI building per year. Sensors include humidity, temperature, CO2, and lighting sensors. Meters include devices to measure electricity, mains water, cold water, gas, lighting energy consumption, boiler heat, solar heat, and under-floor heat. One laboratory doorway portal that is equipped withradio frequency identification (RFID) reader automatically logs incoming people and equipment with RFID tags to support facility management [43]. 5.2. DW architecture The data is automatically added to the DW’s staging area by the different sources using individual web-service interfaces of the DW’s service oriented architecture. The wired sensor and meter readings are imported from the BMS on a daily basis using webservices capable of inserting bulk data. The wireless sensors add their data on their own via web-service interfaces dedicated for the single readings [47]. The RFID reader uses comparable web-service interfaces to add events when a person or equipment with RFID tags detected. The dimensional data was added manually to the DW’s staging area for the ERI building demonstrator. So, all sensors, their locations in zones and rooms, the tenants, etc., are known to the DW. Currently an IFC-parser under develop that will simplify adding new dimensional data of other buildings by exporting relevant information from IFC-files [44] that can be exported by all common building design tools and that specify rooms, their sizes, etc. Additional web-service interfaces used by the introduced GUI allow occupants also to easily change their actual location. The measurements and dimensional data contained in the staging area are mapped to the DW to be loaded in the fact table and
A. Ahmed et al. / Advanced Engineering Informatics 24 (2010) 466–475
473
Fig. 11. A tabular sample of the power consumption aggregation.
Fig. 12. Sample of the fact table.
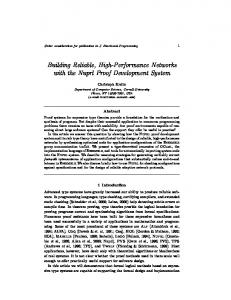
Fig. 13. Performance comparison of databases and DWs for local and remote access.
abundant, shared over many servers or part of a mainframe server architecture. 5.4. Performance comparison To illustrate the benefits of a DW with emphasis on response time performance for end-users, a GUI using a DW is compared to one that uses a DB. The comparison uses a GUI that accesses data from the example mentioned above about electrical energy consumption (i.e., the DW materialized view energy_measures) versus a GUI that uses the fact table (Fig. 12) of the DW. Hence, both the DW and the DB build upon the same data. The database currently contains about 20 million readings collected over the last 3 years from the sensors and meters in the ERI building. All readings are structured in a single table like the fact table of the DW (see Fig. 12). The reading table indexes the devices and measurement types for all readings. Querying the energy meter readings does not require searching the entire readings table. Instead the subset of about 800,000 energy readings is known by the index. When a user requests the energy consumption per month from a GUI using a DB, priority is given to the aggregation process prior to the eventual plotting exercise. The browser will first send a query to the DB to aggregate the measurements (e.g.,
per month) immediately followed by the plotting exercise. This process continues for all cases until the graph is completed. The database engine requires approximately 5 s for the completion of each query. While a GUI using a DW will respond immediately with the aggregation, as it is already pre-computed in the materialized view (Fig. 11), it is not necessary for the browser to perform a series of query and plot exercises. This has been proved by a practical experiment as explained below. The results of a practical experiment for the comparison between the response time of DW and the DB are shown in Fig. 13. Each point represents the mean value of 30 experiments. Different cases were investigated. (1) The local and remote cases investigate the differences for on-site and e-service data analysis, which is a common trend [55]. In the local case the experiments are run on the DB and DW server in Ireland, which is a high-performance, multi-core PC. In the remote case the experiments are run on a PC located in Germany and an additional delay is added by the network connection. (2) The DW, Sum, and Var cases study various implementation variants for the query. The DW cases show the times for the DW with pre-computed energy readings in materialized views. Sum stands for aggregating the energy readings within the DB using the ‘‘sum” command in the SQL-Query. Var will instead query all energy readings from the DB and aggregate them
474
A. Ahmed et al. / Advanced Engineering Informatics 24 (2010) 466–475
at the client side. This is popular in the case where the readings should be filtered by the client or if the programmer is less aware of the performance issues, as all results need to be transmitted to the client. In analyzing the results relevant to the ability of the GUI to plot relevant graphs, the DW displays greater efficiency than the DB. For a closer analysis on how the DB plots a graph, multiple queries were executed. In addition, a difference in performance exists in the time taken to perform the aggregation prior to plotting the relevant graph. The advantages of DW are due to the utilization of pre-computed criteria and the acceleration of a tangible output from data analysis. In comparison, the DB’s major limitation for not supporting pre-computational mechanisms results in slower performance and greater dependence on frequent querying, while also contributing to poor CPU performance and increased network traffic. A remarkable response of DW is 0.5 ms for the local case, and 150 ms for the remote case have been recorded which is 3% of the response time for the DB for the same tests. 6. Conclusion The multi-dimensional building data model presented in this paper is a pre-requisite for developing intelligent building management concepts. It allows combining data from different sources, such as from many buildings, in a single repository. Implementing multi-dimensional modeling using DW techniques facilitates the aggregation of information at all desired levels concerning building performance indicators. Thus, the aspects of manually browsing, filtering and analyzing historical building performance data are moved from the end-user towards the DW where these tasks are automatically performed. The introduced web-applet GUI in Section 4 illustrates the ease with which the DW dimensional concept can be mapped to graphical user interface design to create dedicated tools. The performance tests in the case study in Section 5 showed that for large data sets the DW is significantly superior to common DB implementations. Any user of the GUI attached to a DW will get an instant response even if search criteria are changed remotely. This improves not only the efficiency of analyzing building performance data, but also enables new business models for e-services. Physical disk space and memory usage are critical for DW performance. A proposed architecture is the use of a distributed warehouse for load balancing, scalability, and higher availability. The DW concept described here is used for the ITOBO project to develop a decision support system for the facility management sector. It has potential to be integrated into all buildings currently equipped with systems that log building performance data. Currently, two buildings are being integrated in the ITOBO DW, the Civil Engineering building in UCC, Ireland and HSG Conference Center in Frankfurt, Germany. A process of gathering more buildings’ specifications to populate the DW dimensions, development of a parser, supporting IFC, to automate the loading of dimensional data, and expanding current support of stake holders’ requirements is currently ongoing. Defining additional scenarios based on the DW to address the building performance aspects such as building diagnostics, and maintenance scheduling, is also in development. Acknowledgements Work in the Strategic Research Cluster ‘ITOBO’ is funded by Grant 06-SRC-I1091 from Science Foundation Ireland (SFI) with additional contributions from five industry partners. The authors like to thank Paul Stack, Nicholas E. Korres, UCC, and Haithum Elhadi, U.S. Telecom and Illinois Institute of Technology, for their con-
tribution to this research. Joern Ploennigs further wants to thank the Humboldt-Foundation and the German BMBF for their support.
References [1] D.T. O’Sullivan, M.M. Keane, D. Kelliher, R.J. Hitchcock, Improving building operation by tracking performance metrics throughout the building lifecycle (BLC), Energy and Buildings 36 (11) (2004) 1075–1090. [2] P. Rob, C. Coronely, K. Crockett, Data Bases Systems: Design, Implementation and Management, Cengage Learning EMEA, 2008. [3] H. Hagras, V. Callaghan, M. Colley, G. Clarke, A hierarchical fuzzy-genetic multi-agent architecture for intelligent buildings online learning, adaptation and control, Informatics and Computer Science 150 (1–2) (2003) 33–57. [4] F. Wolfgang, Assessing Building Performance, Butterworth–Heinemann, 2005. [5] D. Claridge, J. Haberl, M. Liu, J. Houcek, A. Athar, Can you achieve 150 percent predicted retrofit savings: is it time for recommissioning? in: ACEEE 1994 Summer Study on Energy Efficiency in Buildings, Washington, DC, USA, 1994, pp. 73–88. [6] M.A. Piette, S.K. Kinney, P. Haves, Analysis of an information monitoring and diagnostic system to improve building operations, Energy and Buildings 33 (8) (2001) 783–791. [7] F. Schmidt, Building performance monitoring – theory, implementation and results from case studies, in: Fourth Workshop in Energy Efficient Technologies for Buildings – New and Retrofits, NY, USA, 2008. [8] M. Liu, D.E. Claridge, J.S. Haberl, W.D. Turner, Improving building energy system performance by continuous commissioning, Energy Engineering 96 (5) (1999) 46–57. [9] A. Costa, M. Keane, P. Raftery, J. O’Donnell, Key factors-methodology for enhancement and support of building energy performance, in: Building Simulation, Glasgow, UK, 2009. [10] C. Neumann, D. Jacob, Guidelines for the Evaluation of Building Performance, Building EQ, Project Report, 2008. [11] G. Augenbroe, C.S. Park, Quantification methods of technical building performance, Building Research and Information 33 (2) (2005) 159–172. [12] T. Salsbury, R. Diamond, Performance validation and energy analysis of HVAC systems using simulation, Energy and Buildings 32 (1) (2000) 5–17. [13] N. Motegi, M.A. Piette, S.K. Kinney, J. Dewey, Case studies of energy information systems and related technology: operational practices, costs, and benefits, in: International Conference for Enhanced Building Operators, Berkeley, CA, USA, October 2003. [14] W.H. Inmon, Building the Data Warehouse, John Wiley & Sons, 1996. [15] W.H. Inman, The data warehouse and data mining, Communications of the ACM 39 (11) (1996). [16] Mellissa A. Hardy, A. Bryman, Handbook of Data Analysis, Sage Publications, 2004. [17] K. Menzel, D. Pesch, B. O’Flynn, M. Keane, C. O’Mathuna, Towards a wireless sensor platform for energy efficient building operation, in: 12th International Conference on Computing in Civil and Building Engineering, vol. 13, Beijing, China, 2008, pp. 381–386. [18] S. Sharples, V. Callaghan, G. Clarke, A multi-agent architecture for intelligent building sensing and control, Sensor Review 19 (2) (1999) 135–140. [19] P. Lane, Data Warehousing Guide, 119g Release 1 (11.1), Oracle Data Base, Oracle, 2007. [20] S. Chaudhuri, U. Dayal, An overview of data warehousing and OLAP technology, ACM SIGMOD Record 26 (1) (1997) 65–74. [21] V. Rainardi, Building a Data Warehouse: With Examples in SQL Server, Springer, 2007. [22] A.M. Tjoa, J. Trujillo, Data Warehousing and Knowledge Discovery, Springer, Copenhagen, 2005. [23] J. Han, M. Kamber, Data Mining: Concepts and Techniques, second ed., Morgan–Kaufmann Publishers, 2006. [24] A. Ahmed, J. Ploennigs, Y. Gao, K. Menzel, Analyse building performance data for energy-efficient building operation, in: CIB W78 – 26th International Conference on Managing IT in Construction, Istanbul, Turkey, 2009. [25] I. Ahmed, C. Nunoo, Data warehousing in the construction industry: organizing and processing data for decision making, in: Eighth International Conference on Durability of Building Material and Components, Vancouver, 1999, pp. 2395–2406. [26] J. Lee, H. Lee, Principles and strategies for applying data warehouse technology to construction industry, in: ECPPM, eWork and eBusiness in Architecture, Engineering and Construction, Slovenia, 2002, pp. 341–353. [27] K. Chau, Y. Cao, M. Anson, J. Zhang, Application of data warehouse and Decision Support System in construction management, Automation in Construction 12 (2) (2002) 213–224. [28] I. Ahmed, S. Azhar, P. Lukauskis, Development of a decision support system using data warehousing to assist builders/developers in site selection, Automation in Construction 13 (4) (2004) 525–542. [29] M. Zhiliang, K. Wong, L. Heng, Y. Jun, Utilizing exchanged documents in construction projects for decision support based on data warehousing technique, Automation in Construction 14 (3) (2005) 405–412. [30] K. Menzel, R.J. Scherer, S. Schapke, K. Eisenblätter, Potentials of data warehouse technology to support case sensitive information representation on mobile devices, in: Ninth ISPE International Conference on Concurrent Engineering, London, UK, 2002.
A. Ahmed et al. / Advanced Engineering Informatics 24 (2010) 466–475 [31] K. Menzel, M. Keller, K. Eisenblätter, Context sensitive mobile devices in architecture, engineering and construction, ITcon 9 (2004) 389–407. [32] K. Eisenblätter, K. Menzel, Implantation strategy of mobile technologies in construction, in: CIB W78 – 22nd Conference on IT in Construction, Dresden, Germany, 2005, pp. 489–497. [33] R. Sapsford, V. Jupp, Data Collection and Analysis, second ed., SAGE, 2006. [34] J. Richard, Oracle Database 10g Performance Tuning Tips & Techniques, McGraw-Hill Professional, 2007. [35] C. Adamson, The Star Schema Handbook: The Complete Reference to Dimensional Data Warehouse Design, John Wiley & Sons, 2009. [36] R. Kimball, J. Caserta, The Data Warehouse ETL Toolkit: Practical Techniques for Extracting, Cleaning, Conforming, and Delivering Data, John Wiley & Sons, 2004. [37] D. Agrawal, A. El Abbadi, A. Singh, T. Yurek, Efficient view maintenance at data warehouses, ACM SIGMOD Record 26 (2) (1997) 417–427. [38] A. Gupta, I.S. Mumick, Maintenance of Materialized Views: Problems, Techniques, and Applications, Data Engineering Bulletin 18 (2) (1995) 5–18. [39] A. Shukla, P. Deshpande, J.F. Naughton, Materialized view selection for multidimensional datasets, in: 24th International Conference on Very Large Data Bases, 1998, pp. 488–499. [40] S. Sharples, V. Callaghan, G. Clarke, A multi-agent architecture for intelligent building sensing and control, Sensor Review 19 (2) (1999) 135–140. [41] W. Kastner, G. Neugschwandtner, S. Soucek, H.M. Newman, Communication systems for building automation and control, Proceedings of the IEEE 93 (6) (2005) 1178–1203. [42] C. Reinisch, W. Kastner, G. Granzer, W. Neugschwandtner, Wireless technologies in home and building automation, in: Fifth IEEE International Conference on Industrial Informatics, vol. 1, Vienna, Austria, 2007, pp. 93–98. [43] F. Manzoor, Z.X. Cahill, B. Cong, K. Menzel, Tracking occupants and inventory items in buildings using radio frequency identification (RFID) technology, in:
[44] [45]
[46]
[47]
[48] [49] [50] [51] [52]
[53] [54] [55]
475
18th International Conference on the Applications of Computer Science and Mathematics in Architecture and Civil Engineering, Weimar, Germany, 2009. ISO/PAS 16739:2005 Industry Foundation Classes, Release 2x, Platform Specification (IFC2x Platform), 2005. A. Karavan, M. Neugebauer, K. Kabitzsch, Merging building automation network design and IFC2x construction projects, in: CIB W78 – 22nd Conference on IT in Construction, Dresden, Germany, 2005, pp. 575–581. G. Provan, J. Ploennigs, M. Boubekeur, A. Ahmed, A. Mady, Using BIM data for generating and updating diagnostic models, in: 12th International Conference on Civil, Structural and Environmental Engineering Computing, Funchal, Portugal, 2009. P. Stack, F. Manzoor, B. Cahill, K. Menzel, A service oriented architecture for building performance monitoring, in: 18th International Conference on the Applications of Computer Science and Mathematics in Architecture and Civil Engineering, Weimar, Germany, 2009. ITOBO, Information & Communication Technology for Sustainable and Optimised Building Operation, 2007. G. Augenbroe, C.-S. Park, Quantification methods of technical building performance, Building Research and Information 33 (2) (2005) 159–172. B.T. Pedersen, S. Jensen, Multi-dimensional data base technology, Distributed Systems Online 34 (12) (2001) 40–46. S. Hoberman, Data Modeling Made Simple: A Practical Guide for Business & IT Professionals, Technics Publications, 2007. Y. Stack, P. Tumwesigye, E. Menzel, K. Wang, Aspects of interface design for energy management in buildings, in: 21. Forum Bauinformatik, Karlsruhe, Germany, 2009. ERI, Environmental Research Institute, 2002. Oracle, Oracle Warehouse Builder, User’s Guide, 11g Release 1 (11.1), Oracle, 2008. A. Zarli, eWork and eBusiness in Architecture, Engineering and Construction: Ecppm 2008, CRC Press, 2008.