Multi-disciplinary System Design Optimization
for All-Electric Geostationary Communication Satellite Ryo Ujiie Japan Aerospace Exploration Agency 2-1-1 Sengen Tsukuba, Ibaraki, Japan 3058505 +81-50-3362-7835
[email protected]
Kentaro Nishi Japan Aerospace Exploration Agency 2-1-1 Sengen Tsukuba, Ibaraki, Japan 3058505 +81-50-3362-8933
[email protected]
2. MULTI-DISCIPLINARY SYSTEM DESIGN OPTIMIZATION ........................................................ 2 3. MODELLING ......................................................... 2 4. OPTIMIZATION RESULTS ..................................... 5 5. DISCUSSION .......................................................... 6 6. CONCLUSION ........................................................ 6 ACKNOWLEDGEMENTS ............................................ 7 REFERENCES ............................................................ 7 BIOGRAPHY ............................................................. 8
Abstract— Geostationary communication satellites are a large market for the space utilization domain. From the user’s perspective, the commercial communication payload mass is among the most important specification parameters. In order to maximize payload mass and customer satisfaction, the satellite bus mass should be minimized because the launch mass is constrained by launcher vehicle capability. Therefore, electric propulsion offers a practical design option for geostationary communication satellites, with significantly higher specific impulse than that of chemical propulsion. In fact, some satellite development organizations have already applied it to their satellites, and the Japan Aerospace Exploration Agency (JAXA) is also developing a new allelectric geostationary communication satellite equipped with Hall-effect thrusters.
1. INTRODUCTION
Geostationary communication satellites represent one of the largest major commercial satellite markets, and are featured in the space research and development domain. In this area, the all-electric propulsion system is becoming a dominant satellite architecture, much like the 702SP of the United States [1] and Europe’s Alphabus [2]. The Japan Space Exploration Agency (JAXA) is also developing an allelectric propulsion satellite called Engineering Test Satellite-9 [3].
One disadvantage of electric propulsion is that its thrust force is much smaller than that of chemical propulsion. Although the thrust force of a Hall-effect thruster can be relatively high compared to other electric thrusters, it is generally one-tenth to one-hundredth of the thrust force of chemical propulsion. Consequently, the transition time from injected orbit to geostationary orbit is much longer, which can be recognized as greater operational risk and higher cost. The thrust force of a Hall-effect thruster can be somewhat improved by increasing its discharge power and voltage. However, this design decision not only increases the satellite bus mass but also deteriorates the specific impulse, resulting in drastically decreased payload mass. Therefore, the balance between payload mass and transition time entails critical decision-making to achieve a satellite’s competitiveness in the market.
The concept of an all-electric propulsion satellite is that the satellite raises its orbit from geostationary transfer orbit (GTO) to geosynchronous Earth orbit (GEO) and maintains the orbit through station-keeping operation using an electric propulsion system, instead of the bipropellant propulsion system used in traditional GEO satellites. In particular, geostationary communication satellites must be supplied with a large amount of power for their communication payloads in the GEO operation phase. A major advantage of the all-electric propulsion satellite is that the huge power supply for its electric propulsion system in the orbit transition phase can also be used as a power resource for payload communication. Another advantage is the relatively high mass allocation for the payload. In bipropellant propulsion satellites, the propellant generally accounts for half of the launch mass for orbit raising and station keeping. In contrast, all-electric propulsion satellites can significantly reduce the propellant mass thanks to the high specific impulse of their electric thrusters, thus allowing the excess mass portion to be allocated as extra mass for large-scale payloads.
This study examines the trade-off between payload mass and transition time in the all-electric geostationary communication satellite based on Hall-effect thrusters from a multidisciplinary perspective, including the thruster design, injection orbit, satellite mass, and power supply design. Overall satellite system design, including the satellite’s injection orbit, is separately optimized under certain constraints as maximizing the payload mass or minimizing the transition time. Pareto frontiers are also investigated as gradually changing the weighted factors of both objectives. Finally, the non-dominant and competitive system design is discussed in comparison with the existing same type of allelectric satellite.
TABLE OF CONTENTS
1. INTRODUCTION ..................................................... 1 978-1-5386-2014-4/18/$31.00 ©2018 IEEE
1
However, even an ideal all-electric propulsion system for geostationary communication satellites has a major disadvantage—longer transfer time from GTO to GEO. For example, a bipropellant satellite can raise its orbit in a few days by several apogee kicks, whereas an electric propulsion satellite must be continuously propelled in a spiral orbit due to its relatively low thrust; consequently, the transfer time may last as long as six months. This long journey to GEO not only results in a longer stay in the Van Allen radiation belt but also delays service for satellite users.
existing competitors. Thus, this study attempts to apply the MDO/MSDO approach in an earlier phase—the SDR phase.
As discussed in Section 1, the trade-off between payload mass and transition time is very important to create a competitive all-electric geostationary communication satellite. However, at least in the ETS-9 concept design process, the trade-off space has never been qualitatively explored well, while the balance was only determined by a simple benchmark for comparing with competitors and the market trend. Unfortunately, ETS-9 has already been in the PDR phase since 2016, and thus the outcome of this study will not be reflected in the actual design. Even if this study does not have any impact on the actual ETS-9 design, it will potentially propose a new technical assessment idea for the geostationary communication satellite market. Thus, this study demonstrates MSDO of the all-electric geostationary communication satellite in reference to the ETS-9 design specification in SDR.
To overcome this disadvantage, the Hall-effect thruster offers the dominant option [4]. This thruster uses the Hall effect to accelerate a propellant such as xenon, and generate relatively higher thrust force than other conventional ion thrusters. Thus, the Hall-effect thruster is a solution to balance the advantages and disadvantages of the all-electric satellite system.
As described above, the all-electric propulsion system represented by the Hall-effect thruster is becoming a major technology for the geostationary satellite system, but no defacto standard for the system architecture has been established, as satellite users ideally desire both larger payload mass and early low-risk service. Therefore, a wellcoordinated trade-off study between both conflicting requirements is needed to achieve a design that maximizes customer satisfaction. In this trade-off, in addition to the satellite system design including the propulsion subsystem based on Hall-effect thrusters, the launch vehicle, which is not part of the satellite system, also has an impact. Therefore, it is very important to explore the trade-off from a multi-disciplinary system perspective.
3. MODELLING
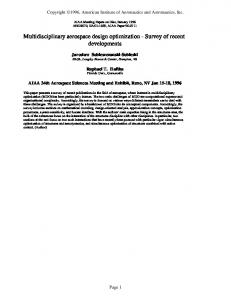
Figure 1 shows the system model implemented to conduct the MSDO study on the all-electric geostationary communication satellite. The model mainly consists of four parts: objectives, system optimizer, design variables, and design blocks.
2. MULTI-DISCIPLINARY SYSTEM DESIGN OPTIMIZATION
Multi-disciplinary Design Optimization (MDO) was originally utilized in the structural design domain, and increased computational power since then has extended the range of MDO to cover entire systems [5]. While MDO/MSDO requires engineers to make extensive efforts regarding modeling and computing, it also allows them to assess systems with a qualitative design trade-off perspective, which results in finding an optimal design.
Figure 1. Block diagram of the all-electric geostationary satellite system design optimization model
MDO/MSDO has been traditionally used in the Preliminary Design Review (PDR) and Critical Design Review (CDR) phases, as relatively detailed design information is available in such design phases [6]. As a system becomes more complex, however, design decisions made in earlier phases such as the System Design Review (SDR) phase tend to have more critical impact on the success of system development. In cases where MDO/MSDO can be applied in earlier phases and optimal design decisions are made for the target system, the fundamental value offered by the system could be maximized beyond the values proposed by
As discussed in Sections 1 and 2, the mission payload mass (M ) and the transition time to reach geostationary orbit (T ) are defined as the objectives in this study. Although two objectives are defined here, the optimizer can search the design variables that can minimize only one objective. Therefore, a simple weighted sum method is applied here and a system objective function (J ) is given as follows: J
2
= w ∙ 1⁄M
+ (1 − ) ∙ T
(1)
where w is a parameter controlling the weight between M and T . By changing this weight parameter from 0 to 1 and minimizing the objective function, various optimal designs on the Pareto frontier between M and T can be searched.
250 km, the injected orbit parameters , calculated by the following vis-viva equation:
are
(2)
2
During the orbit transition, the total power of the all-electric satellite is generally divided into two parts: power of the satellite bus ( ) and discharge power for the Hall-effect thruster ( ) as expressed in the following equation: = 0.85
−
(3)
where the coefficient of (0.85) means that 85% of full power generation is available during the orbit transition due to unstable satellite attitude and relative position between the satellite and the sun. Generally, the fundamental bus power ( ) can be assumed to be proportional to the satellite’s total mass. Therefore, by investigating other JAXA satellites, the following relationship is defined [10]:
For the design variables representing system design variation, the following three parameters were selected: total satellite mass (M ), satellite generation power (P ), and discharge voltage for the Hall-effect thruster (U ). System level optimization typically entails a large number of design variables (e.g. 10 - 20), but there are only three such variables in this study. There are two reasons for this small number: 1) the concept of the target system (i.e. all-electric geostationary satellite) is not new and the dependency among various parameters is thus already known, and 2) another optimization process works inside the system level optimization process. The dependency and internal optimization process are described in the following subsections. In short, the design vector (x ) is described as follows: =
=−
Power Module
The system optimizer is a mathematical algorithm used to search for optimal design variables. Because hybrid optimization is a general approach to reach a global optimum solution, a heuristic algorithm was initially applied, and then a gradient-based algorithm was successively executed. In this study, the simulated annealing algorithm [7] was chosen as the heuristic one due to the relatively small number of design variables, and the interior point algorithm was selected as the gradient-based one [8].
x
−
2
and
=
2 3
(4)
For the mass of the satellite bus ( ), two types of mass are defined in this study, and thus the total bus mass is described as follows: =
+
(5)
where is the mass of the electrical power subsystem (i.e. dominant bus subsystem in the all-electric propulsion satellite), and fixed parameter is the mass of other bus subsystems. According to the ETS-9’s target specification [11], is calculated from satellite power ( ) by using the following equation:
(2)
The following subsections describe the modules that compose the entire system. Each module shows how the design variables are turned into objective values through complex interactions among various system elements. In this study, the interconnected design elements are divided into five system modules: Launch Vehicle, Hall-effect Thruster, Power, Orbit Transition, Payload Mass Estimation.
=
40 1000
(6)
where the coefficient of is the electrical power subsystem mass per satellite power.
Launcher Vehicle Module
Hall-effect Thruster Module
Because the satellite is launched and carried onboard a launch vehicle, the initial orbit for orbit transition solely depends on the satellite mass and performance of the launch vehicle.
The propelling force (F) and specific impulse of the electric thruster (I ) are dominant parameters for the geostationary orbit transition. Shagayda and Gorshkov [12] introduced the scaling law of the Hall-effect thruster, which leads the force and specific impulse with given P and as follows:
In this study, an actual Japanese launch vehicle called the H3 rocket launcher vehicle [9] is assumed to be utilized, and its capability is extrapolated using the actual discrete performance table to define a function that has total satellite mass ( ) as an input argument, and the increase in the rocket’s velocity ( ) as an output return. Moreover, when assuming that the rocket expends to reach apogee altitude from a circular parking orbit at an altitude of
F= I 3
=
2 2
(7) (8)
where , , , , and are the evaluation coefficients given by Shagayda and Gorshkov, is the atomic mass unit, is the electron charge, and is the
Because the Hall-effect thruster lacks sufficiently high thrust force to be approximated as impulse thrusting, this estimation is not the correct increase in velocity for raising the actual low thrust force orbit. However, when multiplying dv by 1.5, which means = 1.5 in Eq.12, it roughly corresponds to the actual increase in velocity. Of course, the difference tends to be large when the final orbit is far from geostationary orbit. Conversely, the approximation works well at around geostationary orbit. Therefore, the approximation is utilized to finally match the final and geostationary orbits. Applying a general orbit accuracy requirement for the JAXA geostationary satellite to this estimation, the result is less than 24 hours. Moreover, the method prescribed by Kluever and Oleson is essentially used for rough estimation of the low thrusting orbit transition. Thus, in this study, the transition time calculated by the Tsiolkovsky rocket equation with the approximated increase in velocity shown in Eq. 12 at less than one day / 86,400 sec. is imposed as an inequality constraint. For the numerical integration algorithm, the integral function of MATLAB [14] is applied, and the fourth-order Runge-Kutta method is utilized in orbit propagation from the given initial orbit ( , , to , , and ) with one-day time steps (See Kluever and Oleson). For the optimization algorithm here, a hybrid approach is used, which sequentially optimizes the objective function with the heuristic method and gradient-based algorithm. Given the relatively large number of design variables, genetic algorithm [15] is applied, and Sequential Quadratic Programming is applied as a gradient-based algorithm. Upon finding the shortest final time, it turns into T (i.e. one of the system objectives), and the propellant mass consumed during this orbit transition ( ) also can be estimated by the following equation:
relative atomic mass of atoms and ions. In this study, xenon is assumed as the propellant because xenon Hall thrusters will be used in ETS-9; consequently is equal to 131 here. The
only parameter calculated based on the ETS-9 specification is as given by the following equation: = 1 − exp −
(9)
where C is a constant parameter specified by a thruster and is the ionization-reaction rate. In this study, both parameters are assumed to be constant values matching the ETS-9 specification. In other words, the value of C is calculated with Eqs. 8 and 9 by giving the ETS-9’s I , P and , and used as a constant parameter in the optimization process to maintain the design parameters within the feasible Hall-effect thruster design space. Orbit Transition Module
To minimize the transition time, the transition trajectory from a launch orbit to geostationary orbit must also be optimized. This means that another optimization loop for the orbit transition exists inside the overall system optimization loop. As the orbit is gradually raised by low-thrust Halleffect thrusters, in this study, orbit optimization follows Kluever and Oleson [13]. Although the orbit optimization introduced by Kluever and Oleson is not an accurate optimal solution, the accuracy should suffice in this early concept design phase. The problem of orbit optimization can be defined by the following equations: J
=t
g
=
x
(10)
=
1 − 1 exp
dv
M
(11)
(10)
Payload Mass Estimation Module
− 86400 (12)
Payload mass (
=
where J is the objective, x is the design vector, and g denotes the inequality constraints. The final time (t ) and weighting functions and for respective extremal steering law are defined by Kluever and Oleson. In this study, the chronological variation of and between 0 and t are given by a simple linear interpolation. The orbit transition time from 0 to t is divided into 20 spans, and and are given at each time point. Then a specific value of and at an arbitrary time is interpolated from those 21 representative values. As a result, there is a total of 43 design variables here.
The inequality constraints depend on our empirical data. In Eq. 12, dv represents the increase in velocity needed to transit from the final orbit ( , and ) to geostationary orbit, where = 42216 [km], = 0 , and =0 [degrees] based on the optimal Hohmann orbit transfer.
=
) is calculated by the following equation:
−
−
(15)
where denotes propellant mass not only for the transition phase but also for the station-keeping phase, and is calculated by the following equation: =
+
1−1
∆
_
(16)
where the mission operation time ( ) calculated by the difference between total design life ( ) (a fixed parameter) and .∆ (delta V for station keeping per year) is also a fixed parameter.
4
4. OPTIMIZATION RESULTS
Table 1. Comparison between actual specification and simulated ETS-9 system performance
This section presents the results of optimization based on the model described in Section 3. The model is implemented by MATLAB 9.2 and repeatedly executed on an Intel Core E5-2687W CPU at 3.10 GHz.
Dependent Variables M
First of all, the model was validated by checking the compatibility between the actual ETS-9 design specification and the model output simulated with design variables equivalent to those of ETS-9. Before running the optimization, the range of each design variable was restricted, as an infeasible range simply wastes computational time. And because an excessively restricted design range inhibits sufficiently wide design space exploration, the ranges must be well-balanced to reach an optimal design within a reasonable computational time. Finally, the optimization process run and the Pareto Frontiers between payload mass and transition time were described as the result.
M
Objectives T
ETS-9 spec
1573 [s]
6.0 [kW]
100 %
100 %
100%
ETS-9 sim
1555 [s]
5.67 [kW]
99.8 %
96%
98%
Design Variable Range
While a wide range of design variables leads to a global optimum solution, it also entails a huge amount of computational efforts. Thus, the range should be wellbalanced between global optimality and computational feasibility.
Simulation
Assuming the H-3 rocket and parking orbit discussed in Section 3, the upper limit will be based on the capacity of the rocket launcher vehicle. The lower limit should be constrained by the escape velocity from Earth, because the second stage is only used for making the apogee altitude high. Obviously, an excessively light satellite body can be accelerated to exceed the escape velocity, which makes no sense at all in reaching geostationary orbit.
The ETS-9 actual design is a reasonable baseline in this study, and the model can be considered reliable if it reproduces the baseline performance to some extent, given design variables equaling the actual ETS-9 design. From the ETS-9 target design specification [10], the reference parameters can be defined as follows: = 5000
The upper and lower limits for power are set in reference to the ETS-9 specification. Because these limits cannot be theoretically restricted, the upper limit is double and the lower limit is half the ETS-9 design value ( ).
= 25000
= 1573
Finally, the range of discharge voltage is defined based on the hall thruster model of Shagayda and Gorshkov. In the model, the range is 300 to 1000 V; therefore, the same range must be applied in this study.
= 6000 By inputting this vector to the model, the simulated ETS-9 performance was calculated with the results shown in Table 1. In addition to the two objectives, three dependent variables, ( , and M ) are also selected from each module except the rocket module. This is because in the actual ETS-9 case, the second-stage rocket is assumed to fire twice after injection into parking orbit, and decreases the inclination angle by a third firing. To simplify the model in this study, such a third jettison is not modeled, and thus the rocket model is eliminated from the table. Due to confidentiality, several parameters cannot be open here, but the ratio between the specification and simulation is shown. As shown in Table 1, each difference is less than ±10% beyond the difference of the rocket model, which means the model cannot precisely represent the actual performance, but can still return a compatible result to some extent. In this study, the result is assumed to be fed back into the concept design in the SDR phase. Therefore, the differences will be acceptable as estimation error in such early stage engineering efforts.
Optimization
Table 2 shows the optimization results. Due to confidentiality, the mission payload mass and transition time are represented as the ratio against the ETS-9 target specification. Moreover, the specific value of the upper limit of total mass also cannot be open due to confidentiality regarding the H-3 rocket specification, and the value is replaced by M . In this study, a larger payload mass and shorter transition time are the better improvements. Obviously, when w = 0.5, the optimized design indicates the possibility of carrying a 13% larger payload mass during a 14% shorter transition time as compared to the ETS-9 specification.
5
Table 2. Optimization Results Design Variables
weight
P
U
M
Objectives T
w=0
4.59 [ton]
49.9 [kW]
301 [V]
25%
59%
w=0.25
6.10 [ton]
45.9 [kW]
321 [V]
96%
72%
41.3 [kW]
300 [V]
113%
86%
31.6 [kW]
300 [V]
127%
113%
13.9 [kW]
302 [V]
198%
676%
w=0.5 w=0.75 w=1
M M M
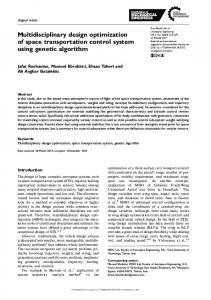
Obviously, ETS-9 appears to be a well-balanced all-electric geostationary satellite in terms of mission payload and transition time. However, neither the specification nor the simulation is in the possible Pareto frontier described with the black dashed line in Fig. 2, although both are really close to the line. This generally means that ETS-9 can be improved more in terms of both mission payload and transition time, thereby resulting in a more competitive allelectric geostationary communication satellite design. At the very least, a more powerful power supply subsystem will be a key technology in proposing a more appealing new design to payload customers.
The feasibility of the design should also be reconsidered, however, before adopting a more competitive design even if well-considered in modeling based on empirical data. As shown in Table 2, the power is almost 6 to 25 kW higher than the ETS-9 baseline of 25 kW in most optimal designs. Despite the satellite bus increment effect caused by the power increase in Eq. 6, the increased volume of the solar power panel is not modeled, which means the increased solar panel volume might result in an infeasible design from the perspective of rocket fairing storability or structural strength. Therefore, in order to finalize this discussion, such a three-dimensional structure evaluation should be also implemented for a new module and integrated in the optimization process.
5. DISCUSSION
Although there are only five optimal points, the potential Pareto frontiers can be described by the results shown in Table 2. The five Pareto frontiers are indicated with blackedged yellow circles; the actual ETS-9 specification and simulation values shown in Table 1 are indicated with small grey and orange circles in Fig. 2 (similar to the LEO personal communication satellite study by de Weck and Chang) [16]. Each value is normalized by the optimal objective value with w = 1.
The range and choice of design variables might also be modified. As shown in Table 2, the total mass reached the upper limit in more than half of the Pareto frontiers, which means that design space exploration was constrained by the limit. To eliminate the constraint, there are two possible ways: 1) setting a higher upper limit, and 2) modifying the other design variable ranges. The first option is straightforward, but may be infeasible as the upper limit is determined by the rocket’s capability. In this case, changing the rocket launcher vehicle as well as redesigning the parking orbit should be considered. For the second option, the power limits that are roughly defined in reference to the ETS-9 specification should be updated. Note that defining more theoretical or empirical power lower and upper limits may also change selection of the total mass value. The fact that the discharge voltage was always around 300 V also cannot be ignored, and may mean that the voltage is an insensitive parameter and therefore inappropriate as a design variable. Theoretically, the discharge voltage can be switched by the specific impulse in the design vector based on Eq. 8. However, this switching requires solving a complex high order equation. Indeed, such an equation will be solved by a few MATLAB mathematical libraries even if complex. This design variable replacement will also be an important modification to explore a new Pareto front. When updating the design vector, sensitivity analysis should be conducted to qualitatively evaluate new design variables from the fixed parameters
Figure 2. Pareto Frontiers of the optimization results 6
6. CONCLUSION
REFERENCES
The multi-disciplinary design optimization approach was applied to a trade-off study of the all-electric geostationary communication satellite, and a few more competitive design candidates were proposed from the results. The models used to enable optimization are based on both theoretical study and empirical data on the ETS-9 specification and other satellites. Because the models return well-comparable results with the ETS-9 specification when inputting the same parameters, the validity of models are verified to some extent. However, an additional model (i.e. structure evaluation model) will be needed to make the optimization results more convincing. Moreover, by updating the design variables and their ranges, a new Pareto frontier might be explored to possibly find a more competitive design.
[1] Feuerborn, S. A., Neary, D. A. and Perkins, J. M., Finding a way: Boeing’s “All Electric Propulsion Satellite,” 49th AIAA/ ASME/SAE/ASEE Joint Propulsion Conference, San Jose, CA, AIAA2013-4126, 2013. [2] Michel, R. and Philippe, B., Alphabus, the European platform for large communications satellites, 25th AIAA International Communications Satellite Systems Conference, AIAA2007-3121, 2007.
[3] Kentaro, N., Satoru, O., Tsutomu, F. et al., Conceptual Design of Japan’s Engineering Test Satellite-9, 35th AIAA International Communications Satellite Systems Conference, AIAA2017-5427, 2017. [4] Kim, V., Main Physical Features and Processes Determining the Performance of Stationary Plasma Thrusters, Journal of Propulsion and Power, Vol. 14, No. 5, 1998, pp. 736–743. doi:10.2514/2.5335
ACKNOWLEDGEMENTS
The authors wish to thank Shinatora Choh for supervising the Hall-effect thruster modeling, and Oliver L. de Weck and Sydney Do for giving lectures about MSDO at MIT.
[5] Agte, J., de Weck, O., Sobieszczanski-Sobieski, J., Arendsen, P., Morris A. and Spieck, M., MDO: assessment and direction for advancement — an opinion of one international group, Structural and Multidisciplinary Optimization, 40:17–33, 2010. [6] NASA Space Flight Program and Project Management Requirement, National Aeronautics and Space Administration, NPR 7120.5D.
[7] Kirkpatrick, S., Gelatt, C.D. and Vecchi, M.P., Optimization by Simulated Annealing, Science, Vol. 220, No. 4598, 13 May 1983, pp. 671-680.
[8] MathWorks documentation: fmincon Interior Point-Point Algorithm with Analytical Hessian. https://jp.mathworks.com/help/optim/ug/fmincon-interiorpoint-algorithm-with-analytic-hessian.html?lang=en [9] Space Transportation System: H-3 Launch Vehicle. http://global.jaxa.jp/projects/rockets/h3/
[10] Hiroyuki Toyota, Energy for Satellite and Planetary Probe: Power Technology in Space, 6th symposium of Kyoto University Unit of Synergetic Studies for Space. https://www.usss.kyoto-u.ac.jp/etc/symp6/toyota.pdf
[10] Engineering Test Satellite - IX: Result of Project Approval Review. http://www.mext.go.jp/b_menu/shingi/gijyutu/gijyutu2/05 9/shiryo/__icsFiles/afieldfile/2017/05/22/1385842_3.pdf
[11] Andrey A. Shagayda and Oleg A. Gorshkov, HallThruster Scaling Law, Journal of Propulsion and Power, Vol. 29, No. 2, March–April 2013.
7
BIOGRAPHY
[12] Craig A. Kluever and Steven R. Oleson, Direct Approach for Computing Near-Optimal Low-Thrust Earth-Orbit Transfers, Journal of Spacecraft and Rockets, Vol. 35, No. 4, July–August 1998.
Ryo Ujiie received B.S. and M.S. degrees in geophysics from Tohoku University in 2007 and 2009, and a M.S. degree from Massachusetts Institute of Technology in engineering and management in 2016. He has worked at JAXA since 2009. He began his professional career as a software engineer, and has been involved in software independent verification and validation of many actual flight projects. He was also engaged in software engineering, GNC simulation, and system safety design research projects until 2015. After graduating from MIT in 2016, he has launched a few MSDO study projects at JAXA. In 2017, he became a member of the HTV-X project team.
[13] MathWorks documentation: Numerical Integration, https://jp.mathworks.com/help/matlab/ref/integral.html?la ng=en [13] Holland J., Adaptation in Natural and Artificial Systems, University of Michigan Press, 1975.
[14] de Weck, O. L. and Chang, D., Architecture Trade Methodology for LEO Personal Communication Systems, 20th Intl. Comm. Satellite Systems Conference, AIAA 2002-1866, 2002.
Kentaro Nishi received B.S. and M.S. degrees in aerospace engineering from Tokyo Metropolitan University in 2012 and 2014. He began working at JAXA in 2015. He began his career as a spacecraft systems engineer. He has also been engaged in several conceptual design studies of JAXA’s recent spacecraft systems, including Engineering Test Satellite-9. He joined a MSDO study project at JAXA in 2017.
8
9