Multi-Faceted Visualisation of Worklists Ross Brown1 and Hye-young Paik2 1
Faculty of Information Technology, Queensland University of Technology, Brisbane, Australia 2 School of Computer Science and Engineering, University of New South Wales, Sydney, Australia
[email protected],
[email protected]
Abstract. Although business process management has been a major area of ICT research, no coherent approach has been developed to address the problem of business process visualisation to aid workers in the process of task prioritisation. In this paper we describe the development of a new, coherent approach to worklist visualisation, via analysis and development of a resource-centric view of the worklist information. We use instances of generic resource types as workflow elements that may be considered by workers when interacting with worklists. We then propose a generic 2D framework for visualising the resources, creating an effective mapping between a task and the capabilities of the resources. This aims to aid the process of task selection and prioritisation by workers. A worklist visualisation system has been implemented as an extension to an opensource workflow system, YAWL (Yet Another Workflow Language).
1
Introduction
Visualisation techniques offer powerful tools for understanding data and processes within complex systems. However, visualisation in the area of Business Process Management (BPM), and in particular workflow management systems, lags behind the state of the art in other areas such as medicine, engineering and mining [?]. Workflow Management Systems (WfMS) play a vital role in BPM in that the business process models are implemented and executed through a WfMS, which routes and dispatches the tasks defined in a model to the individual workers1 . The result of routing tasks is presented to the workers as a worklist. A worklist can be understood as a to-do list of tasks that the workers need to carry out in order to complete the process defined by the model. The success of business process models depends on communicating them to the model consumers effectively. However, modern workflow systems have largely overlooked the needs of the workers in understanding their given tasks in a manner that would help manage them efficiently. For example, it is quite common that workers would have questions such as “how urgent is this task?”, 1
The workers are the consumers of the model who will carry out the tasks. In this paper, we use the terms workers and model consumers interchangeably.
“who else can do the task?”, “where do you have to go to carry out the task?” (eg., where is this meeting room B809), “do I have enough resources?” (eg., are there enough chairs for 20 people in the meeting room B809), etc. A typical representation of a worklist includes a list of tasks with short textual descriptions, and/or attachments (eg., email, document forms, etc). It, however, does not include any support (context) information about the tasks that may assist the worker in planning the tasks. At any point in time, a given worker may be involved in many workflows and may thus be presented with a large to-do list. The worker needs to have available tools to help them decide which would be the best task to undertake next. We believe that visualisation techniques can be applied to many areas of BPM due to their previous use in application domains that support decision making processes. In decision support systems, information is typically provided to enable the user to be adequately informed as to the direction to be taken for a particular scenario. This applies to all levels of business systems, and to BPM as a whole. For the purpose of this paper, we limit the scope of the work to the area of workflow management, in particular, managing worklists. We apply a visualisation technique to provide workers with information about the context of a task, in order to improve their understanding of the process models and the communication of such models between the model designers and the consumers. The visual information is designed to help workers make decisions in managing worklists (eg., accepting, postponing, delegating, or rejecting tasks). In this paper, we present a generic visualisation framework that is used to provide support (context) information about the tasks in a worklist. Our contributions are three fold: – An analysis of the decision making process in managing workflow tasks, especially in relation to the resources available to the worker; – A novel and generic visualisation technique for worklists; – The implementation of the framework as a proof of concept. The rest of the paper is organised as follows. Section ?? investigates the state of the art in worklist visualisation. Section ?? describes the general approach to using these visualisations in workflow systems. Section ?? details the development of a resource centric approach to the management of worklists. Sections ?? and ?? explain the mapping of important worklist resources to appropriate visualisation techniques to aid the process of task selection by workers. Section ?? details the implementation of a visualisation system incorporated into a workflow system. The paper then concludes with a discussion of future work in Section ??.
2
Related Work
Computerised data visualisation is a broad field that has its beginning in pictorial representations used in pre computer technology times [?]. Today it has developed to the point of being one of the main areas of application for computer graphics, and is a powerful tool for the analysis and presentation of data.
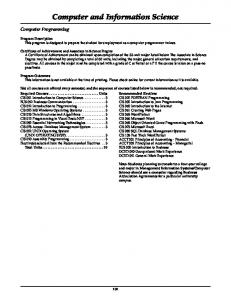
Many areas in science and mathematics have benefited from the exploitation of modern computing power in data exploration [?]. Business experts are now using advanced computerised visualisations to analyse multi-dimensional business data and processes. The main purpose of the technique is to allow the users to observe trends or patterns by exploring structured and domain-specific information. (e.g., Figure ?? shows an example of a software solution for business data visualisation).
Fig. 1. Spotfire by Tibco: Visualisation of Process Data for Analysis
The focus of our discussion in this paper, though, is in the area of visualising business processes and individual tasks generated by them. Hence, we discuss the related work in the context of business process visualisation and worklist/tasks visualisation. 2.1
Business Process Visualisation
The present state of play for the visualisation of business processes uses various graphical notations to abstract internal (complete) processes into public (basic) processes in order to hide the complexity and implementation details in the process specifications[?,?,?]. For instance, research has been performed into developing approaches to viewing complex business process via aggregating related activities[?]. [?] applies similar principles to a YAWL (Yet Another Workflow Language) business
process models, in order to efficiently remove and add components, while maintaining the validity of the YAWL model representation during zoom operations. Some have explored the use of 3D extensions to 2D representations using such techniques as Cone Trees [?,?], to full virtual reality implementations for distributed interaction with process models [?]. To provide more interactive way of analysing business processes, the idea of graphically querying business processes is proposed in [?,?]. For example, Figure ?? shows a user querying ’Does this business process requires login before searching’. In [?], an exploratory (or browsing) approach, rather than directly querying, is used to visualise automated and repetitive scientific workflow specifications. Currently, such querying is only made possible for static processes (i.e., specifications) and does not apply to ’running’ instances of the processes.
Fig. 2. Visually Querying a Business Process
2.2
Worklist/Tasks Visualisation
The visualisation techniques mentioned above can help the user better understand the business process specification. However, they cannot assist him/her with effectively managing the tasks allocated to them by the processes, as visualisation does not provide take the concept of individual ’activities’ or ’tasks’ and any background information about them into consideration (e.g., how important is this task?, how is this related to my previous task?). Figure ?? shows a typical worklist view of modern business process management systems. From the user’s view point, tasks generated by a running business process are only represented as a list of brief textual descriptions.
Fig. 3. JBPM by JBoss: A Worklist
Most project management software will support creation, allocation and tracking of task completion in a business organisation environment. However, the process of generating and allocating tasks is highly ad-hoc and manual and visualisation techniques used are rather crude. More creative approaches to organising tasks can be found in a PC desktop environment. Many desktop calendar applications will let the users create events or tasks which are visualised in a two dimensional space (time and dates). iChronos (Figure ??) attempts to provide an integration between multiple PC desktop applications (calendar, address book, file folders, etc.). The idea of providing an integrated environment for managing tasks and task related data is presented in the newly emerging research area called “Personal Information Management (PIM)”[?].
Fig. 4. iChronos
However, the approaches in PIM are heavily focused on capturing and modelling information stored in a person’s computer. The applications have not yet
incorporated the business process concepts such as “process definition”, “process execution” “tasks” or “tasks allocation”, etc. into account. As demonstrated by the research prototypes such as Haystack[?] and iDM[?], a PIM system aims to provide a conceptual framework in which the relationship between personal “information” is defined according to how the user perceived and retrieved in a way that is meaningful to the user. Although our project can benefit from the lessons learned in the PIM area, we believe that there is much work to be done in appropriate visualisation of tasks and business processes that produce the tasks. While there has been evidence of research into user requirements for business process modelling [?,?], much work still remains with regards to the following: – Data gathering for requirements analysis, the current research is often tied to software implementations which restrict creative solutions; – No real evidence of systematic analysis of sophisticated 2D and 3D visualisation techniques for use in complex business process models; – Abstract and leading edge representational techniques, such as Self Organising Maps and Parallel Coordinates amongst others, are often ignored despite their power in representing multi-dimensional data that occurs in business systems; – Application domain information is not factored into the representations; – No assessment of visualisation effectiveness via real case studies. What is needed is a thorough data gathering-based analysis of user requirements for the visualisation of business processes, and the analysis of 2D/3D techniques and visualisation wisdom for such representations. In particular, the area of concurrent process visualisation [?] is expected to provide many useful visualisation techniques. Furthermore, there is a need to provide an approach to visualisation of business processes that accounts for domain specific factors in their representations. Such a visualisation approach needs to allow for both the designers and the users of the business process model, as both these people have different requirements for visualisations, with regards to design, analysis, and usage tasks [?]. What these other workflow visualisation techniques lack is a focus on supporting information to assist the worker in managing the tasks in a worklist. Each of the techniques provides a presentation of the worklist that is rudimentary in nature, lacking any support information for the main task required by a workflow system; deciding to accept, delegate or suspend a presented task. We believe this should be the main reason for such workflow visualisations, and that an analysis of this choice process and derivation of appropriate visualisation techniques is required to support this process. Analysis of such requirements is best taken from a resource oriented point of view [?], as the available resources influence the acceptance, delegation, reprioritisation or rejection of the task2 in a worklist. We now proceed to analyse 2
By rejection of tasks, we mean choosing not to accept the task. Such tasks can be delegated, suspended, or re-allocated by the workflow system.
this worklist management problem from a resource perspective, in order to derive appropriate worklist visualisations.
3
Worklist Management
Before we introduce the concept of resources and their visualisations in worklists, we first discuss a theoretical background for generating a worklist from a workflow. That is, how tasks are generated for the worker. 3.1
Worklist Generation
Russell [?] offers a meta model of a resource. A resource can be human or nonhuman, although in the paper the discussion is focused on human resources. In the meta model, a human resource has a set of capabilities (eg., a manager can approve orders) and may occupy one or more positions. This means that s/he can perform multiple roles in an organisation, or even in a particular workflow. A human resource also can delegate activities to other resources (either human or non-human). Also, it is reasonable to assume that a resource can be substituted by another resource with similar capacity or characteristics. In the following, we explain how tasks are allocated to human resources, which will create a worklist for the worker. For the sake of clarity, we use the term worker to mean a human resource. The way in which worklists are generated is related to how a worker becomes bound to a specific work item (task) for execution. A worklist for worker A can be understood as a list of tasks bound to worker A by the workflow system. For a better understanding of worklist generation, we look at Fig. ?? which explains the life cycle of a task, from the time of creation to its final state. A final state could be either completion or failure. Each box is the state of the task in a running workflow case. The prefix S and R refer to actions enacted by the Workflow System and the Resource (worker) respectively. Once created, a task can be offered to a single worker, directly allocated to a single worker, or offered to multiple workers. Being “offered” means that the worker may have a choice in his/her worklist, in that the task can be accepted or rejected. The “allocated” tasks are normally expected to receive firm commitment from the worker. After this offering and allocation process, tasks will appear in workers’ worklists and each worker may start the task. Again, once the task is started, it is reasonable to assume that the task may (i) be completed, (ii) suspended (eg., the worker may have to wait for some events to occur or acquire extra resources), (iii) fail. In the following, we look into some of the patterns in this life cycle [?] which, in turn, will help us understand the patterns in worklist generation. 3.2
Patterns for worklist generation
Push Patterns : The name comes from the fact that the system will “push” a task to a worker. As explained in the life cycle, pushing can be either by
Fig. 5. Illustration of task life cycle; modified from [?]
allocation or offering (refer to Transitions S:offer s, S:offer m, S allocate s and S allocate m in Fig. ??). Also, a task can be offered to a worker or multiple workers. Note that when a task is pushed to more than one worker, the system is looking for a volunteer to accept the task. Visualisation and worklist interactions: It should be clear to the worker (eg., using colour coding) whether a task is allocated, or offered, as it implies a different level of responsibility from the worker. Also, when a task is offered to multiple workers, the worklist should be able to present such tasks as a form of advertisement (eg., a popup window, rolling text, etc.) so that the offer can be noticed by workers immediately. The allocation process often targets the worklists with the smallest number of tasks (ie., shortest queue). Again, a predefined colour-coding of worklists might be used to warn the owner of such candidate worklists of possible future allocation of tasks.
Pull Patterns : This pattern considers the issue of allocation and offering from the worker’s point of view (refer to Transitions R:allocate s, R allocate m, R start s, R start m in Fig. ??. When a worker is “pulling” a task, s/he may intend to start the task immediately. However, it is possible that s/he may only intend to signal the intention to execute the task at some point, but not immediately. In the second case, the task is pulled by the worker and allocated to (ie., bound to) the specific worker. It will not be allocated to another resource. Visualisation and worklist interactions: The worklist should provide the worker with a way of clearly marking/tagging tasks that s/he intend to do, but not immediately. These tasks will remain allocated in the worklist and cannot be offered to others. Hence, it will also be useful to indicate deadlines for each “pulled-forlater” tasks.
Detour Patterns : In real world scenarios, work allocations may have to be reconsidered due to interruptions by the workflow system, or to the changing states of the workers. Detour patterns describe nine such cases; the following is a direct quote from [?], describing each case: – Delegation - where a worker allocates a work item previously allocated to it, to another worker; – Escalation - where the workflow system attempts to progress a work item that has stalled by offering or allocating it to another worker; – De-allocation - where the system makes a previously allocated or started work item available for offer and subsequent allocation; – Reallocation - where a worker allocates a work item that it has started to another; – Resource suspension/resumption - where a worker temporarily suspends execution of a work item or recommences execution of a previously suspended work item; – Skipping - where a worker elects to skip the execution of a work item allocated to it – Redo - where a worker repeats execution of a work item completed earlier; – Pre-do - where a worker executes a work item that is ahead of the current execution point of a workflow case. Visualisation and worklist interactions: It is quite obvious from the above that understanding and implementing detour patterns is crucial to providing a worklist with flexibility. For example, before going on leave, a worker must be able to re-allocate his/her tasks to other resources so that the workflow can continue. Appropriate visualisation techniques can assist workers to plan and organise detour activities. For example, a task has been stalled for a certain period of time, the visualisation can highlight such tasks for the worker. Once such a task is brought to the attention of the worker, s/he may choose to escalate it or complete it herself/himself. Another useful technique will be to highlight, for example, tasks that can wait or those that have to be re-allocated for a given period of time. This will help a potential holiday leaver to plan whether to re-allocate tasks or simply to suspend them for a while. 3.3
A generic approach to managing a worklist
Based on what we discussed so far, we introduce a generalised algorithm that workers may use to manage their tasks. Inherent in the work allocation process by the workflow system is the choice by the system of whom to give the task, via the offer actions. This paper concentrates on the visual interface to evaluating resource capabilities with regards to work tasks to be performed. Automatic resource allocation is assumed to be performed behind the scenes mainly in push-based workflow systems, where the worklist items are delivered in a final state to the worker [?]. However, the worker may need to allow for local knowledge of resources in order
to make a decision about worklist items to choose, as the centralised resource allocation system may be unaware of resource issues at the worksite in question. For this paper, the assumption in the scenario is that the worker is able to then select the work from the system, based upon their assessment of the resources available using the visual presentation. As the focus here is the visual presentation of resources allocated to work, the examination of the automatic allocation of resources is beyond the scope of the paper. As mentioned before, the workflow system will have a resource view that evaluates the capabilities of the intended recipient of the task. The worker upon receiving the task, must make a decision about accepting or not accepting the task. This process is out of the control of the workflow system, as it only can push tasks to the worker to request acceptance. The workers’ responses have thus been characterised by detour processes. A worker may delegate, de-allocate (reject, in other words), re-allocate and suspend/resume. The question for the worker is the choice of adding or rejecting (ie., detouring) a task from his/her worklist and such a choice could be based on push or pull pattern approaches. Assuming a more pull oriented model of worklist task selection, providing resource information relevant to a worklist will aid the worker in this worklist management task, as they are able to decide which item to choose based upon critical resource issues. The workflow system may offer a number or only one instance of the task to the worker, and at this point the worker may decide to perform the task by checking them out and adding them to a list of active tasks, or the user may decide to return the task to the unallocated pool via the detour process. Furthermore, the worker upon completion of the task checks the task in, thus removing it from the active checked out worklist. This task acceptance process may be represented by the following formula for the acceptance process, them being the check out processes respectively: Wr = Wr ∪ {I} ⇐⇒ CWr ,T ≥ C{I},T
(1)
where: – – – –
Wr is the set of worklist items for worker(s) r; I is the new worklist item to be added; Cx,y is the capability for the task(s) x of type y; T is the type of resource being processed (eg. Computer Equipment).
So, at any stage a worker will make a decision about whether to add a worklist item to their set of worklist items, by looking at the capabilities of the worker for the present worklist as compared to the requirements of the new task. This can be automated, but in order to promote healthy workforce relations, the worker must be allowed to make such decisions as well. It must also be recognised that people will simply decide not to do a task, if they do not want to or decide to prioritise using undefined criteria. Furthermore, these visualisations may give information to the worker regarding the reasoning behind the choice of been allocated the task, and so the worker is left in an informed state about the reasons for work allocation.
4
Resource perspective in Workflow
In this section, we discuss a resource perspective on workflow. [?] argues that an effective workflow model would consider all of the following perspectives: – Functional perspective: the activities being performed – Behavioural perspective: when, how and in what order activities are begin performed – Organisational perspective: the organisational context in which the activities are being performed (ie., where and by whom in the organisation). – Information perspective: the information and data associated with the activities. In general, a resource is referred to as the entity that actually performs an activity/task. Such entity can be a human or non-human (eg., a computer program). In our paper, we take a broader view of the term and we consider resources to be the workers as well as any work environment element or context that may be required/considered when workers make decisions in managing their tasks. Therefore, in the context of our work, introducing a resource perspective into workflow is an attempt to create an integrated view of organisational perspective which deals with human resources, and information perspective which deals with non-human, work environment element or context that may be relevant to the tasks. It is important for a workflow system to be aware of the characteristics of each resource (eg., availability, utilisation, cost, etc.) so that it can make smart decisions when allocating tasks. Also, it can be argued that it is necessary to highlight resource related information to the workers so that they can make smart decisions when managing their worklists. Most commercial workflow systems are quite mature in their support for other perspectives (in the form of control-flow and data-flow), but hold a very simplistic view of the resource perspective [?]. Presently, the only definitive representation of resources and their relationship to workflow has been for human resources [?]. Non-human resources, while being noted in their importance, have not been extensively modelled in workflow systems. Russell [?] simply describes non-human resources as a tuple; (ResourceType, Description, Capability). An enterprise resource ontology has been developed which seeks to generically model the resources in an organisation [?]. It was developed from a manufacturing viewpoint, but easily transfers to aspects of workflow management, as the resources are generically defined to allow application to other domains. However, the resources to be considered by the workers for managing worklists may differ depending on the nature of the tasks, the skill level of the workers, or the kind of roles the workers play in an organisation. Indeed, we believe that a thorough study into the requirements of the workers in making decisions as well as a survey of effective visualisation techniques have not been explored. This is an important part of our current on-going investigations, in which we look at identifying various types of resources that a worklist can provide to help the workers carry out the tasks.
In the following, we discuss a few generic resource types that we identified as relevant to our project goal. The list is by no means complete, but we believe it is generic enough that their visualisations could be implemented in many workflow systems.
4.1
Generic Resource Types
We tabulate in Table ?? a list of general resources, with illustrative examples. Most resources we described in Table ?? can be represented in the generic nonhuman resource model described in [?], or the enterprise resource model proposed in [?]. For example, equipment, services, location or materials can have their name, description and capability (eg., print speed for printer) recorded against them in the workflow database, which can be queried. Some resources can be derived from information available within the workflow system. For example, data about people come from staff/organisational information in the workflow administration data. A active worklist can be obtained from querying the workflow engine to list unfinished tasks. Also, deadlines (an instance of time) are available from the workflow engine as they can be assigned to each task when a workflow process is instantiated. For these resources to be effectively visualised for a worklist, an association between a resource (eg., locations of meeting rooms) and a task (eg., Staff meeting at Room K17 401) needs to be made. In our implementation, this link is manually created by the workflow process designer through the Worklist Visualisation Editor (see Fig. ??). Currently, we do not store resource data in the workflow system for visualisation purposes. Instead, the designer would provide external resources (eg., an image of a floor plan, an XML data file of people or GPS coordinates, etc.) which will then be imported into the visual worklist handler to create mappings between the tasks and the resource.
4.2
Generic Resource Queries
The visualisations in the worklist can be seen as results of queries of the resources associated with the tasks being examined, and thus being presented to the worker in a visual manner. This is a complex requirement, that can be structured as a series of competency queries on the resources within an enterprise3 . These queries form part of an enterprise resource ontology proposed by Fadel [?]. 3
For the sake of congruence with other workflow resource research we replace the word competency with capability to mean the ability of the resource to perform work
Table 1. Generic types of resources Resources
Description and examples Size or dimensional information relevant to the tasks. It may be a diagram showing available storage rooms and their sizes, or meeting rooms and their capacities. This type of resource may be used to determine, for example, where 20 computers should be stored. It is separate from Space location, as sometimes the visualisation may not relate space with actual location of the space – space to store computers, but not interested in where. Materials or consumable information relevant to the tasks. It may be an inventory list of materials to be used in the task, and whether you Materials have enough of those things: number, volumes, weights, etc. Some of these measures will be discrete and others will be continuous. Equipment information relevant to the tasks. It may be, for example, Equipment an inventory of barcode scanners required for the worklist item. Internal or external services information. It may be a list of travel Services booking agencies, printing services, or messaging services and their contacts/availabilities. Any “time” information relevant to tasks. It could be deadlines (eg., the time each task should be completed by), opening hours (eg., the Time time a particular service, for example a printing centre, is available) or a calendar showing working days. This type of resource will be useful in the planning of task execution sequences. Geographical “location” information relevant to tasks. It could be a map of a campus showing locations of university facilities, a floor plan of an office block, or a diagram showing relative distances between Location locations. This type of resource also can be used in scheduling of tasks. We separate this resource from space as our model uses location in both the sense of a resource (maps), and as a generic place holder for the work item location in the visualisation (grid layout). Information about people and their roles in an organisation. It could be an organisational chart showing roles and responsibilities of people. People This type of resource may be used in finding the right person to seek for specific help or to delegate a task. Current (active) tasks that are being carried out by the worker. This type of resource will help the worker determine the desirable workload, and effectively manage the current/future tasks. This resource is speActive Worklist cific to workflow research, as the number of active work items allowed is idiosyncratic to the worker involved, and may be influenced by management or worker originating factors.
We formalised the comparison previously in Equation ??, to illustrate the fundamental process involved in making work task choices. In order to aid understanding of the resource factors assessed by the capability function C(x,y) , we list the generic resource queries enumerated in [?]: – Quantity – how much of the resource exists at time t;
– – – – – – –
Consumption – how much is to be consumed by the worklist item; Divisibility – can the resources be divided up to service the work list items; Structure – does the structure of the resource fit the worklist item; Capacity – can the resource be shared with other work list items; Location – where is the resource; Commitment – is the resource available at time t; Trend – capability trend of resource.
In the enterprise resource ontology previously referred to, the above capabilities are defined with appropriate relationships to allow queries of the enterprise model. These query results can be mapped to different worklist visualisations, allowing the workers to assess the availability of resources to meet a task. The above queries are applied to the generic resources in Table ?? to yield a capacity value for those resources with regards to accepting the task.
5
Mapping Resources to a Worklist Visualisation
Domain specific issues have a major role in determining the type of queries for mapping the task to visualisation, but general mappings can also be inferred from generalisations of the tasks to be performed by the user of the visualisation. In this section, we describe our generic visualisation construction framework for worklist visualisation based on the resources we presented earlier. To illustrate our concept, we use the following simple workflow as running examples throughout the paper4 . 5.1
Example scenario
The workflow describes a stocktaking process given to an asset management officer who has to record all computer assets managed by a company. Figure ?? describes that, after stocktaking is announced, the officer has to plan and schedule field trips to various sites to physically locate an asset and record the asset number using a barcode scanner. This process will continue until all the sites have been visited. For the asset management officer to be able to carry out each task, some context information may be required. For example, s/he may want to know how far rooms are located from each other, how many assets are to be collected at each location, etc. to schedule the field trips efficiently. 5.2
Backgrounds and Overlays
For illustration purposes, we choose the four resources; time, location, people and active worklist. The visualisation framework is based on a layered approach, in which background and overlay planes are used. A 2D representation of any 4
The reader should note that the example is simplified for illustration purposes.
Stocktaking announced
Location found
Asset code scanned
Schedule visits to the locations
Scan the room code
Check whether all locations visited
Room code scanned
XOR
Schedule is prepared
Update/test the barcode scanner
Scan the asset code
More locations to be visited
All scheduled locations visited
Upload scanner data into FITSIS
The scanner is ready
Data uploaded
XOR
Legend
Visit the location Event
Function
XOR
Exclusive OR
Fig. 6. Event-Process-Chain diagram of the stocktaking process.
of the resources forms the background layer. Thus the background plane allows the comparison of resource values for each of the active worklist items being presented. For example: – The location resource uses a coordinate representation that shows whereabouts and distance between locations (eg., Street maps); – The people resource uses a chart or social network form of representation (eg., organisational charts); – The time resource uses a constrained time line form of representation (eg., Gantt chart). The overlay plane consists of the tasks in the worklist being viewed by the worker. Each task is given (x, y) coordinates in relation to the background, which is the resource information allocated to the task. We name the resource that is allocated to the background layer, the Principal Resource (PR). The final (x, y) coordinates for the work item are then a mapping of the input components of the PR vector to two dimensions in normalised device coordinates, formalised as a general mapping function here: f : Rn → R2 : rp 7→ wc
(2)
where: – wc is the 2D work item normalised window coordinate x = [0.0,1.0] and y = [0.0,1.0];
– rp is a vector of information defining the PR for the visualisation. We group these mappings into three functional types: – Coordinate mappings are an arbitrary mapping of specified locations with x,y coordinates mapped to the visualisation device, for example, GPS coordinates, that have no constrains with respect to each other (refer to Fig. ??). Each object may overlap other objects in the visualisation. – Regional mappings use an ID to lookup the region they are constrained to in the visualisation, for example, organisational unit name. However, the regions themselves may or may not be constrained relative to each other (refer to Fig. ??), and may overlap each other. – Grid mappings generate visualisation coordinates from enforced discrete rows and columns assigned to a worklist item, for example, the commencement time of a task (refer to Fig. ??). This represents a coordinate system separate to the final visualisation device coordinates. The grid is the default mapping of work item tasks, due to the fact that a simple list of work items is a form of column-based grid visualisation. The objects do not overlap each other, being constrained to grid cells. It should be noted that each of these visualisations requires fine tuning for an implementation, via computer graphics implementations. The graphics library is responsible for mapping the normalised device coordinates wc to pixel coordinates in the viewing window of the application [?]. Therefore, the mappings presented in this document represent a general form of the visualisation work item coordinate generation process. All of the worklist items on a case appear on every view. If the system selectively placed worklist items on a view, then the worker may miss items, or get confused by the changes from view to view. In addition, the item may require assessment from a number of resource viewpoints before being accepted or rejected by the worker. Therefore, we ensure that the entire worklist is shown on each view. The workers can easily switch from one view to another via tabbed windows. These tabs can be undocked to allow a free form window layout, if the user wishes. The framework is generic in that any types of resources can be presented using the overlaying technique. The same worklist can be viewed from different resource perspectives. Furthermore, the background and foreground can contain iconic representations of an arbitrary nature, to represent the worklist items using appropriate images that match domain specific metaphors, for example, a PC icon can represent a computer to be collected [?]. Each is a representation that can be used within a workflow system to decide about task choices, with regards to the relevant resources. They can be turned on and off by the designer of the workflow visualisation to allow or deny access to extra information regarding tasks. Each one can be modified to suit a particular application area, thus leaving room for development of novel visualisations tailormade for different applications. Included are example mapping functions for the PR, to show formally how it is transformed into (x,y) visualisation locations.
5.3
Resource Mapping Examples
Let us return now to consider the stock take example scenario. For illustrative purposes, we have chosen a subset of the tasks in the case study. The example worklist contains the following three tasks (ie., work items). 1. Collect scanner from S Block; 2. Scan items in O Block; 3. Scan items in A Block. We present a visualisation example for three resources we have chosen in the resource model: location, people and time, and apply them to the listed tasks in the stocktake case study. Example 1. Location Resource (Figure ??)
Fig. 7. Example Location Resource visualisation for the computer stock take example, mapping longitude and latitude values via a scale and translate to normalised window coordinates, overlaid onto a map of the QUT campus. A table of values is shown on the left, with the mapped locations on the right hand side as an example visualisation.
Task: compare the spatial locations of tasks to be performed for logistical purposes. Visualisation: map detailing the arrangements of tasks in space, to aid the worker in identifying efficient ordering of the work. Mapping Function: A variation of the coordinate mapping, wdc = M × rp , where rp consists of location resources information in specified units (eg. latitude and longitude) mapped to xw , yw values in pixels on visualisation device window, where M is the window transform (scale and translate) from world coordinates to device coordinates. Example 2. People Resource (Figure ??)
Fig. 8. Example People resource visualisation as a QUT section hierarchy, showing the region mapping from hierarchy ID to visualisation position via a lookup table. A table of values is shown on the left, with the mapped locations on the right hand side as an example visualisation.
Task: assess the capabilities of the people available for task. Visualisation: overlays of people available to meet task with encoding of match between people and the tasks colours/textures, including hierarchical views, social network views. In this example, the work items are mapped to a hierarchy list, to show which bureaucratic section the example is executed in, in order to see who needs to be contacted for task execution purposes. Mapping Function: A form of the region mapping, wdc = LU T (wsoc ), where LU T is a window coordinate lookup table function indexed by the id tag wsoc for the social group in which the worklist item belongs. Example 3. Time Resource (Figure ??) Task: compare the relative start and finish times for each task and insert it into the worklist at appropriate moments if time resources are available, either by leaving the task as whole, or dividing it into smaller components for insertion into small time gaps. Visualisation: Gantt Chart showing all available tasks on a time line in stacked manner to identify insertion points for the worklist items. Mapping Function: A fixed grid mapping, wdc = f (wid , t), where wid is the work item identification number, t is the time and wdc the final visualisation window device coordinates.
6
Interacting with the visualised worklist
In the visualised worklist, each task is represented by a coloured icon. An aggregated icon represents multiple instances of the same task. Figure ?? shows
Fig. 9. Example time resource visualisation for the stock take example. Each PR is a tuple of work item ID and time in hours. A table of values is shown on the left, with the mapped locations on the right hand side as an example visualisation. Depending on the intended workflow application, the other resources: Space, Materials, Equipment, Services and Active Worklist, can be visualised using a similar mapping process as the principal resource on the overlay plane. We now define an interaction framework for the previously mapped resource visualisations.
an example of a task with multiple instances. An aggregated icon is shown with four icons with numeric information regarding the number of instances and their status within the system. The state of any delivered task at one time may be the following: inactive, available, checked out and suspended, and included is the colour we have mapped to the state using the traffic light metaphor of red, green and amber: – – – – –
Inactive: unavailable to the worker (grey); Available: available to the worker to check out (amber); Checked Out: has been checked out by the worker (green); Checked In: has been checked in and completed by the worker (red); Suspended: has been checked out by the worker, is still incomplete, but checked in to the user (amber dashed).
After executing the visual worklist handler, and linking with a work flow server, the user interacts with the work item icons, by clicking on the icons to check out available tasks, and by clicking on checked out icons to check in completed tasks. Whenever appropriate, a form will be presented by the workflow system, to obtain data from the worker. The visual worklist handler user interactions are listed in Table ??.
7
Implementation
A major test of any workflow visualisation approach is its ability to be incorporated into a modern client server-based workflow system. We have built a
Fig. 10. Illustration of an aggregated icon made up of single task icons. The example shows a task titled ”Prepare Stock Check Report” with zero checked in, one checked out, three available and one task unavailable. The colour of each segment is annotated beside the icon for clarity. Table 2. List of worklist visualisation handler user interactions User Interaction Check Out
Check In Change View
Description The user right clicks on an Amber icon component within a visualisation, and chooses an instance of the work item in order to take responsibility for the task. The user right clicks on the Green icon component and chooses an instance of the work item to check in, to notify the workflow system of the completion of the task. To change visualisation type, the user clicks on the window tab listing the desired visualisation.
prototype of the proposed visualisation framework, and interfaced it with the workflow system YAWL. This section discusses the system architecture and implementation in detail. 7.1
The YAWL Environment
Our implementation is based on the open source workflow environment named YAWL (Yet Another Workflow Language), which is a research initiative at Queensland University of Technology [?]. YAWL is based on a set of workflow patterns developed via analysis and comparison of a number of commercial workflow systems. It provides a powerful and formal workflow description language, as well as an execution environment. To understand the architecture of our visualisation framework, we first present the overall architecture of YAWL. Workflow specifications are created in the YAWL designer which is a graphical editor, and deployed to the YAWL engine. The engine performs verification of the specifications and stores them in the YAWL repository. The specification can be loaded and launched for execution via the YAWL manager, and is hereafter referred to as a schema. The execution itself is managed by the YAWL engine. The YAWL engine interacts with the components labelled as YAWL services through Interface B. The YAWL ser-
vices (worklist handler, web services broker, interoperability broker and custom YAWL services) are based on the web services paradigm and all are abstracted as services in YAWL. How the engine communicates with the YAWL worklist handler is of particular interest in our work. The worklist handler is the component that is responsible for dispatching tasks to the workers. Through the worklist handler, the workers accept tasks and mark their completions. In conventional workflow systems, the worklist handler is part of the workflow engine. However, in the YAWL environment it is a separate component that interacts with the engine through Interface B. Through the interface, a custom service or application can be developed to extract worklist information for display in whatever manner is required.
Fig. 11. YAWL Visualisation Framework: Overall architecture
7.2
Worklist Visualisation Architecture
Based on the existing YAWL architecture, we have developed a new type of YAWL worklist handler which interacts with the engine through Interface B. The overview architecture is shown in Fig. ??. It has capabilities to (i) display the visualised resources and (ii) dispatch tasks like a normal worklist handler. The architecture consists of two components which have been designed and partially implemented: a visual worklist handler and a visualisation designer. The visual worklist handler can view multiple cases of running workflows, with multiple resource-centric views matched to the requirements devised by the YAWL schema designer. The worker loads the cases and is presented with a list of tasks, and a tabbed view list to switch between difference representations of the worklists. In the following two sections we describe the two components, and illustrate them with developed examples.
7.3
YAWL Visualisation Designer
The designer application is the most complete at this stage. It is designed around the structure of the visualisation approach we have developed, and is implemented in Java, as is the rest of the YAWL implementation. The visualisation designer allows the user to load Scalable Vector Graphics (SVG) files as backgrounds and icons for the overlay planes. This allows easy modification of images via other drawing tools. The SVG component of the designer is managed by the Batik Java package [?]. The designer application is an implementation of the work item coordinate scheme we detailed earlier. This designer allows the easy outlaying of tasks as icons across the background in the program. The process of designing a visualisation view for a schema is as follows: First decide on the background and overlay images, editing them in a separate tool and saving them as SVG files. Decide on the spatial arrangement of the tasks to be displayed according to the resources that need to be analysed, for example a map for logistics on QUT campus that will help a worker to decide where to perform their tasks. Until there is an adequate implementation of a resource model in YAWL, the icons are located by hand for the purposes of proof of concept. Load the workflow schema into the editor to obtain the tasks in the system, which appear in a mouse menu on a right click at the chosen location on the background (refer to Fig. ??). Load the background image. Set the current icon to be used by choosing from the list in a dialog (refer to Fig. ??). Move pointer to the location of the worklist item and right click to choose a task, and icon, repeating for all worklist items.
Fig. 12. Yawl Visualisation Designer: main components. The left window is the list of active icons, the right window is the main editing window, with the collect scanner work item being placed on the diagram.
Figure ?? illustrates the major components of the visualisation designer user interface via the stocktaking example on the campus map. The large window is the main window for visualisation design, and the smaller window shows a list of potential icons to be placed at locations on the visualisation. Each view is placed into a tabbed list, just as they are to be displayed in the visualisation agent. The menu is displayed using a mouse right click, showing the tasks defined in the schema. The icon can be placed at the location of the right click of the mouse, or using actual coordinates in the text entry boxes at the bottom of the screen. The icon at the bottom left of the image is the current task icon, “CollectScanner” and is shown using a disk icon. This visualisation design information is stored in an XML file (see Fig. ??) that defines an arbitrary number of views per schema, and the task icons, gained from the number of tasks within the YAWL schema. This file is then read by the Visual Worklist Handler to form the visualisation structure for communication to the YAWL engine. The following is a snippet from a visualisation specification. A specification may have a number of views , and each view may have a number of tasks . A view is associated with a background representing a resource. Each task is assigned a color for the description, coordinates, and an icon.
-16777216 240 760 file:/D:/Yawlstuff/demo/floppy.svg
Fig. 13. Example of visualisation specification file
We have implemented the beginnings of a visualisation editor and visualisation viewer, which we show in this paper. In a final implementation, additional resource information will be selected from the resource view of the YAWL schema as it is running. For now we are able to design worklists arranged according to grid, spatial and time arrangements.
7.4
YAWL Visual Worklist Handler
Worklists are disseminated in YAWL via the default worklist handler as simple dialogs containing lists of tasks, with no other resource information being displayed. We have begun implementing a visual worklist handler that is an extension of the default handler. The YAWL workflow implementation is structured around a component architecture that communicates via XML formatted commands. Thus the worklist handler is able to utilise the B interface to the running YAWL case in the same manner as the default worklist handler. The visual worklist handler is able to execute the visualisation developed with the designer that is stored in a file (see Fig. ??). The new worklist handler allows a more intuitive mapping of task coordinates to the check in and check out process. The user is able to check items in and out by simply clicking on the potential worklist item in its location on a map or hierarchy diagram. A running version of this design is shown in Fig. ?? and Fig. ??.
Fig. 14. The administration screen for the visualisation program, showing the stock take work flow schema being loaded and executed.
With a varied spatial organisations to the tasks, the person doing this stock take process can evaluate the task, using the map to make a decision about the acceptance of the worklist item in consideration of the location, time and potentially other resources.
8
Conclusion and Ongoing Work
We have described the beginnings of a thorough analysis of workflow visualisation; its theoretical basis, resource centric approach and appropriate visualisation techniques. Analysis of these sections revealed how to use these techniques within a typical workflow system. The task coordinate approach was described, showing how this can be generalised across a number of visualisations using a background and overlay approach. We have also begun the development of a visualisation development environment, with an editor and visualisation agent
Fig. 15. Screen dump of a running visualisation handler, showing a) default simple work item list, b) campus map visualisation, and c) same worklist viewed from the timeline perspective.
that uses SVG files and is easily integrated into the YAWL workflow system created by the BPM group at QUT. We have therefore shown supporting evidence that this visualisation approach can be used within a fully featured workflow environment. Further analysis will continue to refine the visualisation mappings to produce a knowledge base for development of visualisations within workflow applications. Firstly, there is the need to investigate the dependencies and relationships between separate resources, so that these relationships can be represented properly in the worklist visualisations, to enhance the decision making capabilities of the worker regarding multiple resources. In addition, there will be refinement of the broad categories of resources into more fine grained categories to derive a rulebase for an intelligent design agent to be incorporated into the visualisation designer. Evaluation experiments will be performed within a case study in order to ascertain the effectiveness of the resource centric visualisation approach with users of workflow tools. In addition, we are currently working on generalising the idea of worklist, which is produced from a workflow engine, to tasklist. Our tasklists can be (i) automatically populated from the work coming from various resources including a workflow engine, email correspondence, or calendar events, etc. and (ii) presented (i.e., visualised) in a coherent way that aids completion of a given task as well as providing a significant control over all the facet of task visualisation.
The project is inspired by the fact that the data and knowledge we consume for everyday tasks are more and more distributed (e.g., Internet, Intranet, email clients, mobile devices, calendar clients), improving productivity in workplace means improving the way people manage such knowledge. We plan to, first, exploit the latest resource view developments that are being implemented within YAWL, to enable the run time specification of resources and data associated with a task.
Acknowledgement This project is partially supported by a QUT Faculty of Information Technology collaborative grant. We acknowledge the programming assistance provided by Tore Fjellheim and Guy Redding, who programmed the visualisation editor and agent applets and integrated them into the YAWL workflow system. Their dedication and hard work towards implementing this project have been greatly appreciated.
References 1. Keller, P., Keller, M.: Visual Cues. IEEE Press., Piscataway USA (1993) 2. Tufte, E.: The Visual Display of Quantitative Information. Graphics Press, Cheshire, USA (1983) 3. Luttighuis, P., Lankhorst, M., Wetering, R.v.d., Bal, R., Berg, H.v.: Visualising Business Processes. Computer Languages (2001) pp.39–59 4. Bobrik, R., Reichert, M., Bauer, T.: View-based process visualisation. In: Proc. of the 5th International Conference on Business Process Management, Brisbane, Australia (2007) pp.88–95 5. Streit, A., Pham, B., Brown, R.: Visualization support for managing large business process specifications. In: Proc. of the 3rd International Conference on Business Process Management, Nancy, France (2005) pp.205–219 6. UNISYS: 3D Visible Enterprise (2004) www.3dvisibleenterprise.com/3dv/. 7. Schonhage, B., van Ballegooij, A., Elliens, A.: 3D gadgets for business process visualization:a case study. In: Symposium on Virtual Reality Modeling Language, Monterey, California, ACM Press (2000) pp.131–138 8. Systems, I.S.: Interactive Software (2004) www.interactive-software.de/. 9. Beeri, C., Eyal, A., Kamenkovich, S., Milo, T.: Querying business processes with bp-ql. In: Proceedings of the 31st international conference on Very large data bases, VLDB Endowment (2005) 1255–1258 10. Freire, J., Silva, C.: Towards enabling social analysis of scientific data. In: Social Data Analysis Workshop (in conjunction with CHI 2008). (2008) to appear. 11. Jones, W., Bruce, H.: A report on the nsf-sponsored workshop on personal information management (2005) http://pim.ischool.washington.edu/. 12. Karger, D., Bakshi, K., Huynh, D., Quan, D., Sinha, V.: Haystack: A general purpose information management tool for end users of semistructured data. (2005) 13–26 13. Dittrich, J., Salles, M.V.: idm: A unified and versatile data model for personal dataspace management. In: VLDB. (2006) 367–378
14. Latva-Koivisto, A.: User interface design for business process modelling and visualisation. Technical report, Department of Computer Science, Helsinki University of Technology, Helsinki (2001) Masters Thesis. 15. Leroux, H., Exton, C.: COOPE: a tool for representing concurrent object-oriented program execution through visualisation. In: Proc. of 9th Euromicro Workshop Parallel and Distributed Processing. (2001) pp.71–76 16. Jennings, N., Norman, T., Faratin, P.: ADEPT: An Agent-based Approach to Business Process Management. ACM SIGMOD Record 27 (1998) pp.32–29 17. Russell, N., van der Aalst, W.M.P., ter Hofstede, A.H.M., Edmond, D.: Workflow Resource Patterns: Identification, Representation and Tool Support. In: Proc. of CAiSE, Porto, Portugal, Springer Verlag (2005) (to appear). 18. Curtis, B., Kelner, M., Over, J.: Process modelling. Communication of the ACM 35 (1992) pp.75–90 19. Heijens, S.: Support for workflow administration and monitoring in the yawl environment. Master’s thesis, Vrije Universiteit Amsterdam (August 2005) http://www.yawl.fit.qut.edu.au/yawldocs/. 20. Fadel, F.G.: A Resource Ontology for Enterprise Modelling. Technical report, Enterprise Integration Laboratory, Toronto (1994) M.A.Sc. 21. Shreiner, D., Woo, M., Neider, J., Davis, T.: OpenGL(R), Programming Guide: The Official Guide to Learning OpenGL(R), 5th Ed. Addison-Wesley Professional, New York USA (2005) 22. Schneiderman, B.: Designing the User Interface 3rd Ed. Addison-Wesley, Reading, USA (1997) 23. Aalst, W.M.P.v.d., Hofstede, A.H.M.t.: YAWL: Yet another workflow language. Information Systems 30 (2005) pp.245–275 24. Batik: Batik SVG Toolkit (2005) http://xml.apache.org/batik.