Call/Recall Inc. has developed several kinds of two-photon recordable .... recording efficiency drops very quickly along the depth from the center of the beam.
Multi-layer Optical Data Storage Based on Two-photon Recordable Fluorescent Disk Media Haichuan Zhang, Edwin P. Walker, Wenyi Feng, Yi Zhang, Joannes M. Costa Alexander S. Dvornikov, Sadik Esener, Peter Rentzepis Call/Recall, Inc. 6160 Lusk Blvd. Suite C-206 San Diego, CA 92121 (858) 550-0596 fax: (858) 550-0917
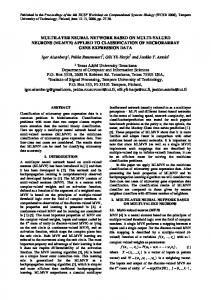
Abstract In this paper, we present a technology that can be used for random accessed mass optical data storage. The technology uses a two-photon recordable plastic disk medium that can fluoresce when recorded and that can support multiple stored data layers inside one disk. This technology is capable of achieving 200GB data capacity with a 120mm diameter, 10mm thick disk, and a data transfer rate of Gigabits/Sec by using parallel readout. 1. Introduction Since the amount of digital information is growing very fast and access to this information is made via faster and faster networks, data storage systems needs to keep pace with this explosive growth. High capacity data storage devices with high-speed data transfer rate and capable of random access are already in high demand. One approach to satisfy this demand is to increase the areal storage density. Unfortunately, for many of the conventional optical storage technologies this is becoming increasingly costly and technically challenging. Another direction to increase the data capacity is to stack multiple layers in one disk. This requires a new means of recording data in multiple layers closely packed together but with minimum interlayer crosstalk. The two-photon absorption based recording approach pioneered by Call/Recall Inc. uses the volume of suitable disk media enabling recording of highly packed multiple data layers at desired locations achieving very high volumetric densities [1,2,3,4,5]. Call/Recall Inc. has developed several kinds of two-photon recordable fluorescent WORM (Write Once Read Many) media. When recorded by two-photon absorption the recorded bits fluoresce when excited by a suitable readout laser beam. The recorded area in our materials is non-reflective and has no noticeable index change for both readout and recording enabling optical beams to access the volume of the disk without significant aberrations and losses. These properties allow the recording and readout beam to access multiple layers even in parallel. We should note that there are also possible approaches that use the index change [6,7,9] or photon bleaching [8] to store information by twophoton absorption but these approaches generally limit optical access to only a few layers. This paper presents the recording and readout systems and associated performances for single channel and parallel channels implementations. 2. Two-photon Recording Two-photon recording is based on two-photon absorption, by which one molecule is excited into a higher state by absorbing the combined energy of two photons. The two photons can be at different wavelengths or at the same wavelength (Figure 1). An excited molecule will combine with another type of dye molecule to become a new stable written form. This written form will emit a broadband fluorescence when excited with a readout laser beam at a suitable wavelength.
225
Single or dual optical beams can be used to provide the photons that are needed for twophoton absorption. In this paper we will focus on our more recent work with single beam recording.
“Write”
“Read”
S2 S1
532 nm
532 nm
X 710nm
S1
1064 nm
710nm 532 nm
Fluorescence 650 nm S0
Figure 1 Two-photon fluorescence media recording and readout 2.1 Recording Model In order to analyze the speed of the two-photon recording, we present a simple model in Figure 2. Knowing that the laser and the media properties impact recording most significantly, we make some assumptions of these important parameters, like the concentration of recorded molecules, laser power, pulse width, and repetition rate. Density D M of the molecules Area, A Total power P
Thickness, L
Figure 2 The two-photon recording analysis model In Figure 2, we assume that a uniform recording laser wavefront irradiates a media sample. We also assume that the media sample thickness is L and the area of the sample is A. In equation 1, we describe how much power, ∆P ' abs is absorbed by a tiny area containing only one recordable molecule. σ is the two-photon cross section of the molecules used in a given recording material. I is the laser beam irradiance (intensity), and can be described as the laser power P divided by the sample area A . ∆P ' abs = σ × I 2 = σ × ( P 2 / A 2 )
Equation 1.
226
Considering all molecules in the media with high σ , that is capable of significant twophoton absorption and defining DM as the density of these molecules and the ∆Pabs as the total amount of energy absorbed at a unit time by all the molecules inside the sample we obtain, ∆Pabs = DM ALσ × I 2 = DM ALσ × ( P 2 / A 2 ) = DM L(σ × P 2 / A)
Equation 2.
Since two-photon cross section, σ , is in the order of 10-28 cm 4 / W (or 10-48 cm 4 Sec / photons )[12,13], the recording efficiency is scaled with square of the laser intensity (or power within a unit area), and the plastic media will be damaged at sufficiently high optical powers, a pulsed laser with high peak powers is in general required for recording. For each laser pulse, ∆Pabs can be expressed as the number of recorded molecules M p by each laser pulse, multiplied by 2ηω . The laser power P can be expressed as the number of photons N p in each laser pulse over the pulse width t p ( ω is the angular frequency of recording photons). Equation 2 can then be rewritten as equation 3. 2 M p ηω = DM L[σ × ( N p ηω / t p ) 2 / A] ⋅ t p
Equation 3.
The product of M p (the recorded molecule in each pulse) and f
rep
(the repetition rate) is
proportional to the recording speed Vr .
Vr ∝ M p f rep
σ × N p 2 f rep ηω = DM L( ) 2t p A
Equation 4.
Equation 4 is based on a first order model that does not consider the details of various competing chemical reactions that can be involved in the recording process. This expression however closely expresses how the laser and media properties impact the recording speed. Np Indeed it can be observed that with higher peak powers and/or with higher average tp powers N p f rep from the laser source, the recording will take place faster. Also the tighter the laser beam is focused, the faster the recording will be. 2.2. Experimental evaluation of single beam two-photon recording When using one laser beam for two-photon recording, the recording location inside the media is controlled by the laser beam irradiance profile. The two-photon recording efficiency is scaled with the square of local laser irradiance (intensity). Because of this nonlinear response and sharp changing irradiance along a focusing beam, the recording takes place only within a small volume around the focus of the laser beam. Figure 3
227
shows the structure of our single-beam two-photon recording system. The system also includes a readout path and detector for evaluation of recorded data.
High repetition rate pulse laser
AO Modulator
Pinhole system For spatial filtering and beam expansion
PMT Detector
Red/Green Laser Diode
Beam splitter
0.5NA aspherical lens Recordable disk
COMPUTER Motion and data pattern control program
Air Spindle
XY motorized stage
Figure 3 Single-beam two-photon recording system diagram 2.2.1 Recording Rate We have evaluated single-beam two-photon recording by developing two recorders based on two different pulsed lasers for two different kinds of media.
Recording speed at 300KBits/Sec
Recording speed at 1.2Mbits/Sec
Figure 4 Data tracks with recorded different speeds and 2x2um2 fluorescence bits One laser is a high repetition rate (76MHz) short pulse (250fs) mode-locked Ti:Sapphire laser (Mira). We use this laser at 710nm wavelength. The average power is about 0.5W, and the peak power is about 26KW. The other laser is Nd:Vanadate laser with pulse
228
width 6.5pSec, repetition rate 27MHz. The average power is about 5W and the peak power is about 28KW. We use this laser at 532nm wavelength. By focusing these high peak power laser beams, we can easily obtain over 20GW/cm2 laser intensity at the focus point. Under these conditions the recording speed can exceed 1Mb/Sec. Figure 4 shows data tracks recorded with different data rate. The higher recording data rate results in a weaker fluorescence signal, due to the reduced number of laser pulses ( or the total energy of these pulses) used for recording a spot. 2.2.2 Recorded Bit Shape In the single-beam two-photon recording the recording location and volume is controlled by the laser beam irradiance (intensity) profile. With a sharply focusing beam, the recording efficiency drops very quickly along the depth from the center of the beam focus. The decreasing of the recording efficiency is closely scaled with the fourth order of the distance from the focus point. The shape of recorded fluorescence bit can be estimated by calculating the square of laser irradiance (intensity) distribution. 20 15
Z axis Z axis (um (um ) )
10 5
Z
0 -5 -1 0 -1 5 -2 0 -2
-1
0
1
2
Radial dimension (u m)
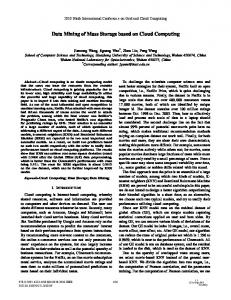
Confocal scan image
(A) (B) Figure 5 Estimated (A) and recorded (B) fluorescence bit shape along the recording depth (Z) by single-beam recording Figure 5 (A) shows a calculated irradiance (intensity) squared contour plot at focus with 5% contour value step, based on a 0.32 NA (Numerical Aperture) and 710nm TEM00 laser beam. Figure 5 (B) shows a scanned fluorescence image of the bits recorded under the same conditions. The image is scanned along the recording depth (Z) using a confocal microscope. It appears that the fluorescent spots recorded with single-beam two-photon recording have a long depth along the recording beam axis. This fluorescent spot depth is the dominant limiting factor for how close the layers can be recorded together without significant interlayer crosstalk. One way to shorten the depth of the fluorescent spots is to use higher NA (Numerical Aperture) optics in the recording system. Figure 6 describes how the NA of the recording optical system affects the recorded fluorescence bit depth, if aberrations associated with different NA systems can be neglected.
229
25
signal levels
(um) between 10% peak
Depth of fluorescence bit
30
20 15 10 5 0 0 .3
0 .3 5
0 .4
0 .4 5
0 .5
0 .5 5
0 .6
0 .6 5
0 .7
0 .7 5
N A o f t h e r e c o r d in g o p t ic a l s y s t e m
Figure 6 Depth of the recorded fluorescence bit vs. the NA (Numerical Aperture) of the recording optical system With higher NA, the depth of the fluorescent spots becomes smaller, thereby enabling layers to be recorded closer together. But with higher NA optics, aberrations limit in general the maximum number of layers possible. 2.2.3 Recorded Data Capacity The total disk capacity for a two-photon recorded fluorescence disk is determined by the total number of data layers that can be recorded in one disk and the areal data density in each data layer. We have been able to record data layers with 30µm layer separation. Layer1
Layer2 (A)
(B)
Figure 7 The two layers recorded with 30 µ m separation recorded in the single-beam recording system The different amounts of aberration at different disk depth bring a difficulty to maintain such a small layer separation through the disk volume. At the same time, the areal data density is determined by the radial size of the smallest data mark, which is also influenced by aberrations. Since aberrations can be predicted for each layer in the media, Layer2 aberration compensation schemes can be effectively devised to remove their limitations. Assuming aberration compensation schemes are implemented, 300 data layers in a 10mm thick disk with 30um layer separation appear possible in our simulation and experiments. It is also possible that a much smaller radial size mark can be recorded. Given a 1 µ m or
230
less radial mark size (which is achievable with aberration compensation for different recording depth) and 120mm diameter disk, the data capacity per layer could reach 500~700MB raw capacity. So the potential data capacity for a 120mm disk with 10mm thickness could exceed 200GB. 3. Signal Readout Typically, data is stored in our disks in data tracks that form a recorded data layer like on a conventional CD. However, in contrast to a CD many data layers are closely packed together in our approach. Figure 8 shows typical confocal scanned images of data tracks within one layer and multiple layers along the depth. In order to resolve a written spot on a given track at a given layer, the readout optics and servo must be properly designed.
Top layer
Bottom layer Data layers Data tracks
Figure 8 The fluorescence disk recorded with multiple layers and data.
4.0
Fluorescence Intensity [a.u.]
The recorded spots fluoresce when excited with a readout laser beam. Figure 9 shows the absorption and fluorescence spectra for one type of media that Call/Recall has developed. Written areas exhibit absorption in the visible range enabling their excitation. .
Absorption Optical Density
Written form Unwritten form
0
350
450
550
650
750
Wavelength [nm]
Figure 9 Absorption and fluorescence spectrum of the media
231
The fluorescence band is further shifted by Stoke’s shift to a longer wavelength band from the readout absorption wavelength. Call/Recall has developed several kinds of media where the absorption and emission characteristics can be tuned to desired wavelength bands enabling the use of various lasers for readout. The written spots can be excited by single or two-photon absorption however, because of its high efficiency single photon absorption enables low power, low cost, and compact lasers to be used for readout The emitted fluorescence signal is incoherent. In addition, it is radiated over a full 4 π space angle, and the readout objective lens can only collect a small percentage of the total fluorescence. By increasing the readout pump laser power, more photons can be emitted from the recorded spots. However, increasing the readout laser power beyond a certain level induces fatigue in the fluorescent molecules limiting the number of read cycles that can be performed. To achieve large numbers (107 to 108) of readout cycles from recorded spots of 2x2x20 um3 volume typically the spots are read out with a 1microwatt laser power and a nanoWatt level fluorescence signal can be collected into the detector. Typical photodiode detectors have less than 1A/W sensitivity and require large amplification to achieve a few hundred mV signal output required by conventional electronics. By using detectors with internal gain, like APD (Avalanche Photo Diode) and PMT (Photon Multiplier Tube), the requirements on electronic amplification can be eased. 3.1 Signal Quality in Single Channel Collinear Readout One simple approach to readout is the single channel collinear readout where the readout laser beam is focused into a data track and the fluorescent signal is collected by the same lens. Figure 10(A) shows a typical collinear readout system that we use. A scope trace in Figure 10(B) also shows the signal from a PMT when reading a single tone pattern data track. The signal current from the PMT is further amplified by a trans-impedance amplifier, which has over 10MHz bandwidth.
Readout signal from the single tone data track
(A)
(B)
Figure 10 The single channel collinear readout setup and the readout signal from recorded single tone fluorescence data track.
232
Experimentally, we find that the single channel data rate is limited in this set-up by the disk rotation speed and bits density to about 2Mbits/Sec. To evaluate this readout system, we have measured signal properties, like CNR (Carrier to Noise Ratio) and BER (Bit Error Rate). Figure 11 shows function blocks of our readout channel. Detector + Trans-impedance Amplifier
Threshold circuits (Convert analog signal to digital)
Filter
Channel Demodulation + ECC
Phase lock loop
Figure 11 The readout channel function diagram By reading out single tone and random data patterns, we have experimentally measured over 40dB CNR (Carrier to Noise Ratio) and better than 10-5 BER without ECC (Error Correction Coding) as shown in Figure 12.
42dB
10-5
Timing widow
Figure 12 CNR and BER measurement results When we record many layers in one disk and readout the fluorescence signal by the collinear readout method with a large detection window PMT (shown in figure 13), crosstalk between layers need to be considered as well. We find that the confocal architecture (shown in Figure 13) is an effective way to decrease this crosstalk. However, the pinhole used in our system might not be necessary for small aperture detectors, especially when the size of the detection window is close to the image size of the fluorescent spots. Figure 13 shows an estimated effect of the pinhole on decreasing inter-layer crosstalk. The curve indicates a 10 µ m pinhole placed at a 1:2 image system could block over 90% of fluorescence coming out from adjacent data layers, which are 30 µ m away from the focus location of the objective lens. In addition, this confocal architecture also blocks unwanted background noise into the detector.
233
Normalized energy in the confocal pinhole
1 0.8 0.6
Detector
0.4 0.2 0 -60 -40 -20 0 20 40 60 Distance from bit center along the depth (µ µm)
Fluorescence data layers
Illumination beam
Pinhole
Figure 13 Confocal Pinhole in the collinear readout system used to decrease layer crosstalk 3.2 Tracking and Focusing Servo for Fluorescence Data Track Non-reflective fluorescent media layers enable multi-layer readout. This also brings a unique challenge for the servo control of the objective lens. Compared to conventional reflective media our fluorescent media has zero background reflectance and no molded land/groove structures. The standard servo error signal generation techniques that use spot shape features and groove structures (i.e.- astigmatic focus, and push-pull tracking [10,11]) are difficult to implement for this new type of fluorescent media. One solution is to servo the data tracks based on the readout signal strength variations in a push-pull focusing and a push-pull tracking structure shown in Figure 14. to detectors z x y
Fluorescent spots
Recorded data tracks
inside focus A B C
at focus A B C
x z y Det #1 Det #2
1 FES =
inside focus at focus
outside focus A B C
( A + B ) − (C ) (A + B + C )
1
at focus TES =
∆z
( A) − (B ) (A + B) ∆y
outside focus
on track
-1
-1
0.5 volts/div 1ms/div
Figure 14 Outline of push-pull (out-rigger) focus and push-pull tracking error signal generation. Fluorescent light distribution on two detectors shown when lens in focus and
234
on either side of focus. Focus error signal (FES) obtained by subtracting two individual detector signals, tracking error signal (TES) obtained by subtracting left and right halves of bi-cell detector. Experimental FES, and experimental TES. The lateral (radial) dimension and longitudinal (depth direction) dimension of the recorded bit depend upon the recording optics (as discussed in 2.1.2). The fluorescent spot shape and power level changes more slowly in the focus direction due to the longitudinal dimension of the recorded mark. Two fluorescent spots are used to generate the FES (Focus Error Signal) to drive the actuator countering the defocus. The two illumination spots (shown in Figure 14) are slightly defocused from each other straddling the middle of the recorded tracks. The fluorescent light is collected into two detectors (Det#1 and Det#2). When the objective lens is in focus, the same amount of fluorescent power is incident upon both detector #1 and detector #2. When the lens is inside focus, the fluorescent power level on detector #1 is reduced relative to the fluorescent power level on detector #2. The situation is reversed when the lens is outside focus. The FES (Focus Error Signal) is obtained by subtracting the two individual detector signals. The associated focus servo electronics control the current in the voice-coil actuator to maintain the power balance between the detectors. A similar approach is used to generate tracking error signal (TES), where the left and right halves of the bi-cell detector #1 are subtracted. When the lens is on track, the power levels on the two halves of detector #1 are equal, and the levels become unbalanced when the lens moves off track. The actuator drives the lens one way or the other based on the detector signal variation to maintain focusing and tracking. Figure 14 also shows an experimental open loop focus error signal (FES) and open loop tracking error signal (TES), which are generated from an experimental system. Preliminary tests show that the servo system is able to follow tracks with about 50µm radial runout at 20Hz spinning rate. One disadvantage of this servo method is the illumination spots are not in the plane of best focus resulting in a slight decrease in signal level. But this initial success solves one of most important issues for developing a full functional write and read system. 3.3 Two-Dimensional Parallel Readout One of the main advantages when using two-photon fluorescence media is that the readout could be in parallel not only from the same layer, but also from multiple layers along the depth. This is because the recorded spots are not reflective for the readout beam and the media does not exhibit noticeable index change after recording. This prevents significant distortion of the readout laser beam phase front when traveling through the multiple recorded layers. By shaping and directing the readout beam differently, several optical system architectures are possible for two-dimensional parallel readout. Those architectures include focusing the readout beam from the curve side or the top side of disk. In all the cases multiple fluorescing data bits can be imaged into a detector array for parallel readout thus considerably increasing data rate. Two-dimensional readout however, also brings challenges to the readout optics, detector array, data formatting and data processing. It requires the optics for readout laser beam to
235
maintain a long depth of focus with a small beam waist at the focus, so that a large number of desired data bits can be illuminated while only a small amount of crosstalk is generated from adjacent unwanted bits. Requirements for a uniform performance across different media depths and a large field of view also complicate the imaging optical system design. Perhaps most importantly the system cost is increased especially when one considers the parallel electronics needed for channel demodulation. However, parallel readout schemes when applied judiciously to two photon recordable fluorescent multiplayer disk media should considerably increase the data rate. The FROST (Fast Readout Optical Storage Technology) consortium funded by DARPA is presently examining these trade-offs with the goal of demonstrating data transfer rates approaching 1Gbits/Sec. 4. Conclusions Two-photon absorption provides a means to record multiple data layers in one disk. Media properties such as non-reflective fluorescent written spots, unnoticeable index change and separated recording and readout absorption spectra make it possible to envision high data capacity disk systems with this approach. Based on experimental evidence we project the data capacity of a 120mm diameter 10mm thick disks to exceed 200GB. By studying means for parallel readout of this type of disk media we expect to demonstrate data rates of 100Mb/sec. The authors would like to thank Nam-Hyong Kim, Xuezhe Zheng, and Richard Sperber for their contributions to this work. We also thank the Defense Advanced Research Projects Agency (DARPA) and Air Force Research Laboratory (AFRL) for their sponsorship. Reference [1] D. A. Parthenopoulos and P. M. Rentzepis, Science 245, 843-845 (1989). [2] J.E.Ford, S.Hunter, R.Piyaket, Y. Fainman, S.Esener, A.S. Dvornikov, and P.M. Rentzepis, Proc. SPIE 2026, 604 (1993) [3] M. M. Wang, S. Esener, I. Cokgor, A.S. Dvornikov, and P.M. Rentzepis, Optics Letters, Vol22, No.8 April 15 (1997) [4] F. B. McCormick, H. Zhang, A. Dvornikov, E. Walker, C. Chapman, N. Kim, J. Costa, S. Esener, P. Rentzepis, Proc. SPIE Vol. 3802, (1999). [5] James H. Strickler, Watt W. Webb, Advanced Materials, No.6, 479-481, (1993) [6] A. Toriumi, J. M. Herrmann, S. Kawata, Optics Letters, Vol.22, No.8 (1997) [7] Daniel Day, Min Gu, Applied Optics, Vol.37, No.26, 6299-6304 (1998) [8] Min Gu, Daniel Day, Optics Letters, Vol. 24, No.5 (1999) [9] James H. Strikler, Watt W. Webb, Optics Letters, Vol.16, No.22 (1991) [10] A.B. Marchant, “Optical Recording,” Addison-Wesley, Massachusetts (1990). [11] G. Bouwhuis, J. Braat, A. Huijser, J. Pasman, A. Huijser, J. Pasman, G. Van Rosmalen, and K.S. Immink, “Principles of Optical Disk Systems,” Adam Higler, Bristol and Boston (1985). [12] B.H. Chumpston, J.E., Material Research Society, Proc. Vol. 488 1998 [13] Marcos Gugliotti, Mauricio S. Baptista, Mario J. Politi, Applied Optics, Vol.38, No.7, March 1999
236