GIS Ostrava 2013 - Geoinformatics for City Transformation
January 21 – 23, 2013, Ostrava
MULTI-LEVEL OBJECT-BASED URBAN MAPPING FROM REMOTE SENSING AND GIS DATA Txomin, HERMOSILLA, Luis, A. RUIZ, José, L. GIL-YEPES, Jorge, A. RECIO, Josep, E. PARDOPASCUAL Geo-Environmental Cartography and Remote Sensing Group, Universitat Politècnica de València, Camino de Vera s/n, 46022 Valencia, Spain
[email protected] Abstract Evolution of urban structure is very often related to population growth and socio-economic changes in large metropolitan areas. The availability and integration of spatial data such as imagery, airborne laser scanner (ALS) and database information is a potential source for mapping urban structure along the time. A multilevel object-based classification approach applied to the city of Valencia (Spain) is presented here, and its potential application in urban studies discussed. At first level, a classification of cadastral plots in seventeen land uses is obtained based on the automated extraction of multiple descriptive attributes from aerial images, airborne laser scanning (ALS) data and a cadastral database, providing information about the spectral, structural, shape, 3D metrics, internal and external spatial context of each plot in the city. Then, a second level classification in nine urban structural typologies at block level is achieved from another set of spectral, structural and 3D attributes at this broader scale, combined with the proportion of land uses per block obtained in the first level classification. The overall accuracies obtained for the two levels are above 80%, and can be improved reconsidering the classes. Analyzing the results and maps by administrative neighbours some structural differences are noticed, providing useful information for urban managers. The potential of the methods proposed is discussed for mapping the fragmentation of metropolitan areas, their dynamics in land uses and structural changes, and the relationship of these variables extracted from geospatial data to socio-economic changes. As a preliminary example, the total volume extracted from ALS data restricted to residential land use cadastral plots allows for the prediction of the population by 2 neighbourhoods with a coefficient of determination r =0.78. In the future, these data and techniques could be used to improve and validate urban structure models based on socio-economic statistical data. Keywords: urban structure, object-based mapping, land use, LiDAR, high-resolution imagery INTRODUCTION The urban spatial structure is a physical reflection of various processes during the evolution of a city (Anas et al., 1989), so urban districts constructed in different time periods show significant difference in building density and structures (Yu et al., 2010). The geometrical shape and topological relationships of open spaces and built-up areas significantly determine the appearance of urban environments, defining local particularities related to a spatial identity (Laskari et al., 2008). Consequently, the urban structural typologies can be depicted by describing their properties, such as the dimensions, shape, spatial arrangement and context of the buildings and diverse land covers that compose them. Although remote sensing is a real opportunity and a very relevant data source in this domain (Puissant et al., 2012), the structural description of a city using remote sensing data is dependent on the data used (Taubenböck et al., 2008). Remote sensing devices allow for a massive data acquisition. Multi-spectral imagery, collected from satellites or airborne sensors, provides valuable information to analyze the territory. Additionally, three-dimensional information is currently acquired using airborne laser scanning systems (ALS). These systems obtain point clouds representing the height distribution of the observed terrain and the aboveground elements. The precise characterisation of complex intra-urban patterns using remotely sensed data is a highly complex task, and commonly two stage approximation methods are used (Bauer and Steinnocher, 2001). Initially, the main land-cover types or significant elements in the image are identified, and then this information is analysed in a spatial context to define metrics that enable to discriminate land uses and structural typologies. According to Yoshida and Omae (2005), in analysis of urban morphology, remote sensing and Geographic Information Systems (GIS) may be able to take advantage of the physical explicitness represented by urban blocks, since they are defined incontrovertibly by roads in urban areas. This would enable to face the chal-
GIS Ostrava 2013 - Geoinformatics for City Transformation
January 21 – 23, 2013, Ostrava
lenges stated by Gamba et al. (2005) regarding the integration of multiple datasets to characterise urban areas, and to integrate the information derived from remotely sensed data in GIS. Thus, several authors have employed the urban block boundaries, or occasionally even urban plot boundaries, to define objects in order to extract descriptors quantifying the geometry and the area covered by buildings, vegetation, or the diverse construction materials (Zhan et al., 2000; Bauer and Steinnocher, 2001; Wijnant and Steenberghen, 2004; Laskari et al., 2008; Novack et al., 2010; Vanderhaegen and Canters, 2010; Huck et al., 2011). These metrics are complemented with height information and volumetric descriptor sets when three-dimensional (3D) information is available (Yoshida and Omae, 2005; Wu et al., 2009; Yu et al., 2010; Hermosilla et al., 2012a; Heiden et al., 2012). This paper aims the development of methods to: (i) extract, integrate, and organize quantitative informational attributes from aerial images, airborne laser scanning data, and cadastral limits at plot and urban block levels; (ii) classify urban areas in land uses (at plot level) and structural typologies (at block level), in order to structurally characterise urban neighbourhoods. In addition, the potential of the former tools for the study of socioeconomic variables and their relationship with the structural typologies and land uses will be discussed, useful to better understand the functional organization, evolution and quality of living urban spaces. STUDY AREA, DATA AND PREPROCESSING The study was performed in the metropolitan area of the city of Valencia, Spain, the third largest urban concentration in Spain in terms of population. The municipality of Valencia is administratively divided in 19 districts, which are subdivided in 87 neighbourhoods. Imagery and LiDAR data were used. These data were acquired in the frame of the Spanish National Program of Aerial Orthophotography (PNOA). The images were collected in August 2008, with 0.5 m/pixel spatial resolution, 8 bits radiometric resolution, and three spectral bands were used: infrared, red and green. These images are distributed orthorectified and georreferenced, the panchromatic and multispectral bands fused, mosaics and radiometric adjustments applied. LiDAR data were acquired in September 2009 using a RIEGL LMS-Q680 ALS with a scan frequency of 46 Hz, 70 kHz of pulse repetition rate and a scanning angle of 60º. The mean flying height was 1,300 meters, a 2 2 nominal density of 0.5 points/m and an average density value of 0.7 points/m . A normalised digital surface model (nDSM), i.e., the difference between the digital surface model (DSM) and the digital terrain model (DTM), representing the physical heights of the elements with respect to the terrain, was generated from LiDAR data. The DTM was computed using an algorithm that iteratively selects minimum elevation points and eliminates points belonging to any aboveground elements, such as vegetation or buildings (Estornell et al., 2011). The urban cadastral plot, represents a distinguishable administrative unit in terms of land ownership of an urban area. Urban blocks are groups of plots, surrounded by public roads. Plot and urban block boundaries were provided by vectorial cadastral cartography in shapefile format, produced by the Spanish General Directorate for Cadastre (Dirección General de Catastro). This cartography has a scale of 1:1.000. Several descriptors are based on the building and vegetation covers. Both, building and vegetation covers were obtained using an automatic building detection technique consisting of applying a multiple-threshold based approach, which is fully described and assessed in Hermosilla et al. (2011). METHODOLOGY In complex environments such as urban areas, the analysis of the structure of the elements must be faced at different complexity or scale levels. Further combination of these levels may help us to understand the evolution of these dynamic areas that conform a city. In order to study administrative neighbourhoods and to relate their structural properties with socio-economic variables, two lower scale levels were considered – plot and urban block – to extract different quantitative measurements that provide information to classify and structurally characterize the neighbourhoods. Fig. 1 shows a flowchart summarizing the methodology applied. The objective of the plot-level characterisation was to extract descriptive features from the remotely sensed
GIS Ostrava 2013 - Geoinformatics for City Transformation
January 21 – 23, 2013, Ostrava
data and the cadastral cartography limits that enable to assign a land use to each cadastral plot. Afterwards, the urban block level characterisation aimed to classify each urban block into an urban structural typology based on the information provided by descriptive features, plus the land-use information obtained at plot level.
Fig. 1. Scheme of the proposed methodology for classification in urban land uses and structural typologies. Extraction of object-level descriptive features Plot-level and urban-block-level feature extraction were performed using and object-based image analysis approach. In an object-based approach, image analysis is performed by considering objects instead of pixels. An object is a group of pixels with common characteristics created by means of a determined segmentation criterion (Blaschke, 2010). In this case, plot and urban-block boundaries from cadastral cartography were used to define objects at their respective levels. Seventeen land use classes were defined to perform the classification of the cadastral plots: ten urban and seven agricultural uses. Five urban classes were related to residential uses: historical buildings, urban buildings, open urban buildings, semi-detached houses, and detached houses. The rest of urban classes were: industrial/warehouse buildings, religious buildings, commercial buildings, public buildings –including schools, universities, sport facilities and civic and governmental buildings–, and gardens and parks. The agricultural classes defined were: arable lands, citrus orchards, irrigated crops, carob-trees orchards, rice crops, forest, and greenhouses. At this characterisation level, objects were defined using the plot boundaries. A set of object-based descriptive features depicting each object as a single entity based on diverse aspects reflecting the variety of information used were computed using the object-based image analysis software FETEX 2.0 (Ruiz et al., 2011). The computed features provided information regarding spectral, texture, structural (based on the semivariogram graph, see Balaguer et al., 2010), geometrical, and height properties (derived from the nDSM). Context was described by characterizing higher and lower aggregation levels of the plots. Thus, internal context features describe an object attending to the land cover types and distribution of the elements contained within the object (denoted as sub-objects), in this case buildings and vegetation. External context is defined characterizing each object by considering the properties of the urban block containing the plot. This context is described by means of specific building-based, vegetation-based, geometrical, and adjacency features (see Hermosilla et al., 2012a for a full description of the context features).
GIS Ostrava 2013 - Geoinformatics for City Transformation
January 21 – 23, 2013, Ostrava
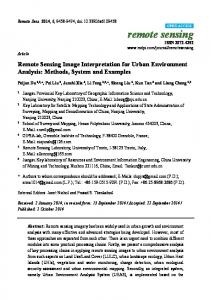
Nine urban typologies were defined for the urban-block-level classification, based on the analysis of the urban structure of Valencia, partially defined by the evolution of the city along the time: historical town, late XIX century expansion (known as ensanche in Spanish), residential areas built in 1950 and 1960 decades (1950-1960s residential areas), residential areas from 1970 and 1980 decades (1970-1980s residential areas), residential areas constructed during the 2000 decade (2000s residential areas), single-family suburban areas, industrial areas, gardens and parks, and community service facilities, including public, commercial, and religious buildings and landmarks. Fig. 2 shows examples of the nine structural typologies defined.
Fig. 2. Examples of the urban structural typologies defined: a) Historical town, b) late XIX century expansion (ensanche), c) 1950-1960s residential areas, d) 1970-1980s residential areas, e) 2000s residential areas, f) single-family suburban areas, g) industrial areas, h) gardens and parks, i) community service facilities. Urban blocks were characterised using features describing the geometry or their shape, and to the area, height and volumetric information of the buildings and vegetation contained in them. These descriptive features constitute the external context descriptors when working at plot-level. The build-up and vegetation area and percentage of occupation, mean and standard deviation of the building and vegetation height, mean volume of the buildings, and mean and standard deviation of the NDVI in the vegetation cover were computed. In addition to these features, the land-use percentages of the plots contained in each urban block were also included as descriptive features. These land uses were obtained as a result of the plot-level classification. The considered land-uses were the urban classes: historical buildings, urban buildings, open urban buildings, semi-detached houses, detached houses, industrial/warehouse buildings, religious buildings, commercial buildings, public buildings, and gardens and parks. Since many descriptive features were defined, some of them were redundant in terms of efficient description of the objects, and their use may introduce noise in the classification process. Consequently, a selection was carried out in order to determine the best set of descriptive features for classification, using forward stepwise linear discriminant analysis (LDA). In this method, all variables are reviewed and evaluated at each step to determine which one will contribute most to the discrimination between classes. That variable is included in the model and the process is iterated. Thus, LDA was employed for selecting the most relevant descriptive features to be used in each classification process, selecting variables until the estimated classification accuracy was stabilised. Classification of objects Classifications were performed using of decision trees constructed with the C5.0 algorithm combined with the boosting technique. This algorithm divides the sampling set by using mutually exclusive conditions, until homogeneous subgroups are generated, i.e. all the elements in a subgroup belong to the same class, or a stopping condition is satisfied (Quinlan, 1993). Previous to the classification, training and evaluation samples were collected following two criteria: per-class representativeness and spatial distribution homogeneity. Two
GIS Ostrava 2013 - Geoinformatics for City Transformation
January 21 – 23, 2013, Ostrava
types of samples were considered, cadastral plot or urban block, for both classification levels. Sampling was designed applying a restricted randomization scheme (Chatfield, 1991), consisting on a random sampling selection to ensure the spatial homogeneity, followed by a redistribution and addition of some samples with the criteria to maintain the appropriate number of samples according to the internal variability of each class. A reference class was assigned to each object by means of visual photointerpretation of the high-resolution aerial images. The evaluation of the classifications is based on the analysis of the confusion matrices (Congalton, 1991), which compare the class assigned to each evaluation sample with the reference information. The overall classification accuracies were obtained, as well as the producer’s and user’s accuracies for each class, which respectively expose the classification errors of omission and commission. The classification accuracy assessment was done by using leave-one-out cross-validation technique to increase the efficiency in terms of number of samples and to use independent training and test samples. This method uses a single object from the original sample set as validation data, and the remaining objects as training data. This is iterated until each observation in the sample set is used once as validation data (Fukunaga, 1990). RESULTS In the land use classification at plot level an overall accuracy of 84.8% was obtained, showing a high performance of the method for the agricultural and urban classes defined. Most unbalanced values in terms of user’s and producer’s accuracy (see graph in Fig.3) were obtained for the following land uses: commercial buildings, religious buildings, and public buildings. These results are in concordance of previous results Hermosilla et al. (2012b), and are explained by the high diversity of public buildings and commercial buildings, the low representation of samples available from religious buildings.
Fig. 3. User’s and producer’s accuracies for the land-uses defined at plot-level classification. In order to assess the improvement of the introduction of multi-level features, two different results were reached, considering only the urban-block features, and combining those with information extracted from the land use classification of plots. In general terms the results of the classification in structural typologies at block level show that the addition of the land use information obtained at plot-level significantly improves the overall performance of the classification, increasing the overall accuracy from 68.6% to 80.2%. Analyzing the impact of the addition of land use information in each specific class (see Fig. 4), all urban typologies noticeably increase both, their user’s and producer’s accuracies, with the single exception of the 1970-1980’s residential typology, which has a decrease in its producer’s accuracy. The major increases are shown in the typologies Community service facilities and Gardens and parks, followed by Historical town and 1950-1960s residential areas. This may be due to the internal variability inherent to these urban classes, in terms of number and distribution of the elements within them. The urban typologies presenting the highest accuracies are Industrial areas and Single-family suburban housing, reaching values closer and higher than 90%. This is given since these typologies present constructions and morphological properties significantly
GIS Ostrava 2013 - Geoinformatics for City Transformation
January 21 – 23, 2013, Ostrava
different to the rest of urban typologies considered. Thus, Industrial areas are composed of large buildings, whereas Single-family suburban housing shows small buildings and noteworthy presence of vegetation. The lowest precision is reached for the 1950-1960s residential areas and 1970-1980s residential areas, with user’s and producer’s accuracy values of approximately 60%, presenting both classes major confusion with Historical town and Late XIX century expansion typologies.
Fig. 4. User’s and producer’s classification accuracies for the urban-typologies defined at urban-block level characterisation considering only the urban-block features, and combining these with the information of the plot level land use classification. DISCUSSION AND POTENTIAL APPLICATIONS A multi-level approach for urban classification based on high-resolution imagery and LiDAR data has been proposed and evaluated in the area of Valencia. The availability of Earth observation data is growing fast in the last decades, in particular for large cities. The regular application of these techniques may provide valuable input to analyse the dynamics of urban areas, but they may have even more potential to study, understand and model the evolution in spatial urban structures of big cities. This is a critical issue, since it is accepted that spatial structures have great influence in the degree of economic and ecological efficiency of the cities, in their functional organization and quality as suitable spaces for the development of human life (Escolano, 2007). Evolution of internal structure in metropolitan areas is related to changes in resident population, employment, migration, and other socioeconomic parameters. Rossi-Hansberg et al. (2009) studied this evolution in urban structure and its relations to the number and size of commercial establishments in different areas of US cities, creating a model to understand the fragmentation of firms based on structural measurements. Additionally, they found an effect of population growth on urban structure in the 1980s. In our work, we obtained a land use classification at plot level, and a classification of structural typologies at block level. This two-level information can be used at a broader scale to analyze the status and evolution of the different neighbourhoods or districts that form the city. Thus, as a result of the classification map, main structural differences can be observed in the neighbourhoods (Fig. 5). Some of them present an evident homogeneity in their composition of structural typologies (see Fig.6a and Fig.6c), whereas others have a higher variability. This variability can be expressed in a different manner, e.g., the neighbourhood in Fig. 6b presents a high degree of fragmentation of structural types, while that in Fig. 6d shows a distribution of the structural typologies grouped in clusters. This occurs because the boundaries of the neighbourhoods of a city have administrative purposes, and they do not have always a direct correspondence to the actual urban structural morphology. The generation of fragmentation indices of structural classes combined to the land uses within neighbourhoods can be related in future work to population movements, spatial distribution of employment, or commercial activities, helping to explore and understand changes in socioeconomic parameters and their relation to the urban structure.
GIS Ostrava 2013 - Geoinformatics for City Transformation
January 21 – 23, 2013, Ostrava
Fig. 5. Thematic map composition showing the result of the structural classification of the urban-blocks with the administrative neighbourhood boundaries.
Fig. 6. Examples of classification in structural typologies of four administrative neighbourhoods.
GIS Ostrava 2013 - Geoinformatics for City Transformation
January 21 – 23, 2013, Ostrava
A preliminary use of these attributes extracted from imagery and 3D data is the prediction of population at neighbourhood level using single linear regression. Considering the 71 neighbourhoods in Valencia that present a pure urban structure (the remaining 16 neighbourhoods are mainly rural or present a mixed periurban structure), and using only the total volume of buildings obtained from the LiDAR data set as descriptive 2 attribute or independent variable, the population is estimated with r = 0.60. However, restricting the volume 2 calculation to only those buildings with residential land-use, the coefficient of determination increases to r = 0.78 (Fig. 7). This first results show the potential of the combination of land use and structural information to improve the explanation of socioeconomic variables.
Fig. 7. Predicted vs. actual population using two different models: considering the volume of all buildings, or only the volume of those buildings with residential land uses. CONCLUSIONS This paper presents a multi-level approach to classify and further characterise urban areas integrating highspatial resolution multi-spectral imagery, airborne LiDAR data, and cadastral cartography. From these data, a set of descriptive features quantifying the discriminative properties of image elements were extracted at two analysis levels: plot and urban-block. The objective at plot-level was to categorise land uses. The resulting classification, together with other image-derived and 3D descriptive features, was used to characterise and classify urban blocks into structural typologies. The analytical results showed that the use of multi-level descriptors providing specific information about the land use enable to significantly improve the classification accuracy of the urban structural typologies. Thus, the proposed methodology enables to derive valuable information for a massive and non-subjective characterisation of urban areas, defining and adapting the land-use and structural-typology legends to each particular scenario analyzed. The proposed multi-level characterisation may be used to understand and model the spatial evolution of urban structures within a city. As the urban structure is strongly related to socio-economical aspects, the analysis of the spatial distribution of the urban typologies, among other image-based and 3D descriptive features, may also be useful to describe and analyse changes in resident population, employment, migration, and other socioeconomic parameters. An actual challenge of these methods is the current lack of base cartography, needed to create the objects at different scales or levels, in some large metropolitan areas of developing countries. This could be partly solved by using automated image segmentation techniques based on images (Novack et al., 2010; Huck et al., 2011).Improved stratification techniques can also be used to define the study objects or zones, providing a more realistic behaviour of the configuration of the urban units at different scales.
GIS Ostrava 2013 - Geoinformatics for City Transformation
January 21 – 23, 2013, Ostrava
ACKNOWLEDGEMENTS The authors appreciate the financial support provided by the Spanish Ministry of Science and Innovation and FEDER in the framework of the projects CGL2009-14220 and CGL2010-19591/BTE, and the support of the Spanish Instituto Geográfico Nacional (IGN). REFERENCES Anas, A., Arnott, R. and Small, K.A. (1989) Urban spatial structure. J. Econ. Lit., 36(3), 1426-1464. Balaguer, A., Ruiz, L.A., Hermosilla, T. and Recio, J.A. (2010) Definition of a comprehensive set of texture semivariogram features and their evaluation for object-oriented image classification. Comp. Geosci., 36, 231-240. Bauer, T. and Steinnocher, K. (2001) Per-parcel land use classification in urban areas applying a rule-based technique. GeoBIT/GIS, 6, 24-27. Blaschke, T. (2010) Object based image analysis for remote sensing. ISPRS J. Photogram. Remote Sens., 65(1), 2-16. Chatfield, C. (1991) Avoiding statistical pitfalls. Stat. Sci., 6(3), 240-252. Congalton, R. (1991) A review of assessing the accuracy of classications of remotely sensed data. Remote Sens. Environ., 37(1), 35-46. Escolano, S. (2007) Cambios recientes de las estructuras espaciales de las grandes ciudades: fragmentación física, segregación socioeconómica y reorganización funcional. Los Procesos Urbanos Postfordistas: Actas del VIII Coloquio y Jornadas de Campo de Geografía Urbana, Universidad Islas Baleares-Asociación Geógrafos Españoles, Palma de Mallorca. Estornell, J., Ruiz, L.A., Velázquez-Martí, B. and Hermosilla, T. (2011) Analysis of the factors affecting LiDAR DTM accuracy in a steep shrub area. Int. J. Digit. Earth, 3(6), 118-1210. Fukunaga, K. (1990) Statistical Pattern Recognition. Academic Press, New York. Gamba, P., Dell'Acqua, F. and Dasarathy, B.V. (2005) Urban remote sensing using multiple data sets: Past present and future. Inf. Fusion, 6, 319-326. Heiden, U., Heldens, W., Roessner, S., Segl, K., Esch, T. and Mueller, A. (2012) Urban structure type characterization using hyperspectral remote sensing and height information. Landsc. Urban Plan., 105, 361-375. Hermosilla, T., Ruiz, L.A., Recio, J.A. and Estornell J. (2011) Evaluation of automatic building detection approaches combining high resolution images and lidar data. Remote Sens., 3(6), 1188-1210. Hermosilla, T., Ruiz, L.A., Recio, J.A. and Cambra-López, M. (2012a) Assessing contextual descriptive features for plot-based classification of urban areas. Landsc. Urban Plan., 106, 124-137. Hermosilla, T., Ruiz, L.A., Recio, J.A. and Balsa-Barreiro, J. (2012b) Land-use mapping of Valencia city area from aerial images and LiDAR data. GEOProcessing 2012: The Fourth International Conference in Advanced Geographic Information Systems, Applications and Services, Valencia, 30 January - 4 February, Curran Associates, Inc. , NY, pp. 232-237. Huck, A., Hese, S. and Banzhaf, E. (2011) Delineating parameters for object-based urban structure mapping in Santiago de Chile using QuickBird data. Int. Arch. Photogramm. Remote Sens. Spat. Inf. Sci., 38(4/W19), 131-136. Laskari, S., Hanna, S. and Derix, C. (2008) Urban identity through quantifiable spatial attributes: coherence and dispersion of local identity through the automated comparative analysis of building block plans. In: Gero, J.S. and Geol, A.K., (eds), Design Computing and Cognition '08: Proceedings of the Third International Conference on Design Computing and Cognition, Springer Netherlands, Dordrecht, pp. 615-634.
GIS Ostrava 2013 - Geoinformatics for City Transformation
January 21 – 23, 2013, Ostrava
Novack, T., Kux, H.J.H., Feitosa, R.Q. and Costa, G. A. (2010) Per block urban land use interpretation using optical VHR data and the knowledge-based system interimage. Int. Arch. Photogramm. Remote Sens. Spat. Inf. Sci., 38(4/C7), 7pp. Puissant, A., Zhang, W. and Skupinski, G. (2012) Urban morphology analysis by high and very high spatial resolution remote sensing. International Conference on Geographic Object-Based Image Analysis 4, (GEOBIA), Rio de Janeiro, 7-9 May, pp. 524-529. Quinlan, J.R. (1993) C4.5. Programs for machine learning. Morgan Kaufmann Publishers, Inc., San Mateo. Rossi-Hansberg, E., Sarte, P.D. and Owens, R. (2009) Firm fragmentation and urban patterns. Int. Econ. Rev. 50(1), 143-186. Ruiz, L.A., Recio, J.A., Fernández-Sarría, A. and Hermosilla, T. (2011) A feature extraction software tool for agricultural object-based image analysis. Comp. Electron. Agric., 76(2), 284-296. Taubenböck, H., Esch, T., Wurm, M., Thiel, M., Ullmann, T., Roth, A., Schmidt, M., Mehl, H. and Dech, S. (2008) Urban structure analysis of mega city Mexico City using multi-sensoral remote sensing data. Proceedings of the SPIE: Remote Sensing for Environmental Monitoring, GIS Applications, and Geology VIII, Cardiff, 15-19 September, SPIE, Bellingham, 12pp. Vanderhaegen, S. and Canters, F. (2010) Using remote sensing data for improving the distinction between distinct types of urban land use and form using spatial metrics. In: Rainer Reuter (ed), Proceedings of the 30th EARSeL Symposium: Remote Sensing for Science, Education and Natural and Cultural Heritage, Paris, 31 May – 3 June, European Association of Remote Sensing Laboratories, pp.757 – 764. Wijnant, J. and Steenberghen, T. (2004) Per-parcel classification of urban ikonos imagery. 7th AGILE Conference on Geographic Information Science, Heraklion, 29 April – 1 May, pp. 447–455. Wu, S.S., Qiu, X., Usery, E. L. and Wang, L. (2009) Using geometrical, textural, and contextual information of land parcels for classification of detailed urban land use. Ann. Assoc. Am. Geogr., 99, 76–98. Yoshida, H. and Omae, M. (2005) An approach for analysis of urban morphology: methods to derive morphological properties of city blocks by using an urban landscape model and their interpretations. Comput. Environ. Urban Syst., 29(2), 223-247. Yu, B., Liu, H., Wu, J., Hu, Y. and Zhang, L. (2010) Automated derivation of urban building density information using airborne LiDAR data and object-based method. Landsc. Urban Plan., 98(3-4), 210-219. Zhan, Q., Molenaar, M. and Gorte, B. (2000) Urban land use classes with fuzzy membership and classification based on integration of remote sensing and GIS. Int. Arch. Photogramm. Remote Sens., 33(B7), 1751-1759.