Multi-Objective Optimization, Agent-based Modeling, .... the NYU Center for Catastrophe Preparedness and Re- .... attack and the first emergency call.
MULTI-OBJECTIVE EVOLUTIONARY OPTIMIZATION OF AGENT-BASED MODELS: AN APPLICATION TO EMERGENCY RESPONSE PLANNING 1
Giuseppe Narzisi1,2 , Venkatesh Mysore2 and Bud Mishra2 Department of Mathematics and Computer Science, University of Catania, Italy 2 Courant Institute of Mathematical Sciences, New York University, USA emails: {narzisi, mysore, mishra}@nyu.edu
ABSTRACT Agent-based models (ABMs) / multi-agent systems (MASs) are today one of the most widely used modeling– simulation–analysis approaches for understanding the dynamical behavior of complex systems. These models are often characterized by several parameters with nonlinear interactions which together determine the global system dynamics, usually measured by different conflicting criteria. The problem that emerges is that of tuning the controllable system parameters at the local level, in order to reach some desirable global behavior. In this research paper, we cast the tuning of an ABM for emergency response planning as a multi-objective optimization problem (MOOP). We then propose the use of multi-objective evolutionary algorithms (MOEAs) for exploration and optimization of the resultant search space. We employ two well-known MOEAs, the Nondominated Sorting Genetic Algorithm II (NSGA-II) and the Pareto Archived Evolution Strategy (PAES), and test their performance for different pairs of objectives for plan evaluation. In the experimental results, the approximate Pareto front of the non-dominated solutions is effectively obtained. Further, a conflict between the proposed objectives is patent. Additional robustness analysis is performed to help policymakers select a plan according to higher-level information or criteria not present in the original problem description. KEY WORDS Multi-Objective Optimization, Agent-based Modeling, Pareto Front, Multi-Objective Evolutionary Algorithms, Robustness, Disaster Management.
1 Introduction The emerging area of agent-based simulation has seen an exponential growth in the last few years, including applications to social science, marketing, business, biology, and several other real-world domains [1]. In such models, the system is modeled as a collection of autonomous decision-making entities called “agents”. A large multiagent system can produce very complex dynamics even if the individual agents and their interactions follow simple rules of behavior. These emergent behaviors may be even more unpredictable and even counter-intuitive, if the agents are embedded and forced to interact in a real-world envi-
ronment which introduces more communication channels, constraints and behavior rules. ABMs are often characterized by several parameters with nonlinear interactions which together determine the global system dynamics. The modeler usually desires to produce a system that satisfies some global behavior that can be measured by different conflicting criteria, but the model is designed bottom-up from the agent’s local perspective. The consequence is that the system parameters at the local level of the agent rules of behavior must be tuned in order to reach some global objectives. Although the consequence of this calibration / tuning process is substantial, very few attempts for a general method are present in literature, especially with a successful application to real-world systems. Some public tools, like NetLogo1, allow the user to explore the parameter space of the system in a systematic and automatic way, but these approaches become impractical when there are many real-valued parameters. In [2], a parameter sweep infrastructure is proposed where searcher agents traverse the parameter space in search of higher “fitness”. More recently, the use of evolutionary computation has been considered: in [3], a single-objective genetic algorithm is proposed to explore the parameter space of a simple ant-foraging example with ten ants and tuning only two parameters of the model; in [4], a multi-objective evolutionary approach is used to calibrate a simple agent-based model of a financial market, using as objectives the mean and the variance of the simulated model with respect to the real data. It is important to note that this calibration / tuning process acquires different perspectives according to the specific dynamical system that is modeled and analyzed. In our work, we propose a novel method for searching and selecting emergency response plans in disaster management. Planning can be seen as the problem of adjusting the controllable parameters in the interaction between different classes of agents (hospitals, persons, on-site responders, ambulances, etc. ) and available resources, in order to minimize the negative consequences of a catastrophic event. As part of New York University’s Center for Catastrophe Preparedness and Response (NYU’s CCPR), “P LAN C” 2 [5, 6, 7] – a novel comprehensive multi-agent model for simulating large-scale urban disasters has been devel1 http://ccl.northwestern.edu/netlogo/ 2 http://www.bioinformatics.nyu.edu/Projects/planc/
oped. Here, the performance of a candidate plan can be evaluated based on the output of the system, according to different user-specified criteria. In this paper, we show how this problem can thus be formulated as a constrained MOOP, and how multi-objective evolutionary algorithms (MOEAs) can be effectively used to produce approximated Pareto fronts of “good” preparedness and response plans. The rest of the paper is organized as follows: in Section 2, we start with a short description of the P LAN C model and its main features; Section 3 introduces the major concepts of multi-objective optimization and shows how the problem of searching for good plans using the P LAN C model can be formulated as a constrained MOOP; Section 4 describes the use of multi-objective evolutionary algorithms for the proposed optimization problem; in Section 4, we present the experimental results; then the conclusions follow.
2 The P LAN C Model An effective response simulation in an urban environment requires a large number of actors, each with their own skills, objectives, behaviors and resources, to be able to coordinate their efforts in order to mitigate the outcome of a disaster. The complex interactions between the affected population and the available resources of a response plan have remained poorly understood, and are still beyond the analytical capability of traditional modeling tools. ABMs provides a natural way to describe such systems, where the global dynamics is the result of the behavior of populations of autonomous agents with a fixed set of rules based on local information. The modeling subgroup of the Laser-Med project of the NYU Center for Catastrophe Preparedness and Response (CCPR3 ) has explored how ABM can serve as a powerful simulation technique for analyzing large-scale urban disasters. The team effort in this direction has resulted in a new multi-agent based disaster simulation framework, built on top of the Java version of RePast 3.1 [8], able to model and simulate catastrophic scenarios (e.g., chemical agent, bomb explosion, food poisoning, small pox) with the following features: 1. Large number of agents, belonging to five different classes: Person, Hospital, On-Site Responder, Ambulance and Catastrophe; 2. Large number of parameters for describing the agents’ behavior and interaction; 3. Several communication channels for information (health / resource levels, hospital operation mode, etc.) exchange between similar and differing agents; 4. Modeling of the Person agent as a selfish and boundedly rational being, with stochastic personality traits emulating panic behavior; 3 http://www.nyu.edu/ccpr/
5. Realistic models of medical / responder units and Catastrophe agent effects (disease prognosis and dosage response), validated by medical, sociological and legal experts from the NYU CCPR; 6. Integration of topological and transportation constraints, via publicly available Geographic Information System (GIS) data of Manhattan island in New York City; 7. Computer software for parallel and distributed concurrent computing on large-scale clusters of workstations, using the integration between ProActive4 and RePast. A more detailed description of the system can be found in [6]. Parameters Table 1 shows the main model parameters and their possible ranges. Some of these capture the environment, e.g., the probability of being able to make a telephone call, but the major part influences the rules of behavior of the involved agents. These parameters are of different nature: some of them can be fixed in consultation with experts; for example, the number of hospitals, ambulances and on-site responders can be set according to the real situation in Manhattan. Others, however, must be kept variable due to the scarce knowledge about their real-world value or usage; for example, the “unsafe health level” is the health level at which a person chooses to head to a hospital; this parameter plays an important role in the dynamics of the system, especially in the distributed utilization of the available resources. According to the afore-mentioned considerations, we have chosen 10 controllable parameters from the list in Table 1 (marked with (∗) ) for use in the optimization process. Some of these parameters are involved in a linear ordering that should not be violated. In particular, we have the following relations: p1 < p6 < p7 , p2 < p7 , p9 < p8 . Note that the probability of having a communication device and the probability of being able to communicate using it are “controllable”, only in the sense that emergency preparedness can involve improving communication infrastructure. However, it is not always clear what the cost-tobenefit ratio is for this utility. The optimization procedure can help shed light on this issue. Warfare Attack Scenario As a simulation scenario, we consider a possible terrorist attack with a warfare agent, like Sarin gas, at the Port Authority Bus Terminal in the island of Manhattan. We consider an affected population of 500 individuals, 5 on-site responder units and 10 ambulances. The 28 major hospitals are also included, with their location and capacity initialized based on real data. The ambulances and on-site responders are activated 30 minutes after the attack, to capture the real delay between the 4 http://www-sop.inria.fr/oasis/proactive/
Table 1. Main model parameters. The starred ones (“(*)”) are being optimized. Agent Person Person Person Person, Ambulance On-site Responder Hospital Hospital Hospital Hospital Hospital Hospital, Ambulance, On-Site Responder Catastrophe User User
Description Critical health Level(∗) Unsafe health level(∗) Probability of having a communication device(∗) Phone update probability(∗)
Id. p1 p2 p3
Range [0, 1] [0, 1] [0, 1]
p4
[0, 1]
Dischargeable health level(∗) Noncritical health level(∗) Dischargeable health level(∗) Low resource level (%)(∗) Very low resource level (%)(∗) Low beds level (%)(∗) Alert time (in minutes)
p5 p6 p7 p8 p9 p10
[0, 1] [0, 1] [0, 1] [0, 100] [0, 100] [0, 100] [0, ∞]
Percentage of lethal, severe, light, injuries Maximum number of iterations Number of agents of each class
No. of Runs 1 5 10 50 100
[0, 100] [0, ∞] [0, ∞]
attack and the first emergency call. The probability distributions for lethal, severe and light injuries immediately following the attack are set at 0.1, 0.35, 0.40 and 0.15. respectively. Each model simulation is carried out for 1000 ticks, corresponding to the first 16 hours after the attack.
3 Emergency Response Planning as a Complex Constrained MOOP When an optimization problem involves more than one objective function, the task of finding one (or more) optimum solution(s), is known as the Multi-Objective Optimization Problem (MOOP). In problems characterized by more than one conflicting objective, there is no single optimum solution; instead there exists a set of solutions which are all optimal, called the Optimal Pareto front. A general multi-objective optimization problem is defined as follows (minimization case): min subject to
F (x) = [f1 (x), f2 (x), . . . , fM (x)] E(x) = [e1 (x), e2 (x), . . . , eL (x)] ≥ 0 (U) (L) xi ≤ xi ≤ xi , i = 1, . . . , N,
Table 2. Model stochasticity. % of Fatalities 11.53% 3.57% 1.14% 1.09% 0.26%
Avg. Ill-health 2% 0.87% 0.82% 0.19% 0.054%
Avg. Waiting Time 27.41% 8.21% 6.63% 1.84% 1.83%
people), fatalities (mortalities), the average ill-health of the total population, average waiting time at the hospitals, etc., and maximize the average time taken by a person to die (so as to increase the chance for external help to arrive), utilization of resources at different locations (so that no one location runs out of critical resources), etc. There are also tangible economic, legal and ethical issues in disaster management which could contribute a different class of objective functions. The P LAN C model produces as its output the individual traces of all its agents and statistical information about the time-course of the global behavior. In this paper, we have decided to investigate and analyze the three criteria presented in Table 2: the percentage of fatalities, average ill-health of the affected5 population (at the end of 16 hours) and the average waiting time at the hospitals (during the first 16 hours). The global behavior is the emergent interaction between the different classes of agents and available resources for the specific emergency scenario. Therefore the multi-objective formulation is defined as follows: the selected input parameters of the model are the decision variables, the criteria for plan evaluation are the objectives, the parameter ranges are the variable bounds, and the mutual relations between the set of parameters are the constraints. In particular, in this research paper we investigate the formulation of the problem as a two-objective optimization problem, where the percentage of fatalities is coupled first with the average ill-health and then with the average waiting time.
4 Methods (1)
where x = (x1 , x2 , . . . , xN ) is the vector of the N decision variables, M is the number of objectives fi , L is the num(U) (L) ber of constraints ej , and xi and xi are respectively the lower and upper bound for each decision variables xi . Two different solutions are compared using the concept of dominance, which induces a strict partial order in the objective space F . Here a solution a is said to dominate a solution b if it is better or equal in all objectives and better in at least one objective. For the minimization case we have: � fi (a) ≤ fi (b) ∀i ∈ 1, . . . , M F (a) ≺ F(b) iff ∃j ∈ 1, . . . , M fj (a) < fj (b) (2) A large scale emergency plan naturally involves multiple objectives: minimize the number of casualties (affected
Over the past ten years, a number of multi-objective evolutionary algorithms (MOEAs) have been proposed and studied [9]. The major reasons for the growing interest in such techniques is their ability: (i) to generate multiple Paretooptimal solutions in a single run of the algorithm, (ii) to handle a large search space, and (iii) to be robust to the effects of noise. Moreover, MOEAs have been successfully applied to several real world problems: protein folding [10], circuit design [11], safety related systems [12], etc. Among the growing class of MOEAs, in this work we employ two well-known algorithms, NSGA-II and PAES, and test their relative performance for the proposed problem. These two evolutionary algorithms were chosen because: (i) they are representative of the state-of-the-art in evolutionary multi-objective optimization, (ii) they belong to 5 Persons in perfect health (= 1.0) are excluded in the computation of this average.
two different classes of evolutionary algorithms – Genetic Algorithm (NSGA-II) and Evolution Strategy (PAES), and (iii) their software (code) is in the public domain. The Nondominated Sorting Genetic Algorithm II (NSGA-II) [13] is based on the use of fast nondominated sorting approach to sort a population of solutions into different nondomination levels. It then uses elitism and a crowded-comparison operator for diversity preservation. The Pareto Archived Evolution Strategy (PAES) [14] uses a simple (“1+1”) local search evolution strategy. It maintains an archive of nondominated solutions which it exploits to estimate accurately the quality of new candidate solutions. The goal of our work is to estimate the Pareto front of a large scale emergency response planning problem, using the P LAN C model for the simulation of the effectiveness of the candidate plan on the targeted catastrophic scenario (represented as a set of input parameters to the model), and multi-objective evolutionary algorithms to optimize the solutions according to the defined objectives or criteria. Identifying a good estimate of the observed Pareto front is crucial for the policy makers’ selection of a stable and robust plan satisfying the objectives. Of course, this approach cannot be used as a stand-alone technique, but must be combined with traditional table-top exercises (such as wargames), and can be used by domain experts to develop, test, evaluate and refine public health policies governing catastrophe preparedness and emergency response. Model Stochasticity In the P LAN C model the stochasticity is an important aspect that must be handled carefully: two different simulations can generally bring slightly different results even with the same initialization of parameters. It follows that one simulation is not enough to evaluate the fitness function, and can only be considered as an estimate of the fitness. In order to study the stochasticity of the P LAN C model, Table 2 shows the error rate in the estimation of the different analyzed objectives with respect to a “true” fitness value estimated on 1000 independent runs. As expected, the stochasticity is different for each objective / criteria: the number of fatalities and the average waiting time are more sensitive to the stochastic behavior than the average ill-health. As a good trade-off between the quality of the approximation and the computational cost, 10 runs are used for the fitness evaluation (based on Table 2). Constraint Handling Several constraint handling techniques have been proposed in recent years in order to ensure feasibility of constrained optimization. Following the ideas proposed in [15], we have also introduced the concept of a constraint objective: γco (x) =
L X
min{ei (x), 0},
(3)
i=1
The standard dominance relation ≺ of equation 2 is
redefined as follows: � γco (x1 ) < γco (x2 ) or b 2 iff x1 ≺x γco (x1 ) = γco (x2 ) and F (x1 ) ≺ F(x2 ), (4) where F is the set of objectives. In this way, the constraint objective has the highest priority and there is no necessity to check the feasibility of the solutions during the evolution of the algorithm. We have modified both NSGA-II and PAES dominance relation according to equation 4. Evolutionary Algorithm Parameters and Operators We use a real-valued representation for both algorithms. In particular, for NSGA-II we use the usual simulated binary crossover (SBX) and polynomial mutation, with probabilities and distribution indices being pc = 0.9, ηc = 10 and pm = N1 , ηm = 20 respectively. For PAES, the mutation operator selects a decision variable xi with probability pm = N1 and mutates it according to the following law: (L) (U) x∗i = xi + N (0, 0.1) × (xi − xi ). Here N (0, 0.1) is a real number generated by a Gaussian distribution of mean µ = 0 and standard deviation σ = 0.1. Experimental Protocol Both algorithms are run for a maximum of 4, 000 fitness function evaluations. For NSGA-II, we use a population of 40 individuals and run the algorithm for 100 generations. For PAES, we use an archive size a = 100, depth parameter d = 4, and run the algorithm for 4, 000 iterations. We use the final population of NSGA-II and the final archive of PAES to make comparative results. We must reiterate that, because of the model stochasticity, a single fitness function evaluation corresponds to running the model for 10 independent simulations and calculating the mean value as an estimate of the fitness. Thus, it follows that we have in all 40, 000 model simulations for each run of the algorithm. As introduced in section 2, in order to handle this big computational challenge, we use the ProActive library in order to run each of the simulations in a different node of the computational cluster at the NYU Bioinformatics Laboratory6. The production of a single Pareto front takes about 5 days in our cluster, but it is important to emphasize that this is an automatic procedure, in contrast to the standard calibration method performed by hand. Also, the computation of the Pareto front helps vividly elucidate the underlying dynamics, interaction complexities and emergent properties, in addition to actually optimizing the objective functions.
5 Simulation Results Before presenting comparative results between the Pareto fronts obtained by the two evolutionary algorithms, it is important to validate experimentally the proposed multiobjective approach. It is reasonable to imagine the presence of a trade-off, for example, between the number of 6 http://www.bioinformatics.nyu.edu
0.55
9.5 9 8.5 8
Average waiting time
0
20
40
60
80
7.5
90 80 70 60 50 40 30 20 10 0 100
0.5 0.45
6.5 0
20
40
60
80
60 50
0.4 0.35
0.25 Average ill-health
NSGA-II PAES
0.5
0.3
7
0.55
Average ill-health
Percentage of fatalities 8.8 8.6 8.4 8.2 8 7.8 7.6 7.4 7.2 7
Average waiting time
10
40
0.45 0.4 0.35 0.3 0.25 0.2
30
0.15
20
5.5
10
6
6.5 7 7.5 Percentage of fatalities
8
8.5
0 0.2 100
Iterations
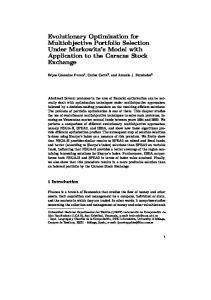
Figure 1. NSGA-II mean evolution curves for the twoobjectives problems studied. Left y-axis range is for percentage of fatalities (both plots), right y-axis range is for average ill-health (main plot) and average waiting time (inset plot).
fatalities and the average ill-health of the population at the and of a response plan. However, trying to characterize the dynamics of all the involved agents in a complex system often results in partial differential equations that are difficult, if not impossible, to solve. This process becomes even more perplexing when the agents are mobile and embedded in a highly interconnected environment such as an urban area. Studying the dynamics of the objectives during the iterations of an evolutionary algorithm can provide insight about their mutual interactions. Figure 1 shows the mean evolution curves of the population of NSGA-II for the two pairs of objectives analyzed. In both cases, a conflict scenario is evident: an improvement of one objective is nearly always accompanied by a worsening in the other, but the interaction during the evolution produces a global minimization of both objectives. This effect is more evident in the main plot of Figure 1, where the percentage of fatalities is plotted against the average ill-health, than in the case of the average waiting time (inset plot of Figure 1). Figure 2 shows the final Pareto fronts obtained by NSGA-II and PAES for the percentage of fatalities and the average ill-health. It is evident that NSGA-II generates a better set of solutions than PAES, both in terms of the quality and the spread. Although we used an archive size of 100 elements for PAES, the final set is composed of only 15 solutions. This suggests that PAES is not able to maintain a good level of diversity in the archive and that it was probably trapped in a local minimum. In the other scenario of Figure 2, although PAES finds slightly better solutions then NSGA-II, the final set is again composed of only 11 solutions. Moreover, all these solutions are spread along the percentage of fatalities axis, in contrast with NSGA-II that produces additional solutions with low percentage of fatalities along the average waiting time axis.
5.5
6
6.5 7 7.5 8 Percentage of fatalities
8.5
9
Figure 2. Comparison between the final Pareto fronts obtained by NSGA-II and PAES, using the two-objectives problems studied.
Understanding the Results Consider the case where we want to study the influence of the “unsafe health level” and the “low resource level” on the three objectives. The “unsafe health level” parameter was introduced in section 2. The “low resource level” parameter is the level below which a hospital changes its mode of operation from “available” to “critical” (so that only critically ill persons are admitted henceforth). The standard approach is to explore in a systematic way the parameter space generated by their possible ranges. If we use 30 uniformly distributed points for each range, we have a Cartesian product of 900 pairs to be evaluated. Using 10 simulations for each one, this requires 9, 000 model simulations in total only for two parameters (with three parameters the computation starts to become unpractical: 27, 000 model simulations). By following this brute-force approach, the minimum percentage of fatalities obtained was 8.54 using an unsafe health level of 0.33 and a low resource level of 96%, but resulted in an average waiting time at the hospital of 187 minutes. Using the proposed multi-objective approach, we found it much easier to find a better solution that minimized the average waiting time at the hospital (see Figure 2) also. For example, one such solution produced 6.2% of fatalities with a waiting time at the hospital of only 15 minutes, using an unsafe health level of 0.13 and a low resource level of 28. The practical interpretation of these numbers is that people are suggested to go to the hospital as soon as possible and the hospital should work in critical mode only when its resources are below 28%. This behavior is facilitated by a specific combined setting of all the other parameters, as discovered by the genetic algorithmic search. For example, the dischargeable health level for the hospital is set to 0.2, meaning that the patients are discharged even if they are still sick, because they have a high chance to survive with the short treatment received. This particular global dynamic is the result of the simultaneous multi-objective optimization of all the model parameters, which permits the study of their mutual inter-
actions in a reasonable amount of computational time.
0.6 0.55 0.5
Robustness of the Front In the stochastic environment produced by the agent-based model simulator, finding a good set of solutions is not the only aim of the multi-objective optimization process. A good emergency plan should be also robust against environmental changes and should still work satisfactorily even if the behaviors of the involved agents slightly change from the optimal plan. This should be one of the selection criteria for selecting solutions from the generated Pareto front. The correct approach is to directly generate a robust Pareto front. The idea is to use an expected fitness function based on the probability distribution p(δ) of the possible perturbation δ. Usually the expected fitness function is calculated by averaging over a number of randomly sampled points f (x + δ). The drawback of this approach is that it precipitously worsens the computational complexity of the algorithm, and thus cannot be applied to realworld problems where the calculation of the fitness function is particularly expensive. A more practical solution is to use robustness analysis as a post-processing phase in order to study the solutions in the final Pareto front. Both environmental and behavioral changes can be simulated in the model by introducing small variations to the input parameters. In particular, for each set of input parameters x = (x1 , . . . , xj , . . . , xN ) in the Pareto set, we generate M = 100 random neighbors using the following rule for each decision variable xj : xj = u(xj − δ, xj + δ), j = 1, 2, . . . , N (L) (U) where δ = α × (xj − xj )
(5)
where u(a, b) is a uniform random number generated in the range [a, b] and α is a parameter that controls the extent of the desired robustness. We observe that in order to evaluate the neighbors, we again have to use an averaged fitness estimation over 10 simulations, so that 1000 model simulations are required to evaluate the robustness of each point on the Pareto front. Figure 3 shows the robustness of the Pareto front obtained by NSGA-II for the percentage of fatalities, against the average ill-heath using α = 0.1. The two error-bars indicate the standard deviations with respect to each objective produced by the 100 generated neighbors (in the parameter space) of each point. Of course, solutions with lower standard deviation should be preferred, but this information must be combined with additional higher-level knowledge that can be extracted, for example, by running the P LAN C model and analyzing the emergent dynamics produced by the selected solutions.
6 Conclusion and Future Work In this paper, we have proposed a constrained multiobjective formulation of the problem of finding “good”
Average ill-health
0.45 0.4 0.35 0.3 0.25 0.2 0.15 0.1 5.5
6
6.5
7 7.5 Percentage of fatalities
8
8.5
9
Figure 3. Robustness of the Pareto front: the error-bars indicate the standard deviations relative to the two objectives of the 100 neighbors generated using equation 5 with α = 0.1.
emergency response plans, using the agent-based modeling technology for scenario simulation and evolutionary algorithms to obtain approximated Pareto fronts. The experimental results have shown that the disaster management problem indeed presents the characteristics of a multi-objective optimization problem, and that the estimated Pareto fronts of optimal solutions can be effectively produced at reasonable computational expense. We have employed two well known MOEAs: namely, NSGA-II and PAES. Our empirical observations seem to suggest that NSGA-II demonstrates a better behavior for the twoobjective problems we have studied. However, more rigorous theoretical developments and practical verifications are necessary to further evaluate their relative merit. Also, we have introduced a simple technique to test the robustness of the solutions in the front. This is intended to be used in addition to other higher-level expert knowledge to choose between solutions from the Pareto set. Most importantly, the developed approach is completely general and can be applied to any agent-based model. Its applications are likely to be most beneficial in models involving societies of agents with probabilistic and stochastic rules of behavior, and whose global dynamic must be evaluated by different and conflicting objectives. Several possible future lines of investigation can be followed: (1) Studying the performance and scalability of the proposed algorithms using 3 or more objective at the same time. (2) Introducing the robustness search directly inside the evolutionary algorithm, with minimal increase to its computational complexity (e.g., using the information already available within the population). (3) Using the stochastic properties of the fitness function evaluations to guide the selection / creation of the next generation of solutions (e.g., the same point may be treated as two different points corresponding to its extreme fitness function evaluations). (4) Using the stochastic variations as a measure
of robustness during the computation of the next generation. (5) Using the running mean and standard deviation to dynamically decide the number of simulations necessary to statistically validate the fitness function evaluation (e.g., if the first 3 runs do not produce significant variations, it may not be necessary to perform all the 10 runs.). The combined use of the agent-based modeling paradigm, multi-objective optimization and statistical analysis, offers a promising way to study, understand and analyze the dynamics of a complex system and, in this specific case, how to plan a large-scale urban emergency response.
Acknowledgments We would like to acknowledge the funding support from Department of Homeland Security Grant # 2204-GT-TX0001. We also would like to thanks Lewis Nelson, Dianne Rekow, Marc Triola, Liza Halcomb and Ian Portelli for the clinical aspects of the study design and development of the P LAN C model.
References [1] PNAS. Adaptive Agents, Intelligence, and Emergent Human Organization: Capturing Complexity through Agent-Based Modeling, volume 99(3). May 2002. [2] Sven Brueckner and H. Van Dyke Parunak. Resourceaware exploration of the emergent dynamics of simulated systems. In AAMAS, pages 781–788, 2003. [3] Benoˆıt Calvez and Guillaume Hutzler. Automatic tuning of agent-based models using genetic algorithms. In MABS, pages 41–57, 2005. [4] A. Rogers and P. von Tessin. Multi-objective calibration for agent-based models. In 5th Workshop on Agent-Based Simulation, 2004. [5] V. Mysore, O. Gill, R.S. Daruwala, M. Antoniotti, V. Saraswat, and B. Mishra. Multi-agent modeling and analysis of the brazilian food-poisoning scenario. In The Agent 2005 Conference on Generative Social Processes, Models and Mechanisms, Chicago, 2005. [6] V. Mysore, G. Narzisi, L. Nelson, D. Rekow, M. Triola, A. Shapiro, C. Coleman, O. Gill, R.S. Daruwala, and B Mishra. Agent modeling of a sarin attack in manhattan. In Proceedings of the First International Workshop on Agent Technology for Disaster Management, ATDM, pages 108–115, 2006. [7] G. Narzisi, V. Mysore, L. Nelson, D. Rekow, M. Triola, L. Halcomb, I. Portelli, and B. Mishra. Complexities, catastrophes and cities: Unraveling emergency dynamics. International Conference on Complex Systems (ICCS), 2006.
[8] M.J. North, N.T. Collier, and J.R. Vos. Experiences creating three implementations of the repast agent modeling toolkit. ACM Transactions on Modeling and Computer Simulation, 16(1):1–25, 2006. [9] Kalyanmoy Deb. Multi-Objective Optimization Using Evolutionary Algorithms. John Wiley & Sons, Inc., New York, NY, USA, 2001. [10] Vincenzo Cutello, Giuseppe Narzisi, and Giuseppe Nicosia. A multi-objective evolutionary approach to the protein structure prediction problem. Journal of The Royal Society Interface, 3(6):139–151, February 2006. [11] T. Biondi, A. Ciccazzo, V. Cutello, S. D’Antona, G. Nicosia, and S. Spinella. Multi-objective evolutionary algorithms and pattern search methods for circuit design problems. Journal of Universal Computer Science, 12(4):432–449, 2006. [12] R.M. Everson and J.E. Fieldsend. Multiobjective optimization of safety related systems: An application to short-term conflict alert. Evolutionary Computation, IEEE Transactions on, 10(2):187–198, April 2006. [13] Kalyanmoy Deb, Samir Agrawal, Amrit Pratap, and T. Meyarivan. A fast and elitist multiobjective genetic algorithm: Nsga-II. IEEE Trans. Evolutionary Computation, 6(2):182–197, 2002. [14] Joshua D. Knowles and David W. Corne. Approximating the nondominated front using the pareto archived evolution strategy. Evol. Comput., 8(2):149– 172, 2000. [15] Zeng SY, Kang LS, and Ding LX. An orthogonal multi-objective evolutionary algorithm for multiobjective optimization problems with constraints. Evolutionary computation, 12(1):77–98, 2004.