American Journal of Applied Mathematics and Statistics, 2013, Vol. 1, No. 6, 110-116 Available online at http://pubs.sciepub.com/ajams/1/6/1 © Science and Education Publishing DOI:10.12691/ajams-1-6-1
Multi-Objective Optimization Firefly Algorithm Applied to (Bio)Chemical Engineering System Design Fran Sérgio Lobato1, Jr Valder Steffen2,* 1
School of Chemical Engineering, Federal University of Uberlândia, Uberlândia, Brazil School of Mechanical Engineering, Federal University of Uberlândia, Uberlândia, Brazil *Corresponding author:
[email protected]
2
Received April 13, 2013; Revised May 06, 2013; Accepted November 19, 2013
Abstract Modern engineering problems are often composed by objectives that must be taken into account simultaneously for better design performance. Normally, these objectives are conflicting, i.e., an improvement in one of them does not lead, necessarily, to better results for the other ones. To overcome this difficulty, many methods to solve multi-objective optimization problems (MOP) have been proposed. The MOP solution, unlike the single objective problems, is given by a set of non-dominated solutions that form the Pareto Curve, also known as Pareto Optimal. Among the MOP algorithms, we can cite the Firefly Algorithm (FA). FA is a bio-inspired method that mimics the patterns of short and rhythmic flashes emitted by fireflies in order to attract other individuals to their vicinities. For illustration purposes, in the present contribution the FA, associated with the Pareto dominance criterion and the anti-stagnation operator, is applied to (bio)chemical engineering system design. The first one is related to the alkylation process optimization; the second deals with the optimization of batch stirred tank reactor. The sensitivity analysis of some relevant parameters of the algorithm is performed and compared with the Nondominated Sorting Genetic Algorithm (NSGA II). The results indicate that the proposed approach characterizes an interesting alternative for multi-objective optimization design.
Keywords: multi-objective optimization, firefly algorithm, (Bio)chemical engineering system design Cite This Article: Fran Sérgio Lobato, and Jr Valder Steffen, “Multi-Objective Optimization Firefly Algorithm Applied to (Bio)Chemical Engineering System Design.” American Journal of Applied Mathematics and Statistics 1, no. 6 (2013): 110-116. doi: 10.12691/ajams-1-6-1.
1. Introduction Real-world design problems involve the simultaneous optimization of two or more often conflicting objectives, called Multi-objective Optimization Problems (MOP). The solution of such problems is different from the singleobjective optimization. The main difference is that MOP normally has not only one but a set of solutions, which must be equally satisfactory [1]. Traditionally, the treatment of such problems is done by transforming the original MOP into a scalar singleobjective problem [2]. These techniques follow the preference-based approach in which a relative preference vector is used to rank multiple objectives. Classical searching and optimization methods use a point-to-point approach in which the solution is successively modified so that the outcome of these classical optimization methods is a single optimized solution. To overcome this disadvantage, meta-heuristic algorithms can find multiple optimal solutions in one single simulation run due to their population-based search approach. Thus, these approaches are ideally suited for multi-objective optimization problems [3,4]. In this context, nature-inspired meta-heuristic algorithms together with up to date digital computation are
becoming very powerful to solve modern global optimization problems in various áreas of Engineering and sciences. However, it is important to observe that, when these algorithms loses diversity, a sub-optimal solution, characterized by premature convergence, is found instead [2,5]. Among various nature-inspired meta-heuristic algorithms to obtain MOP solutions, we can cite the Firefly Algorithm (FA), which is a bio-inspired method that mimics the patterns of short and rhythmic flashes emitted by fireflies in order to attract other individuals to its vicinities [6]. Thus, in the present contribution, the FA associated with the Pareto dominance criterion, and crowding distance operator are applied to chemical engineering system design. This work is presented as follows. Sections 2 and 3 show the basic concepts of MOP and FA. In Section 4 and Section 5 the proposed methodology is introduced and two (bio)chemical engineering case studies are presented. Finally, the conclusions are outlined in Section 6.
2. Multi-Objective Optimization When dealing with MOP, the notion of optimality needs to be extended. The most commonly used idea for optimality found in the current literature is the one that
American Journal of Applied Mathematics and Statistics
was originally proposed by Edgeworth [7], and later generalized by Pareto [8]. This notion is known as Edgeworth-Pareto optimality, or simply Pareto optimality, and refers to finding good tradeoffs among all the objectives. This definition leads to finding a set of solutions that is called the Pareto optimal set, whose corresponding elements are called non-dominated or noninferior. The concept of optimality in the context of single objective problems is not directly applicable to MOPs. For this reason a classification of the solutions is introduced in terms of Pareto optimality, according to the following definitions [2]: Definition 1 - The MOP is defined as:
min f ( x) = { f1 ( x), f 2 ( x),..., f M ( x),}
(1)
subject to
H= ( x)
( x) {H1=
}
G ( x) =
{G1 ( x) ≤ 0,..., G j ( x) ≤ 0} , k =
0,..., H j= ( x) 0= , j 1,.., J 1,.., K
(2) (3)
where x is the vector of design (or decision) variables and f is the vector of objective functions. The constraints H and G determine the feasible region. Definition 2 - Pareto Dominance: For any two decision vectors v1 and v2, v1 is said to dominate v2 if v1 is not worse than v2 in all objectives and v1 is strictly better than v2 in at least one of the objectives. Definition 3 - Pareto Optimality: When the set Γ is the entire search space, or Γ = Λ, the resulting non-dominated set Γ’ is called the Pareto-optimal set. Like global and local optimal solutions in the case of single-objective optimization, there could be global and local Paretooptimal sets in multi-objective optimization. Definition 4 - Non-dominated Set: Among a set of solutions Γ, the non-dominated set of solutions Γ’ contains the solutions that are not dominated by any member of the set Γ.
3. Firefly Algorithm Nature-inspired metaheuristic algorithms are becoming powerful in solving modern global optimization problems, especially in the case of complex nonlinear optimization problems. The search strategies in these multi-agent algorithms are controlled randomization, efficient local search and selection of the best solutions. However, the randomization typically uses uniform distribution or Gaussian distribution [9]. The FA is based on the characteristic of the bioluminescence of fireflies, insects notorious for their light emission. According to Yang [6], biology does not have a complete knowledge to determine all the utilities that firefly luminescence can bring to, but at least three functions have been identified: (i) as a communication tool and appeal to potential partners in reproduction, (ii) as a bait to lure potential prey for the firefly, (iii) as a warning mechanism for potential predators reminding them that fireflies have a bitter taste. The bioluminescent signals are known to serve as elements of courtship rituals - in most cases, the females are attracted by the light emitted by the males, methods of
111
prey attraction, social orientation or as a warning signal to predators, as previously mentioned [10]. Some of the flashing characteristics of fireflies were idealized so as to develop firefly-inspired algorithms. For simplicity, the following three idealized rules are used [9]: all fireflies are unisex, so that one firefly will be attracted to other fireflies regardless of their sex; attractiveness is proportional to their brightness, thus for any two flashing fireflies, the less brighter will move towards the brighter one. The attractiveness is proportional to the brightness and they both decrease as their distance increases. If there is no brighter than a particular firefly, it will move randomly; the brightness of a firefly is affected or determined by the landscape of the objective function. For a maximization problem, the brightness can simply be proportional to the value of the objective function. According to Yang [6], in the firefly algorithm, there are two important issues: the variation of light intensity and formulation of the attractiveness. For simplicity, it is always assumed that the attractiveness of a firefly is determined by its brightness which in turn is associated with the encoded objective function. This swarm intelligence optimization technique is based on social behavior of fireflies. Consequently each brighter firefly attracts its partners (regardless of their sex), which makes the search space being explored more efficiently. The algorithm makes use of a synergic local search. Each member of the swarm explores the problem space by taking into account results obtained by others, still applying its own randomized moves as well. The influence of other solutions is controlled by the value of the attractiveness [10]. According to Lukasik and Zak [10], the FA is presented as follows. Consider a continuous constrained optimization problem where the task is to minimize the cost function f(x), i.e., find x*. Assume that there exists a swarm of m agents (fireflies) solving above mentioned problem iteratively and xi represents a solution for a firefly i in algorithm’s iteration k, whereas f(xi) denotes its cost. Initially, all fireflies are dislocated in S (randomly or employing some deterministic strategy). Each firefly has its distinctive attractiveness β which implies how strong it attracts other members of the swarm. As the firefly attractiveness one should select any monotonically decreasing function of the distance rj=d(xi,xj) to the chosen firefly j, i.e., the exponential function:
β = β0 e
−γ r j
(4)
where β0 and γ are predetermined algorithm parameters: maximum attractiveness value and absorption coefficient, respectively. Furthermore, every member of the swarm is characterized by its light intensity Ii which can be directly expressed as an inverse of a cost function f(xi).To effectively explore the considered search space S, it is assumed that each firefly i is changing its position iteratively by taking into account one factor: attractiveness of other swarm members with higher light intensity, i.e., Ij >Ii, j=1,..,N and j≠i. It should be noted as well that if no brighter firefly can be found only such randomized step is used. Thus, moving at a given time step t of a firefly i toward a better firefly j is defined as:
112
American Journal of Applied Mathematics and Statistics
(
)
1 xit =xit −1 + β xtj−1 − xit −1 + α rand − 2
(5)
where the second term on the right side of the equation inserts the factor of attractiveness, β, while the third term, governed by the parameter α, is responsible for the insertion of certain randomness in the path followed by the firefly, and rand is a random number between 0 and 1 [11]. In the literature, few works using the FA can be found: continuous constrained optimization task [10] multimodal optimization [12], solution of singular optimal control problems [13] and load dispatch problem [14].
4. Multi-Objective Optimization Firefly Algorithm Due to success obtained by the FA in different science and engineering applications, their extension to the multiobjective context is desirable. In the present work, the Multi-objective Optimization Firefly Algorithm (MOFA) is proposed. This approach is based on the classical FA associated with Fast Non-Dominated Sorting technique, according to the following architecture: ● An initial population of size N is randomly generated; ● All dominated solutions are removed from the population through the operator Fast Non-Dominated Sorting. In this way, the population is sorted into nondominated fronts μj (sets of vectors that are nondominated with respect to each other) [2,15]; ● Following, FA is applied to generate the new population of fireflies (potential candidates to solve the MOP); ● If the number of individuals of the population is larger than a number defined by the user, it is truncated according to the criterion named the Crowding Distance [2]; ● It is important to emphasize that in any evolutionary approach there is the possibility of the population to stagnate at a point that does not correspond to the global optimum. To increase the chance of the MOFA to avoid this situation, an anti-stagnation operator was coupled to the original algorithm. The steps presented are repeated until a given stopping criterion is reached. The operators used in the MOFA are described below.
4.1. Fast Non-Dominated Sorting In order to sort a population of size N according to the level of non-domination, each solution is compared with every other solution in the population to find if it is dominated. This requires MN (order) comparisons for each solution, where M is the number of objectives. When this process is continued to find the members of the first nondominated class for all population members, the total complexity is (MN2) (order). At this point, all individuals in the first non-dominated front are found. To find the individuals belonging to the next front, the solutions of the first front are temporarily discounted and the above procedure is repeated. In the worst case, the finding task of the second front also requires (MN2) (order)
computations. The procedure is repeated to find the subsequent fronts [15].
4.2. Crowding Distance Operator This operator describes the density of solutions surrounding a vector. To compute the Crowding Distance for a set of population members the vectors are sorted according to their objective function values. To the vectors with the smallest or largest values, an infinite Crowding Distance (or an arbitrarily large number for practical purposes) is assigned. For all other vectors, the Crowding Distance (distxi) is calculated according to [2,15]: M
f j ,i +1 − f j ,i −1
j =1
f j ,max − f j ,min
dist xi = ∑
(6)
where fj corresponds to the j-th objective function.
4.3. Treatment of Constraints In this work the treatment of constraints is made through the Static Penalization Method, proposed by Castro [16]. This approach consists in assigning limit values to each objective function to play the role of penalization parameters. According to Castro [16], it is guaranteed that any non-dominated solution dominates any solution that violates at least one of the constraints. In the same way, any solution that violates only one constraint will dominate any solution that presents two constraint violations, and so on. For a constrained problem the vector containing the objective functions to be accounted for is given by:
f ( x) ≡ f ( x) + rp nviol
(7)
where f(x) it is the vector of objective functions, rp it is the vector of penalty parameters that depends on the type of problem considered, and nviol is the number of violated constraints.
5. Results and Discussion To evaluate the performance of the MOFA two classical (bio) chemical engineering system are considered in this section. The first one is related to the alkylation process optimization; the second deals with the optimization of a batch stirred tank reactor. Parameters used for the MOFA: population size equal to 50, maximum number of iterations equal to 200, maximum attractiveness value and absorption coefficient both equal to 0.9. The stopping criterion used was the maximum number of iterations. Parameters used for the NSGA II: population size equal to 50, maximum number of iterations equal to 200, crossover probability equal to 0.8 and mutation probability equal to 0.01. In this analysis, three combination of parameters are considered: the maximum attractiveness (β0) [0.5 0.8 1.0], the absorption coefficient (γ) [0.5 0.8 1.0] and the random perturbation rate (α) [0.2 0.5 0.8]. Other parameters used: population size equal to 50, maximum number of iterations equal to 200 and the stopping criterion used was the maximum number of iterations.
American Journal of Applied Mathematics and Statistics
113
5.1. Alkylation Process Optimization
0 ≤ x1 ≤ 2000
(16)
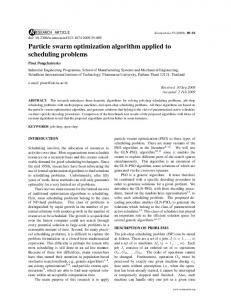
The alkylation process, wherein a light olefin such as propene, butene or pentene reacts with isobutane in the presence of a strong sulfuric acid catalyst to produce the alkylate product (2,2,4 tri-methyl pentane from butene and isobutane) is an important process in petroleum refining. The alkylate product is used for blending with refinery products such as gasoline and aviation fuel. Figure 1 shows a simplified process flow diagram of the alkylation process [17].
90 ≤ x7 ≤ 95
(17)
3 ≤ x8 ≤ 12
(18)
where x1 is olefin feed (barrels/day), x2 is isobutane recycle (barrels/day), x3 is acid addition rate (thousand pounds/day), x4 is alkylate production rate (barrels/day), x5 is isobutane feed (barrels/day), x6 is spent acid strength (weight percent), x7 is octane number, x8 is isobutane to olefin ratio, x9 is acid dilution factor, and x10 is F-4 performance number. Table 1 shows the effects of parameters β0, γ and α in objectives, maximization of profit and maximization of x7 for case A. Table 1. Effects of MOFA parameters for case A Parameters Profit ($/day) x7 β0 γ α
The process has a reactor with olefin feed; isobutene makeup and isobutane recycle as the inlet streams. Fresh acid is added to catalyze the reaction and spent acid is withdrawn. The exothermic reactions between olefins and isobutane occur at around room temperature, and excess isobutane is used. The hydrocarbon outlet stream from the reactor is fed into a fractionator from where isobutane is recovered at the top and recycled back to the rector, and the alkylate product is withdrawn from the bottom. In the literature, various works lead with the solution of mono-objective problem, i.e., to maximize the profit [18,19,20] and multiple objectives [21]. In this work two problems are considered [17,18]: Case A (maximize profit and maximize octane number, x7) and Case B (maximize profit and minimize isobutane recycle, x2). As mentioned by Rangaiah [17], the alkylate product with a higher octane number is better for blending with refinery products. On the ohter hand, minimizing isobutane recycling helps to reduce fractionation and other costs associated with the recycle stream. The profit is defined as [17]
− 0.006667 x82 )) ≤ 5000
(10)
0 ≤ ( x2 ≡ x1 x8 − x5 ) ≤ 16000
(11)
+ 1.098 x8 − 0.038 x28 )) / 0.325) ≤ 93
94.99
1162.00
94.18
0.8
0.5
0.2
1095.47
94.99
0.8
0.5
0.5
1162.00
94.82
1.0
1.0
0.8
1162.04
94.99
In this table is possible to observe that in terms of the octane number, the similar values are obtained with the parameters presented. In terms of the profit, high values to β0, γ and α lead with best values of this objective. Figure 2 present the Pareto Curve solutions obtained by NSGA II and MOFA algorithms. Figures 3 and 4 presents the olefin feed versus profit profile and octane number versus profit profile, respectively. 95.0 94.9 94.8 94.7 94.6 MOFA 94.5 NSGA II 94.4 94.3 94.2 1090 1100 1110 1120 1130 1140 1150 1160
Profit ($/day) Figure 2. Pareto Curve for the alkylation process for case A (β0=1.0, γ=1.0, α=0.8)
(9)
0 ≤ ( x5 ≡ 1.22 x4 − x1 ) ≤ 2000
85 ≤ (x6 ≡ 89+(x7 − (86.35 +
1095.47
0.2
(8)
In both cases, the optimization problem considered is subject to following constraints
0 ≤ (x4 ≡ x1 (1.12 + 0.13167 x8
0.2
0.5
(12)
145 ≤ ( x10 ≡ −133 + 3 x7 ) ≤ 162
(13)
1.2 ≤ ( x9 ≡ 35.82 − 0.222 x10 ) ≤ 4
(14)
0 ≤ (x3 ≡ 0.001( x4 x6 x9 ) / (98 − x6 )) ≤ 120
(15)
x1 (barrels/day)
0.063 x4 x7 − 5.04 x1 − 0.035 x2 − 10 x3 − 3.36 x5
0.5
0.8
x7
Figure 1. Simplified schematic of the alkylation process
0.5
1170 1160 1150 1140 1130 1120 1110 1100 1090 1080 1680
MOFA NSGA II
1690
1700
1710
1720
1730
Profit ($/day) Figure 3. Olefin feed versus profit for the alkylation process for case A (β0=1.0, γ=1.0, α=0.8)
114
American Journal of Applied Mathematics and Statistics
In these figures it is important to observe that by increasing profit from 1080 to 1106 $/day is accompanied by x7 decreasing from 95 to 94.1. Thus, the two objectives, profit and x7 are contradictory leading to the optimal Pareto Curve in Figure 2.
with profit. Further, the optimal values of the decision variables in Case B are generally different from those found for Case A. 1750 1700
10.60
1650
MOFA NSGA II
x8
10.55 10.50 10.45
x1 (barrels/day)
10.65
1600 1550 1500
MOFA NSGA II
1450 1400 1350
10.40
920 960 1000 1040 1080 1120 1160
Profit ($/day)
1090 1100 1110 1120 1130 1140 1150 1160
Profit ($/day) Figure 4. Octane number versus profit for the alkylation process for case A (β0=1.0, γ=1.0, α=0.8)
Figure 6. Olefin feed versus profit for the alkylation process for case B (β0=1.0, γ=1.0, α=0.8)
Table 2 shows the effects of parameters β0, γ and α in the objectives (maximization of profit and minimization of x2 for case B). In this table we can observe that high values of β0, γ and α lead to the best solutions for the present problem.
94.6 94.4 94.2
x7 Table 2. Effects of MOFA parameters for case B Parameters Profit ($/day) x2 (barrels/day) β0 γ α 0.5
0.5
0.2
1161.70
15992.04
0.8
0.5
0.2
1161.81
15995.21
0.8
0.5
0.2
1161.60
15996.94
0.8
0.5
0.5
1161.82
15996.94
1.0
1.0
0.8
1161.82
15996.94
x2 (barrels/day)
Figure 5 presents the Pareto Curve solutions obtained by the algorithms NSGA II and MOFA. Figures 6 and 7 present the olefin feed versus profit profile and octane number versus profit profile, respectively. 16000 15500 15000 14500 14000 13500 13000 12500 12000
MOFA NSGA II
MOFA NSGA II
94.0 93.8 93.6 93.4 93.2 93.0
900
950
1000
1050
1100
1150
Profit ($/day) Figure 7. Octane number versus profit for the alkylation process for case B (β0=1.0, γ=1.0, α=0.8)
5.2. Batch Stirred Tank Reactor This case considers the maximization of the overall production rate and the final concentration of gluconic acid in the production process of fermentation of glucose to gluconic acid by the micro-organism Pseudomonas ovalis in a batch stirred tank reactor [17,22]. The overall biochemical reaction can be expressed as:
Cells + Glucose + Oxygen → More cells Glucose + Oxygen → Gluconolactone Gluconolactone + Water → Gluconic Acid
900
950 1000 1050 1100 1150 1200
Profit ($/day) Figure 5. Pareto Curve for the alkylation process for case B (β0=1.0, γ=1.0, α=0.8)
In these figures, the optimal profit increases from about 900 to 1200$/day as x2 increases from 12000 to 16000 barrels/day. As observed in Case A, the two objectives are contradictory. In Case B, all decision variables contribute to the optimal Pareto front and none of them is constant over the range of profit shown in these figures. Interestingly, both olefin feed and octane number increase
Mathematically, this process can be modeled in terms of the concentrations of cells (X), gluconic acid (P), gluconolactone (l), glucose substrate (S) and dissolved oxygen (C) [22]:
dX SC X = µm dt k S C + k0 S + SC
(19)
dP = kPl dt
(20)
dl S = vl X − 0.9k P l dt kl + S
(21)
American Journal of Applied Mathematics and Statistics
dS 1 SC = − µm X dt Y0 k S C + k0 S + SC S − 1.011vl X kl + S dC = K L a ( C1 − C ) dt 1 SC − µm X+ Y0 k S C + k0 S + SC − 0.09vl
(22)
115
productivity, due to the longer batch fermentation time that would be required.
(23)
S X kl + S
with initial conditions X(0)=X0, P(0)=0, l(0)=0, S(0)=S0, C(0)=C1. The symbols and constants are defined in Table 3 [23].
In this work, the following objectives are simultaneously considered: to maximize the overall productivity of gluconic acid, as defined by the ratio of the final gluconic acid concentration over the duration of the batch (P(tf)/tf), and to maximize the final gluconic acid concentration (P(tf)) [17]. The four decision variables are the duration of the batch fermentation (tf) ∈ [5-15h], the initial substrate concentration (S0) ∈ [20-50g/L], the overall oxygen mass transfer coefficient (KLa) ∈ [50300h-1], and the initial biomass concentration (X0) ∈ [0.05-1.0UOD/mL]. In order to solve the simulation problem, the Runge-Kutta 5th order Method (RK5th) is used. The computational scheme for solving the optimization problem consists first in defining the design variables and the MOFA parameters. For each evaluation of the objective function a system of ordinary differential equations (simulation problem) is solved by using the RK5th. Figure 8 illustrates this procedure. Table 4 shows the effects of the parameters β0, γ and α in the objective functions maximization of P(tf)/tf and maximization of P(tf). In this table it is possible to observe that, in terms of overall productivity of gluconic acid (P(tf)/tf) and final gluconic acid concentration (P(tf)), the values used for β0, γ and α lead with similar values for each objective function. Figure 9 present the Pareto Curve solutions obtained by the algorithms NSGA II and MOFA. In this figure, it is important to observe the good compromise solution found for the two objectives. As presented in Figure 9 and mentioned by Rangaiah [17], the objectives seeking to maximize P(tf)/tf and P(tf) are contradictory: by increasing the latter (total production of gluconic acid in a batch) generally results in a lower
Figure 8. Flow chart for the proposed procedure
β0 0.5 0.8 0.8 0.8 1.0
Table 4. Effects of MOFA parameters Parameters P(tf)/tf (gh-1/L)/P(tf) (g/L) γ α 0.5 0.2 3.467/51.952 6.863/35.702 0.5 0.2 3.461/51.950 6.850/35.701 0.5 0.2 3.455/51.959 6.855/35.702 0.5 0.5 3.467/51.949 6.861/35.698 1.0 0.8 3.467/51.954 6.860/35.702
P(tf) (g/L)
Table 3. Values of the parameters for the simulation of gluconic acid production Parameter Value Unit μm 0.39 h-1 kS 2.50 g/L k0 0.00055 g/L kP 0.645 h-1 vl 8.30 mg/UOD h kl 12.80 g/L Ys 0.375 UOD/mg Y0 0.890 UOD/mg C1 0.00685 g/L
52 50 48 46 44 42 40 38 36 34
MOFA NSGA II
3.5
4.0
4.5
5.0
5.5
6.0
6.5
7.0
P(tf)/tf (gh-1/L) Figure 9. Pareto Curve for the batch stirred tank reactor (β0=1.0, γ=1.0, α=0.8)
Figure 10 Figure 11, Figure 12 presents the initial substrate concentration, the overall oxygen mass transfer coefficient and the initial biomass concentration versus the overall productivity of gluconic acid, respectively. These figures shows that the initial substrate concentration is around 50g/L, the overall oxygen mass transfer coefficient increasing from 60 to 300h-1, and the initial biomass concentration is around 0.995 UOD/mL.
6. Conclusions In this contribution, a new algorithm is presented for dealing with multi-objective optimization problems. The methodology consists in the extension of the Firefly Algorithm to problems with multiple objectives, through the incorporation of special operators to the original algorithm, namely the mechanisms of rank ordering and crowding distance. The proposed algorithm was applied to (bio)chemical engineering system design. The results lead to the conclusion that the Multi-objective Optimization Firefly
116
American Journal of Applied Mathematics and Statistics
Algorithm presented better results as compared with those found in the literature by using the same number of objective function evaluations as considered by the Nondominated Sorting Genetic Algorithm II (50+50×200). Finally, the results presented are very encouraging and the approach developed for the solution of the inverse problem deserves further investigation regarding its application to more complex problems.
References [1] [2] [3]
50.00
[4]
S0 (g/L)
49.98 49.96
[5]
49.94
MOFA NSGA II
49.92 49.90
[6]
49.88 3.5
4.0
4.5
5.0
5.5
6.0
6.5
7.0
P(tf)/tf (gh-1/L)
[8]
KLa (h-1)
Figure 10. Initial substrate concentration versus overall productivity of gluconic acid (β0=1.0, γ=1.0, α=0.8)
300 270 240 210 180 150 120 90 60
[7]
[9]
[10] MOFA NSGA II
[11]
[12]
3.5
4.0
4.5
5.0
5.5
6.0
6.5
7.0
P(tf)/tf (gh-1/L) Figure 11. Overall oxygen mass transfer coefficient versus overall productivity of gluconic acid (β0=1.0, γ=1.0, α=0.8)
1.005
[13] [14] [15]
X0 (UOD/mL)
1.000 [16]
0.995 0.990 MOFA NSGA II
0.985
[17] [18]
0.980 0.975 3.5 4.0 4.5 5.0 5.5 6.0 6.5 7.0
[19]
-1
P(tf)/tf (gh /L) [20] Figure 12. Initial biomass concentration versus overall productivity of gluconic acid (β0=1.0, γ=1.0, α=0.8)
[21]
Acknowledgement
[22]
The authors acknowledge the financial support provided by FAPEMIG. Dr Steffen Jr acknowledges the financial support provided by FAPEMIG and CNPq (INCT-EIE).
[23]
Stadler, W., 1986, Multicriteria optimization in mechanics - a survey, Applied Mechanics Reviews, 37 (2), 277-286, 1986. Deb, K., Multi-Objective optimization using evolutionary algorithms, John Wiley & Sons, Chichester, UK, ISBN 0-47187339-X, 2001. Omkar, S. N., Khandelwal, R., Yathindra, S., Naik, N. G. and Gopalakrishnan, S. Artificial immune system for multi-objective design optimization of composite structures, Engineering Applications of Artificial Intelligence, 2 (21), 1416-1429, 2008. Wong, E. Y. C., Yeung, H. S. C. and Lau, H. Y. K., Immunitybased hybrid evolutionary algorithm for multi-objective optimization in global container repositioning, Engineering Applications of Artificial Intelligence, 22 (2), 842-854, 2009. Lobato, F. S., Steffen Jr, V. and Silva-Neto, A. J., Self-adaptive differential evolution based on the concept of population diversity applied to simultaneous estimation of anisotropic scattering phase function, albedo and optical thickness, Computer Modeling in Engineering & Sciences, 1, 1-17, 2010. Yang, X.-S., Nature-Inspired Metaheuristic Algorithms, Luniver Press, Cambridge, 2008. Edgeworth, F. Y., Mathematical Psychics (P. Keagan, London, England, 1881. Pareto, V., Manuale di Economia Politica, Societa Editrice Libraria, Milano, Italy, Translated into English by A.S. Schwier as Manual of Political Economy, Macmillan, New York, 1971, 1906. Yang, X.-S. Firefly algorithm, Lévy flights and global optimization, Research and Development in Intelligent Systems XXVI (Eds M. Bramer, R. Ellis, M. Petridis), Springer London, 209-218, 2010. Lukasik, S. and Zak, S. Firefly algorithm for continuous constrained optimization task, ICCCI 2009, Lecture Notes in Artificial Intelligence (Eds. N. T. Ngugen, R. Kowalczyk, S. M. Chen), 5796, 97-100, 2009. Luz, E. F. P., Becceneri, J. C. and Campos Velho, H. F. Firefly Algorithm Contextualization and Its Application Heat Conduction Problems (in portuguese), IX Workshop do Curso de Computação Aplicada, INPE - São José dos Campos, SP, Brazil, 2009. Yang, X. S., Firefly algorithm for multimodal optimization, Stochastic Algorithms: Foundations and Applications, 5792 (2), 169-178, 2009. Pfeifer, A. A. and Lobato, F. S. Solution of singular optimal control problems using the firefly algorithm, Proceedings of VI Congreso Argentino de Ingeniería Química - CAIQ2010, 2010. Apostolopoulos, T. and Vlachos, A., Application of the firefly algorithm for solving the economic emissions load dispatch problem, International Journal of Combinatorics, 1(5), 1-23, 2011. Deb, K., Pratap, A., Agarwal, S. and Meyarivan, T. A fast and elitist multi-objective genetic algorithm-NSGA-II, KanGAL Report Number 2000001, 2000. Castro, R. E., Multi-objective optimization of structures using genetic algorithm, PhD Thesis (in portuguese). Federal University of Rio de Janeiro, Brazil, 2001. Rangaiah, G. P., Advances in Process Systems Engineering – Multi-objective Optimization, Techniques and Applications in Chemical Engineering, First Edition, 2009. Seider, W. D., Seader, J. D. and Lewin, D. R. Product and Process Design Principles: Synthesis, Analysis, and Evaluation, John Wiley, New York, 2003. Luus, R. and Jaakola, T. H. I. Optimization by direct search and systematic reduction of the size of search region. AIChE Journal, 19, 760-766, 1973. Edgar T. F., Himmelblau D. M. and Lasdon L. S. Optimization of Chemical Processes. New York, McGraw-Hill, 2001. Luus, R. Optimization of systems with multiple objective functions. International Congress, European Federation of Chemical Engineering, Paris, 3-8, 1978. Ghose, T. K. and Gosh, P.. Kinetic analysis of gluconic acid production by Pseudomonas ovalis. J. App. Chemical Biotechnology, 26, 768-777, 1976. Johansen, T. A., Foss, B. A. Semi-empirical modeling of nonlinear dynamic systems through identification of operating regimes and locals models. In: Neural Network Engineering in Control Systems, K Hunt, G Irwin and K Warwick, Eds., pp. 105126, Springer-Verlag, 1995.