have constructed EPIC-Explorer [3]. .... With EPIC-Explorer it is possible to evaluate, in terms ..... Symposium on Hardware/Software Codesign, Stanley Hotel,.
Multi-objective Optimization of a Parameterized VLIW Architecture Giuseppe Ascia
Vincenzo Catania Maurizio Palesi Davide Patti University of Catania, Italy Dipartimento di Ingeneria Informatica e delle Telecomunicazioni (DIIT) Viale Andrea Doria 6, 95125 Catania, Italy {gascia,vcatania,mpalesi,dpatti}@diit.unict.it Abstract The use of Application Specific Instruction-set Processors (ASIP) in embedded systems is a solution to the problem of increasing complexity in the functions these systems have to implement. Architectures based on Very Long Instruction Word (VLIW), in particular, have found fertile ground in multimedia electronic appliances thanks to their ability to exploit high degrees of Instruction Level Parallelism (ILP) with a reasonable trade-off in complexity and silicon costs. In this case ASIP specialization may require not only manipulation of the instruction-set but also tuning of the architectural parameters of the processor and the memory subsystem . Setting the parameters so as to optimize certain metrics requires the use of efficient Design Space Exploration (DSE) strategies, simulation tools and accurate estimation models operating at a high level of abstraction. In this paper we present a framework for evaluation, in terms of performance, cost and power consumption, of a system based on a parameterized VLIW microprocessor together with the memory hierarchy. Further, the framework implements a number of multi-objective DSE strategies to obtain Pareto-optimal configurations for the system.
1. Introduction The embedded systems market is without doubt the largest and most significant application area for microprocessors. There are basically two reasons for its success: the first is the shorter lifecycle for products based on embedded systems, which has led to increased competition between manufacturers, the second is the constant increase in the number, complexity and heterogeneous nature of the functions these products have to offer. The reduction in the time-to-market has also made it unfeasible to design a processor from scratch for a specific application. On the other hand, the design of an embed-
Proceedings of the 2004 NASA/DoD Conference on Evolution Hardware (EH’04) 0-7695-2145-2/04 $ 20.00 © 2004 IEEE
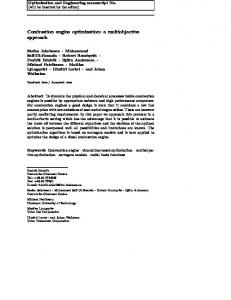
Architecture description
Benchmark application
Compiler
Simulator
Performance numbers
Figure 1. The Y-chart approach.
ded system is application-specific and so the use of generalpurpose microprocessors is often not only inappropriate but also unfeasible in terms of performance, cost, power, etc.. It is widely accepted nowadays that the use of Application Specific Instruction-set Processors (ASIP) in embedded systems provides much more flexible solutions than an approach based on ASICs and is much more efficient than using standard processors in terms of both performance and power consumption [10]. With ASIPs, also known as soft cores, it is possible to modify some of the hardware parameters of the processor to generate a customized instance for a specific application domain. To guarantee high performance levels, an ASIP has to exploit the instruction level parallelism (ILP) Architectures based on Very Long Instruction Word (VLIW) processor, in particular, are currently seen as answering the demand for modern, increasingly complex embedded multimedia applications, given their capacity to exploit high levels of ILP while maintaining a reasonable trade-off between hardware complexity and cost [14].
• A DSE strategy. Compiling and executing the target application on all possible ASIP configurations is time-consuming and more often than not computationally feasible, for two main reasons. The first is that the number of configurations is exponential in the number of parameter values. The second concerns the time required to evaluate single configurations, which includes compilation of the application for each specific configuration and simulation of the application with potentially large data sets. The contribution we intend to make with this paper covers both these points. We propose a framework (freely downloadable from the Internet [16]) which combines a retargetable ILP compiler and simulators and exploits the state of the art in estimation models with a high level of abstraction, making it possible to evaluate, in terms of area, performance and power consumption, any configuration of a system comprising a parameterized VLIW architecture and a parameterized 2-level memory hierarchy. Using the framework we conduct an extensive exploration of the lowpower/high-performance/low-cost design space for a set of typical media and communication applications.
2. A Parameterized VLIW-based Platform To evaluate and compare the performance indexes of different architectures for a specific application, one needs to
Proceedings of the 2004 NASA/DoD Conference on Evolution Hardware (EH’04) 0-7695-2145-2/04 $ 20.00 © 2004 IEEE
Fetch Unit Prefetch Unit
Predicate Registers
Branch Unit
Branch Registers
Integer Unit
Instruction Queue
General Purpose Registers
Floating Point Registers
Floating Point Unit
L1 D ata C ach e
Prefetch Cache
L1 Instruction C ach e
• An environment to measure the variables to be optimized following any variation in the architecture being examined, in this case the use of retargetable tool generation. Retargetable techniques make it possible to automatically generate compilers and simulators that are aware of customizations and can thus generate or simulate a code that is aware of any customizations.
D eco de a nd C on tro l L og ic
Figure 1 shows the Y-chart proposed by Kienhuis [11] as a general scheme that captures the essence of any DSE approach. The backbone of the scheme consists of a retargetable compiler and simulator. The input to the compiler is both an architecture description, and a number of benchmark applications. The output at the simulator is numbers that reflect system performance. Note that system performance depends on the quality of all the above-mentioned components. The scheme provides for three possible iterations that act to optimize the code, the compiler and the architecture respectively. In this paper we will focus on the third cycle, which involves optimization of the architectural parameters of a VLIW processor, together with the memory subsystem, with a view to optimizing area, performance and power consumption for a specific application. This requires two tools:
simulate the architecture running the code of the application. When the architecture is based on a VLIW processor this is impossible without a compiler. In addition, to make architectural exploration possible both the compiler and the simulator have to be retargetable. Trimaran [1] provides these tools and thus represents the pillar around which we have constructed EPIC-Explorer [3]. EPIC-Explorer is a framework that not only allows us to evaluate any instance of a platform in terms of area, performance and power, exploiting the state of the art in estimation approaches at a high level of abstraction, but also implements various techniques for exploration of the design space. The Trimaran system is based on the HPL-PD architecture which is a parametric processor architecture designed for research in instruction-level parallelism. The HPL-PD opcode repertoire, at its core, is similar to that of a RISClike load/store architecture, with standard integer, floating point (including fused multiply-add type operations) and memory operations. The reference architecture is shown in Figure 2. It comprises a VLIW microprocessor core and a two-level memory hierarchy.
L2 U nified C a ch e
1.1. Our Contribution
Control Registers
Load/ Store Unit
Figure 2. Reference architecture based on VLIW core.
The tunable parameters of the architecture can be classified in three main categories: registers file, functional units and memory sub-system. Each of these parameters can be assigned a value from a finite set of values. A complete assignment of values to all the parameters is a configuration. A complete collection of all possible configurations is the configuration space, (also known as the design space). A configuration of the system generates an instance that is simulated and evaluated for a specific application according to the scheme in Figure 3. The application written in C is first compiled. Trimaran uses the IMPACT compiler system as its front-end. This front-end performs ANSI C parsing, code profiling, classical code optimizations and block formation. The code pro-
App lication C
Processor
four different types of circuit: static, dynamic, clock and SRAM. The model, the parameters of which were characterised using SPICE on a 0.25µm technology, gives two measures for each type of circuit:
IMPACT
Elcor
HM DE S
Simulator
Configuration
• Active Power Density: average power consumption per area unit when active.
Statistics
Cache simulator
Memory
Estimator
Explorator
Area
Execu tion tim e
Pow er
Figure 3. Evaluation flow. duced, together with the High Level Machine Description Facility (HMDES) machine specification, represents the Elcor input. The HMDES is the machine description language used in Trimaran. This language describes a processor architecture from the compiler’s point of view. Elcor is Trimaran’s back-end for the HPL-PD architecture and is parameterized by the machine description facility to a large extent. It performs three tasks: code selection and scheduling, register allocation, and machine dependent code optimizations. The Trimaran framework also consists of a simulator which is used to generate various statistics such as compute cycles, total number of operations, etc. In order to consider the impact of the memory hierarchy, a cache simulator has been added to the platform. Together with the configuration of the system, the statistics produced by simulation contain all the information needed to apply the area, performance and power consumption estimation models. The results obtained by these models are the input for the exploration block. This block implements an optimization algorithm, the aim of which is to modify the parameters of the configuration so as to minimize the three cost functions (area, execution time and power dissipation).
2.1. Power estimation The amount of power consumed by the processor was estimated using an adaptation of the Cai-Lim model [5] to the VLIW processor. As shown in [7] the model possesses a discrete degree of accuracy and it is designed to demonstrate relative power savings between designs. The model subdivides the architecture into a set of functional blocks called FBUs (Functional Block Units), associated with various elements of the architecture (instruction decoding, the integer, floating point, memory and branch functional units etc.). Each of these FBUs is considered to be made up of
Proceedings of the 2004 NASA/DoD Conference on Evolution Hardware (EH’04) 0-7695-2145-2/04 $ 20.00 © 2004 IEEE
• Inactive Power Density: average power consumption per area unit when inactive. This quantity is mainly due to static power consumption (usually set to 10% of the active power density). So, the power contribution for a particular FBU can be computed considering the relative area occupation of each type of circuit mentioned above and the activity/inactivity cycles of the FBU. (The cycles of activity and inactivity are obtained from the execution statistics). The contribution to power consumption made by the memory hierarchy was estimated using the analytical model presented in [9] based on the characterisation performed by Wilton and Jouppi in [17]. Analytical model have been used successfully by several researchers to study the power tradeoffs of different cache/memory configurations. These model attempt to capture analitically the energy consumed by the memory address decoder(s), the memory core, the read/write circuitry, sense amplifies, and cache match support hardware (e.g., tag match logic). A fundamental aspect of the model being considered is that it is based on estimation of the number of transitions for the various circuit elements involved in the activity of the cache. These transitions are estimated using the dynamic statistics from the simulations and the equations described in [9]. The energy consumption of the buses depends on the switching activity on the bus lines and the interconnect capacitance of the bus lines (with off-chip buses having much larger capacitive loads than on-chip buses). The contribution towards power consumption made by the interconnection system was calculated by counting the number of transitions on the bus lines and applying the formula 2 αf Cl where Vdd is the supply voltage, α Pbus = 1/2Vdd is the switching activity (i.e. the ratio between the total number of transitions on the bus and the number of patterns transmitted), f is the clock frequency and Cl is the capacity of a bus line (assuming that all the lines have the same capacity). As technology scales into the deep submicron, chip sizes grow, and multiprocessor chip architectures become the norm, system level interconnect structures will account for a larger and larger portion of the chip energy and delay. In this paper we include the energy consumed in the offchip buses with the main memory energy consumption and the on-chip buses with the cache energy consumption.
2.2. Area estimation The area occupied by the processor with varying architectural and micro-architectural parameters was estimated using the analytical model proposed by Miyaoka et al. in [13]. The area is estimated as the sum of a kernel and other hardware units. By minimum kernel we mean the nucleus of the processor that implements the generic, essential functions, for example the pipeline stages (fetch, decode, execution memory access, write back), a bus for the instructions memory, a bus for the data memory, an ALU unit, a shifter, etc. For varying numbers of instructions that can be executed simultaneously this minimum generic kernel was mapped in the Miyaoka model and synthesized. To the area of this minimal kernel it is necessary to add the contributions made by the other components of the processor. These take account of the increase due to the number of possible instructions and the number of bits per instruction, the register files and the functional units. To estimate the area occupied by the caches we used the model described in [17].
2.3. Execution Time The performance statistics produced by the simulator are expressed in clock cycles. To evaluate the execution time it is sufficient to multiply the number of clock cycles by the clock period. This was set to 10% longer than the time required for access to the level 1 cache. Of course when the cache configuration varies, the clock period will also vary. Memory subsystem configurations that guarantee fewer misses (because, for example, they adopt larger caches or caches with a higher degree of associativity) and thus an improvement in the number of clock cycles, may therefore lead to worse overall performance due to a longer clock period.
3. Design Space Exploration With EPIC-Explorer it is possible to evaluate, in terms of area, power and execution time, any application written in C executed on any configuration of the system described in the previous section. The problem is therefore finding system configurations that will optimize these indexes for a specific application. But how many possible system configurations are there? That is, how large is the design space to be explored? Table 1 gives the set of values each system parameter can take. There are a total of 18 parameters, 9 relating to the memory hierarchy and 9 to the processor, giving a total of 1.47 × 10¹³ possible combinations. Of course, in real cases a lot of the design space will be blocked off due to high-level decisions and not all the
Proceedings of the 2004 NASA/DoD Conference on Evolution Hardware (EH’04) 0-7695-2145-2/04 $ 20.00 © 2004 IEEE
Parameter GPR FPR PR CR BTR Integer Units Float Units Memory Units Branch Units L1D/I cache size L1D/I cache block size L1D/I cache associativity L2U cache size L2U cache block size L2U cache associativity Space size
Parameter space 16,24,32,40,48,56,64 8,16,24,32,40,48,56,64 8,16,24,32,40,48,56,64,128,256 8,16,24,32,40,48,56,64 8,12,16 1,2,3,4,5,6 1,2,3,4 1,2,3 1,2,3 128B,256B,512B,...,128KB 8B,16B,32B,64B 1,2,4,8,16 8KB,16KB,32KB,...,512KB 8B,16B,32B,64B,128B 1,2,4,8,16 1.47 × 10¹³
Table 1. Space of variation of the parameters.
combinations can be mapped in a configuration of the system (unfeasible configurations). For example, a configuration in which the first-level cache has less capacity than the second-level cache is considered unfeasible and will not be part of the space of possible configurations. At any rate, the space of feasible configurations still remains impossible to explore exhaustively. EPIC-Explorer implements various multi-criteria exploration algorithms which provide an approximation of the Pareto-optimal set. The current distribution implements four exploration techniques. The first is the one proposed by Givargis et al. in [8] and consists of clustering dependent parameters and then carrying out an exhaustive exploration within these clusters. The second technique, proposed by Ascia et al. in [2], uses genetic algorithms as optimization tools. The third, proposed by Fornaciari et al. in [6] uses sensitivity analysis to reduce the space of exploration from the product of the cardinalities of the sets of variation of the parameters to their sum. Finally, the fourth technique, proposed by Palesi et al. in [15], globally uses a parameter dependency model to extensively prune non-optimal sub-spaces. Locally, the approach applies genetic algorithms to discover Pareto-optimal configurations within the remaining design points.
4. Impact of the Parameters 4.1. Impact of the Functional Units on Parallelism Given the principle on which an architecture based on a VLIW processor works, the number and type of functional units affects the way in which the compiler can schedule the operations in each long instruction. The presence of several instance of a certain functional unit, for example, makes it
possible to schedule several operations using the unit at the same. To give a practical example of this effect, we will refer to Figure 4. The class of applications being considered belongs to the MediaBench suite [12] and represents quite a broad spectrum of the possibilities of using a VLIW architecture in an embedded multimedia environment. As can be seen, a variation in the number of units for integer operations affects the average number of instructions executed per cycle (IPC). As we are focusing on the effect of the functional units, we are momentarily neglecting the impact of a variation in the memory hierarchy on the actual degree of parallelism achieved. We will therefore hypothesize that the parameters of the memory hierarchy are fixed in such a way as to make the number of stall cycles with respect to the total number of cycles negligible. The effect of the memory hierarchy will be analyzed in the following section. 3.00
more complex, however, when dealing with the architecture being investigated here, because it involves interactions between the parameters of the VLIW processor and those of the memory, and these interactions are much less documented and decipherable. Let us give an example. In Figure 4 it can be seen that in some cases the number of instructions per clock cycle almost doubles if 4 integer units are used instead of one. What is the real impact of this increase in parallelism on execution time? The total number of cycles executed by the processor can be seen as the sum of two factors: the ideal execution cycles (i.e. those in which there are no stalls) plus additional cycles due to stalls. It is clear that when the number of cache misses increases, the second term will have a greater impact. This will lead to a reduction in the actual mean number of operations scheduled per clock cycle, as the processor is unable to execute any operations during stall cycles. Cache size
2.75 2.50 2.25
IPC
2.00 1.75
IU = 1
1.50
IU = 2 IU = 3
1.25
IU = 4
1.00 0.75 0.50
rawdaudio
rawcaudio
mpeg2enc
mpeg2dec
jpeg
ieee810
gsm−decode
gsm−encode
0.00
g721encode
0.25
Figure 4. Instructions per cycle for different number of integer units. We have confined this example to a variation in the integer units because this type of operation is widely used in each of the benchmarks being investigated. This simple example already shows that the impact on the number of operations executed per cycle is not uniform in the various applications. This and other similar tests have shown that the degree of parallelism that can be achieved strictly depends on the application source code and has to be analyzed on a case-by-case basis. Of course, when we search for optimal configurations for the architecture as a whole, we will also have to take into account variations in the number of units of other types, and the effect of this variation, as we shall see, will be much more complex and less predictable.
4.2. Impact of the Memory Hierarchy The impact of a variation in the parameters of the cache in terms of performance, area and power has been widely documented in the literature [4]. The analysis becomes
Proceedings of the 2004 NASA/DoD Conference on Evolution Hardware (EH’04) 0-7695-2145-2/04 $ 20.00 © 2004 IEEE
∞ 128KB 64KB 32KB 16KB 8KB 4KB 2KB
1 1.24 1.18 1.16 1.13 1.12 1.11 1.05 1.05
Integer Units 2 3 1.67 1.88 1.50 1.66 1.46 1.60 1.38 1.49 1.34 1.45 1.32 1.41 1.14 1.19 1.13 1.18
Miss Rate 4 2.14 1.86 1.78 1.64 1.58 1.54 1.24 1.22
0.00% 0.64% 0.97% 1.52% 2.13% 2.51% 13.20% 14.19%
Table 2. Impact of the L1 instruction cache on the IPC.
Table 2 gives a practical example of this for the benchmark mpeg2decode, with a variation in the size of the L1 instruction cache. Reading the table from the top down it can be seen that the real case increasingly departs from the ideal one in which a negligible number of misses was hypothesized. Despite this it is misleading to think that choosing several functional units and a cache with almost zero miss frequency is a way to solve the problem of designing VLIW architectures. As seen when discussing the estimation models, in fact, each functional unit always has static power consumption, even when it is not being actively used. How can we decide a priori whether it is preferable, from a power viewpoint, to execute fewer cycles using several units and large caches or more cycles with fewer units and smaller caches? In addition, we are neglecting the other cache parameters: it may be convenient to use blocks of a larger size, or to reduce the degree of associativity so as to shorten the critical path and thus allow for a faster clock frequency. It should therefore be clear that in performing but complex architectures like VLIW the interaction between the various
elements involved makes it difficult to make design decisions exclusively on the basis of the designer’s experience and intuition.
5. Experiments As said previously, a key issue to be taken into consideration in embedded multimedia applications is that performance optimization is often not the only aim. In the last few years, for example, it has become clear that minimization of power consumption is a critical factor in evaluating the correctness of a design decision. Maximization of performance and minimization of power consumption are two requisites that often clash with each other. There is thus no single optimal configuration: it is necessary to identify a set of Pareto-optimal configurations that will represent the best trade-offs the architecture can offer. The design space considered, as seen previously, is of a totally prohibitive size, which precludes any attempt at exhaustive evaluation of all the possible design alternatives. It is therefore necessary to have techniques that will permit “intelligent” exploration of the space of possible configurations so as to obtain, in the initial design stages, the configurations that are more likely to meet the requirements of the system. As the number of alternatives thus obtained is lower, the designer can then assess them individually using more accurate tools and estimation models at a lower level. To show the trade-offs that can be obtained in terms of power consumption and execution time we will refer to the exploration technique that uses a multi-objective genetic approach [2], which features an excellent trade-off between efficiency and accuracy of results. In order to further verify the validity of the technique, tests were carried out on subspaces whose size made it possible to compare the results with those obtained by exhaustive exploration. Table 3 gives the range of variation of each parameter for two different subspaces. In the first subspace only variations in the parameters of the first-level caches and the number of integer units were considered. The aim in defining the second subspace was to consider all the parameters of the processor. As a variation in a processor parameter involves recompiling the benchmark (with a consequent increase in the time required to evaluate each configuration), the range of values for each parameter was limited. In this way the size of the configuration space was kept at sufficiently low as to allow exhaustive exploration. We will refer below to the results obtained on the mpeg2decode benchmark. Equivalent results, in terms of both exploration time and accuracy were obtained with the remaining benchmarks. Figure 5 shows the Pareto-fronts obtained by exhaustive exploration and the genetic approach in both subspaces. To assess the validity of the approximation obtained it must
Proceedings of the 2004 NASA/DoD Conference on Evolution Hardware (EH’04) 0-7695-2145-2/04 $ 20.00 © 2004 IEEE
Parameter GPR FPR PR CR BTR Integer Units Float Units Memory Units Branch Units L1D size L1D block size L1D assoc L1I size L1I block size L1I assoc L2U size L2U block size L2U assoc Space size
Subspace 1 64 64 64 64 16 1,2 1 1 1 4KB,...,64KB 8B,16B,32,64B 1,2,4 4KB,...,64KB 8B,16B,32B,64B 1,2,4 128KB,...,512KB 8B,16B,32B,64B,128B 1,2,4,8,16 540,000
Subspace 2 32, 64 64 32, 128 16, 64 16 1,2,3 1 1,2 1,2 16KB 16B 1 8KB,16KB,32KB 8B,16B,32B 1,2 128KB 64B 2 1,728
Table 3. Parameters and relative range of variation for each of the subspaces explored.
be borne in mind that it is more important for the genetic approach to provide a well-distributed set of solutions with a trade-off range almost identical to the original one than to find all the exact optimal points. It is more interesting to observe the results obtained in the subspace containing all the parameters. Figures 6(a) and 6(b) show the Pareto-front and Pareto-surface in two cases: with two objectives (execution-time/power) and three objectives (area/execution-time/power). Table 4 gives the configurations corresponding to the end points of the Pareto-surface. The three rows refer respectively to the configuration which led to the least cost (area), lowest power consumption and best performance (execution-time). As can be observed, the fastest configuration uses direct mapped caches (which make it possible to work at higher clock frequencies), a greater number of functional units (which increase the IPC) and a larger level-2 cache (which reduces the number of main memory accesses). The configuration that consumes less power optimizes the cache so as to reduce access to the higher, more power-hungry levels in the hierarchy. It does so by increasing the cache size and degree of associativity, to the detriment of the maximum clock frequency and therefore performance. The configuration with the lowest cost naturally minimizes the size of the caches and the number of functional units. Of course, the remaining configurations on the Pareto-surface represent all the possible trade-offs between the three objectives discussed. Finally, Table 5 summarizes the results obtained in terms
35
18 Exhaustive Genetic
Exhaustive Genetic 16
30
14
Execution time(ms)
Execution time(ms)
25
20
15
12
10
8
10 6
5
0
4
5
10
15
20
25
30
35
40
2 10
15
20
25
Power(W)
(a)
30
35 Power(W)
40
45
50
55
60
(b)
Figure 5. Pareto-fronts obtained by exhaustive exploration and the genetic approach in both (a) Subspace 1 and (b) Subspace 2. Area (cm2 ) 0.8 1.9 1.4
Power (W) 13.2 7.3 51.6
Ex. Time (msec.) 16.4 53.7 5.6
Clock (MHz) 1456 1105 1878
IU 3 3 4
Functional units FPU MU 1 1 1 1 2 1
BU 1 2 2
GPR 64 32 64
Registers files FPR PR CR 32 32 32 64 64 64 64 32 32
L1I/L1D/L2U cache S (KB) BS (B) A 4/4/128 32/16/64 4/4/4 32/4/128 64/64/128 4/2/16 8/4/256 64/8/32 1/1/8
Table 4. Extreme configurations. of trade-offs and exploration time. Since the architecture is parametric as regards both the units of the VLIW processor and the memory hierarchy, it provides a broad spectrum of design alternatives. As can be seen, in fact, the trade-offs in terms of area, execution-time and power are considerable. Of even greater importance is the fact that these solutions were obtained visiting a number of configurations that was lower than the whole design space by a factor of about 1010 . This obviously has a great impact on the exploration time, making exploration computationally feasible.
quality of the solutions (also known as Pareto-optimal configurations) obtained. Tests carried out on a set of specific embedded multimedia applications confirmed the flexibility of the platform. Its field of application is considerable. It can be used to evaluate the impact of a system’s architectural parameters on area, power and performance, to test new design space exploration strategies and to investigate the several compilation options offered by retargetable compilers, etc. EPIC-Explorer can be downloaded from http://epic-explorer.sourceforge.net/.
6. Conclusions
References
In this paper we have presented EPIC-Explorer, a framework to evaluate a system comprising a parameterized VLIW microprocessor and a parameterized memory hierarchy, in terms of area, performance and power consumption. Since the architecture is parametric as regards both the units of the VLIW processor and the memory hierarchy, it provides a broad spectrum of design alternatives. The price of this is a difficult, if not impossible, search for the optimal configurations based solely on empirical suppositions. For this reason the framework implements a number of design space exploration strategies, each featuring a different trade-off between the computational complexity of completing the exploration and the
Proceedings of the 2004 NASA/DoD Conference on Evolution Hardware (EH’04) 0-7695-2145-2/04 $ 20.00 © 2004 IEEE
[1] An infrastructure for research in instruction-level parallelism. http://www.trimaran.org/. [2] G. Ascia, V. Catania, and M. Palesi. An evolutionary approach for pareto-optimal configurations in soc platforms. In K. A. Pulishers, editor, SOC Design Methodologies, 2002. [3] G. Ascia, V. Catania, M. Palesi, and D. Patti. EPICExplorer: A parameterized VLIW-based platform framework for design space exploration. In First Workshop on Embedded Systems for Real-Time Multimedia (ESTIMedia), Newport Beach, California, USA, Oct. 3–4 2003. [4] L. Benini, A. Macii, and M. Poncino. Energy-aware design of embedded memories: A survey of technologies, architectures, and optimization techniques. ACM Transactions on Embedded Computing Systems, 2(1), Feb. 2003.
40
35
60
25
50 Execution time(ms)
Execution time(ms)
30
20
15
40 30 20 0.5 10
10
1 1.5
0 0
2 2
10
2.5 Area(cm )
20
5
5
10
15
20
25
30 Power(W)
35
40
45
50
Power(W)
55
30
3
40 50 60
(a)
3.5
(b)
Figure 6. Exploration of the whole configuration space. (a) Trade-off power/execution-time. (b) Trade-off area/power/execution-time. Benchmark mpeg2decode (2D) mpeg2decode (3D) jpeg (2D)
Visited configurations 1137 1037 1012
Elapsed time 47 hours 28 hours 17 hours
Pareto configurations 73 175 83
Area tradeoff – 3.8x –
Power tradeoff 7x 7x 6x
Execution time tradeoff 6.8x 9.6x 8.2x
Table 5. Results summary. [5] G. Cai and C. H. Lim. Architectural level power/performance optimization and dynamic power estimation. In Cool Chips Tutorial colocated with MICRO32, pages 90–113, Nov. 1999. [6] W. Fornaciari, D. Sciuto, C. Silvano, and V. Zaccaria. A sensitivity-based design space exploration methodology for embedded systems. Design Automation for Embedded Systems, 7:7–33, 2002. [7] S. Ghiasi and D. Grunwald. A comparison of two architectural power models. Lecture Notes in Computer Science, 2008, 2001. [8] T. Givargis, F. Vahid, and J. Henkel. System-level exploration for Pareto-optimal configurations in parameterized System-on-a-Chip. IEEE Transactions on Very Large Scale Integration Systems, 10(2):416–422, Aug. 2002. [9] M. B. Kamble and K. Ghose. Analytical energy dissipation models for low power caches. In IEEE International Symposium on Low Power Electronics and Design, pages 143–148, Aug. 1997. [10] K. Keutzer, S. Malik, and A. R. Newton. From ASIC to ASIP: The next design discontinuity. In IEEE International Conference on Computer Design: VLSI in Computers and Processors, pages 16–18, Sept. 2002. [11] B. Kienhuis. Design Space Exploration of Stream-based Dataflow Architectures. PhD thesis, Technical University of Delft, Jan. 29 1999. [12] C. Lee, M. Potkonjak, and W. H. Mangione-Smith. MediaBench: A tool for evaluating and synthesizing multimedia
Proceedings of the 2004 NASA/DoD Conference on Evolution Hardware (EH’04) 0-7695-2145-2/04 $ 20.00 © 2004 IEEE
[13]
[14]
[15]
[16] [17]
and communications systems. In International Symposium on Microarchitecture, Dec. 1997. Y. Miyaoka, Y. Kataoka, N. Togawa, M. Yanagisawa, and T. Ohtsuki. Area/delay estimation for digital signal processor cores. In Asia and South Pacific Design Automation Conference, pages 156–161, 2001. A. Mizuno, K. Kohno, R. Ohyama, T. Tokuyoshi, H. Uetani, H. Eichel, T. Miyamori, N. Matsumoto, and M. Matsui. Design methodology and system for a configurable media embedded processor extensible to VLIW architecture. In IEEE International Conference on Computer Design: VLSI in Computers and Processors, pages 2–7, Sept. 16–18 2002. M. Palesi and T. Givargis. Multi-objective design space exploration using genetic algorithms. In Tenth International Symposium on Hardware/Software Codesign, Stanley Hotel, Estes Park, Colorado, USA, May 6–8 2002. D. Patti and M. Palesi. Epic-explorer. http:// epic-explorer.sourceforge.net/, July 2003. P. Shivakumar and N. P. Jouppi. CACTI 3.0: An integrated cache timing, power, and area model. Technical report, COMPAQ Western Research Lab, Palo Alto, California 94301 USA, 1999.