MULTI-OBJECTIVE OPTIMIZATION OF TRANSMISSION LINES S. Berjozkina1, A. Sauhats1, V. Neimane2 1
Riga Technical University, Institute of Power Engineering, 1 Kronvalda Blvd., Riga, LATVIA 2 Vattenfall Research and Development, Vattenfall AB, 169 92, Stockholm, SWEDEN E-mail:
[email protected];
[email protected];
[email protected] The transmission grid requires new upcoming electrical connections, resulting in limited capacity of the existing overhead lines. One of the possible solutions of the problem is to build the overhead lines and substations. Designing of overhead lines is associated with several considerable technical, environmental and economical problems. The paper deals with the concept of multi-objective optimization of the selection of the optimum transmission line route, including the choice of tower types, the coordinates of tower placement, tower geometry, conductor types and parameters, insulator types, damper types, earthing and lightning systems, span lengths. The optimization is organized in five stages. At the first and second stages, there is a search for a set of optimum solutions set as well as determination of the main impacting factors. The next two stages present two-objective optimization by using Pareto approach. At the last stage, which is described on the example of a case study, then probability of the occurrence constrain violation conditions is assessed. The cause and its prevention methods are identified. The presented approach is based on a real line design case with the main purpose to minimize the total invested capital and maximize the net present value. The results are reviewed in the paper. Key words: design engineering, Pareto optimization, power transmission, transmission lines.
1. INTRODUCTION Power systems are among the most complex systems created by mankind. They include hundreds and thousands of components: boilers, turbines, generators, transformers, transmission lines, etc. The functions of the components are interdependent: the processes going on in one part of the system influence the functioning of other elements. The interdependence of the elements determines the need to account it yet at the designing stage of the new energy facilities, for example, transmission lines. The impact of a high or super high voltage transmission line on the remaining parts of a power system is significant; also, the changes in the system may substantially influence the transmission situation. The operating conditions are continuously varying in time – new customers and power plants appear, prices grow and power consumption changes. Costly power systems elements and components have a life cycle of several decades. This motivates the need to estimate the conditions that may arise in a rather distant future. Clearly, these conditions cannot be predicted exactly; therefore, it is necessary to account for numerous impacting factors and conditions. The random and uncertain nature of these factors generates the complexity of formulating and solving the task of optimum design of expensive power objects, in particular, transmission lines.
A significant increase of electric power flows, caused by notable changes in the power system structure (competitive energy markets, development of large-scale wind power farms) as well as a larger impact of technical and legislative constrains on the allowable load current of the existing distribution and transmission network, has been observed over the last decades. There is a need to build new overhead high voltage lines (OHLs), which requires considerable invested capital as well as causes a significant impact on the environment. The goals of reducing invested capital, increasing the reliability of the system, decreasing the impact on the environment during the design, construction and operation of OHLs are natural and clear. To achieve these objectives, new advanced power transmission and OHL design technologies were developed and implemented within the framework of the Smart Grid [1]. For instance, High Temperature Low Sag Conductors (HTLS) are available, which is one of the possible solutions for upgrading and improving the existing transmission lines [2], [3]. In this way, replacement of the conductors of the traditional type with HTLS conductors, using modern insulators [4], effective towers [5], earthing and lightning protection systems [6] and monitoring and control systems may offer several technical and economic advantages like long-term reliability, a higher capacity, a low sag-tension property, easy and quick design and installation, low reconstruction investments. Powerful software has been developed for simplifying OHL design [7], [8]. The most widely used transmission line designing methods are based on the cost-benefit analysis and maximization of the net present value (NPV) [9] or minimization of capital costs, subject to several constrains. The approach aimed at to finding a minimum cost of designing of the transmission lines is described in [10]. Development of the methodology that explores the sensitivity of the required present value of revenue in order to achieve design performance at minimum cost is presented in [11]. In [12] a study of the line optimization techniques, which can be applied to decide whether standard or optimized line designs are appropriate, is presented. An optimum design method that takes into account the lightning impact calculates and proposes the most suitable line insulation level, tower footing resistance, and average height of shielding wires, is described in [13]. In [14] a method for the optimum design of OHLs is developed with the main objective of minimizing the total annual cost of the line, considering the relevant technical constrains. The OHL’s impact on the environment is significant, which causes complications during the selection of the transmission line route (it is necessary to take into account the public and activity places both for people and for animals and birds), which is taken into consideration in [15]. All the above-mentioned publications are based on the deterministic methodology. A study based on game theory criteria and application of the stochastic approach for network development is presented in [16]. In the general case, the optimization objective can be presented as in Fig. 1, where the existing constrains limit the allowable area for the search of the optimum solutions.
Fig. 1. A graphic representation of the optimization objective
This paper deals with the OHL design method, which is also partially based on a stochastic approach and game theory criteria that are used for the final decision-making. For this purpose the following five steps are used: 1. Based on the analysis of the development plans of the region, the scenarios of the growth of loads are developed and changes in the requirements for the transmission capacities of OHLs are estimated; 2. By means of automatic power line design software, which includes a knowledge base, a variety of competitive structure variants and OHL parameters are selected. The most impacting constrain is defined; 3. There is an evaluation of the worth of capital costs and NPV of all the variants both when the constrains are observed and in the case if one of them is violated; 4. The whole variety of the competitive decisions is constructed. The plane of capital costs is used as well as the parameter that characterize the constrain; 5. There is an assessment of the probability of the occurrence of conditions that cause violation of constrain, the consequences of the violation and the methods for preventing it. The last two steps will be explained in a case study. 2. THEORY 2.1. Theoretical formulation of the optimization task for the design of a power transmission line In order to formulate the tasks of transmission line design taking into account the influence of random and uncertain factors, let us assume that: The company, which is the owner of the OHL, strives to minimize invested capital IC and increase its revenues Rti (the net cash flow i.e. the cash
inflow – the cash outflow, for each year ti of the planning period T, T=m·ti). Revenues Rti and invested capital IC of the company depends on the structure Σj and the parameters Пj of the OHL chosen by this company. The structures Σj are described as a set of discrete variables (the number of wires per phase, the height and parameters of the standard towers, the conductor area, the mechanical and electrical parameters of the conductor etc.). Each such structure is called an alternative. Let us assume that N alternatives Aj are considered, j=1, …, N. The parameters Пj are described by a set of continuous variables (the span lengths, coordinates for construction of the towers etc.). The freedom in choosing the structures and parameters of the company is limited. Let Sj be the set of all permissible structures and parameters for the OHL and sj = {Σj , Пj} as the chosen combination of the structure and parameters, sj Sj. The frontier of the space of permissible structures is determined by the inequalities that describe the technical and legislative factors and regulations. OHL functions under the influence of the ambient environment that is characterized by a set of random and uncertain parameters Xti (the load current in a power line, the ambient temperature, the wind speed, the humidity, etc.). In the general case, Xti are changing in time. We assume that during each year ti, Xti are constant. Due to the influence of random and uncertain factors, the revenues are also uncertain: in this case the scenario approach in combination with probabilistic variables can be used for solving the planning task. The uncertain information will be always modelled by a number of scenarios. For each scenario SCn (n=1, …, k) we can declare that the revenues Rtij are probabilistic values. Hence, we can state the following: Rtijn Rtijn s j , X tijn
(1)
Suppose that distribution functions that have the following form may be assigned to each combination of scenario SCn and alternative Aj:
Ftijn Ftijn ( Rtijn s j , Xtijn SC , A j ) n
(2)
If the distribution function is known, the expected value of the revenues for each year ti, for each combination of scenario SCn and alternative Aj can be determined using the following equation: E R( s,) ... R( s, )dF ( R( s, )),
(3)
where Ω is an integration area, which is limited by the existence space of the random parameters X. The frontier of the space of the allowable parameters and structures Sj is limited by the following restriction:
FR s j , X 0.
(4)
In the equation (3) the Lebesgue-Stieltjes integral is used [17]. The knowledge of the expected values of the revenues allows finding the equation for the determination of the net present value (NPV), which serves as the main optimization criterion: m E ( R) NPV IC (5) i1 (1 I )ti where IC – investment capital, which is the function of sj. Then the optimum planning task can be presented in the following form: m E ( R) s*jn arg max IC i 1(1 I )ti
(6)
where arg stands for “the argument for”; the subject of maximization; I is the discount rate. Solving the task (6) will result in the system’s structures and parameters s*jn that maximize NPV for the planning period T for all the selected scenarios SCn and alternatives Aj. For each combination of SCn and Aj the evaluation of NPV can be determined. In realizing the NPV maximization process, the extended space s*jn is selected additionally with the purpose of determining the alternatives and the values of parameters, which is approaching the frontier of the allowable space and beyond its limits that can be stored. Such parameters Ri will be reviewed as the additional criteria in optimization. Having as a result the NPV and Ri values for all combinations of scenarios and alternatives, we can obtain the matrix formulated in Table 1. After that, it remains to choose the best of the alternatives. In the given set of alternatives there are even solutions that lead to violation of the most impacting constrains. Each of the columns of Table 1 may contain Pareto set; if the indexes Ri consider the second optimization criteria (note that in the general case these indexes can be numerous). Table 1 The expected values of the Net Present Value and constrain indicators Ri Alternatives A1 ……. AN
Scenario 1 NPV11|| R11 ……. NPVN1|| RN1
… … … …
Scenario k NPV1k|| R1k ……. NPVNn|| RNk
The final decision-making based on the decision set in Table 1 is a complex task in the general case, for solving which several methods are proposed [18]. When dealing with the specific tasks, as it will be illustrated below, significant simplifications may occur. 2.2. The selection of the scenarios and alternatives The need to construct a new transmission line can be revealed based on the forecasts of economic development for a certain geographic region. If there is a prediction of new loads or an increase of the existing loads, new generation
sources, inability to supply the demand of electricity using the existing network, a decision concerning the construction of a new line can be made. Due to the impact of the uncertainties, there is a need to consider several scenarios, for instance, for the load increase ratio. After selecting the power system development scenarios, numerous alternatives are examined with the purpose of choosing the optimization parameters S (see part 2). The following parameters can be the subject of optimization: the nominal voltage of a line, the mechanical and electrical characteristics of a conductor (conductor diameter, cross-section, the coefficient of linear expansion, the modulus of elasticity, the allowable conductor temperature as well as the load current, the reduced specific load, the linear loads, the destructive loads), the conductor type and the quantity of conductors per phase; tower type, geometry, height, the allowable wind, weight and clearance spans; the insulator type, the damper type; the lightning wire type, the earthing and lightning protection systems; the optimum line route. Thus, to achieve the best technical and economical solution of the transmission line design, a large number of optimization variables need to be taken into account. As mentioned previously, OHL is operated under the influence of the ambient environment that is characterized by a set of random and uncertain parameters Xti. The impacting parameters that describe the operating conditions of the OHL are the following: climate conditions (ambient temperature, wind speed, wind direction, solar radiation, air humidity, ice thickness); the capacity of the transmission line in the future power system; the forecast electricity consumption; expansion of the existing interconnection systems; environmental impact. For simplifying the very complex task of evaluating the revenues of a large number of scenarios and combinations of the alternatives, the choice of a vast number of optimization variables, the task of filtering the limited competitive variants is formulated and solved by disregarding obviously expensive or unreliable variants. Until recently, the set task was solved on the basis of using the accumulated experience, which was issued in the form of various guidance documents containing descriptions of standard cooperative solutions and rules. In the last decades, powerful software tools have been used [7]-[8], which give the opportunity to form a significantly smaller initial set of competitive alternatives. Then there is a problem related to the evaluation of the effectiveness and appropriateness to the technical and legislative constrains of every alternative for each scenario. 2.3. The main constrains during the optimization The search for the best alternatives of OHLs has to take into account several constrains: thermal (allowable conductor temperature, load current), mechanical (conductor sag, mechanical tension), electrical (insulation levels) and environmental (climatic conditions, the impact of the electromagnetic field) [19]. During the designing of the OHL it is necessary to provide the adjusted maximum capacity (the allowable load current), the ground clearance as well as the clearance to the crossed objects, and the distributions of the electric and magnetic fields. In respect that a large number of optimization parameters are discrete, it can be argued that for solving the optimization task formulated in section II (6), it is
necessary to perform investment calculations for all possible combinations of parameters sj corresponding to the area that meets the constrains: sj Sj. Generally, if one of the existing constrains is not met, the alternative is not taken into account in the optimization task and is rejected. However, this study allows consideration of the alternatives that violate these constrains, because the development and implementation of new technical possibilities like the Smart Grid, different monitoring systems as well as the existence of HTLS is giving additional opportunities to meet the constrains. Thus, the approach allows for the possibility of a violation of constrains and evaluates the probability of occurrence of such violations. The most significant constrains are described below. A. Thermal Limitations Commonly, thermal constrains are defined by the load current of the overhead line and the physical characteristics of the conductor type, which prescribes the permissible conductor temperature. To check the fulfilment of the constrain conditions, the IEEC 1507 thermal rating method [20] is the most widely used one. Here the heating-cooling balance equation of the conductor is used as well as the numerous parameters that characterize the climate conditions. B. Mechanical Limitations
Basically, the mechanical is represented by the conductor sag, the “clearing distance” to the ground as well as to the crossed objects like roads, waterways, railways, other (low-voltage, medium voltage, high voltage) power lines or telecommunication lines and buildings. A special software program, “SAPR LEP 2011”, was used for systematic calculation of the examined conductors as well as for the placement of towers on an actual profile of the model of the line under design, which was based on terrain laser scanning data. C. Environmental Limitations Environmental impact assessment is, first of all, the study of the electrical and magnetic fields, which depend on the line voltage, the line current, the height of the conductors above ground, the height above ground at the point of field measurement, and the configuration of the conductors. All the calculations of the strengths of electric and magnetic fields have to be performed by using the appropriate software, for example, [21]. 2.4. Calculation of revenues and the Net Present Value (NPV) Calculation of the NPV is a difficult and very time-consuming task. There are difficulties that are determined by the following main factors: The price of OHL elements needs to be taken into account, which will be defined “experimentally” by conducting negotiations with the stakeholders (the compensation of the land value for the OHL route, the cost of the towers and conductors, the conditions for obtaining a loan, etc.) There is a lack of a common recognized methodology of revenue [22], which occurs as a result of the OHL construction calculation.
Thus, the construction of a new transmission line has the following main purposes: it connects new generation and resource areas to the network (there is integration of renewable, fossil-fired, hydro and nuclear resources); improves the reliability of a grid (there are economic and congestion reasons) as well as manages risk by providing access to additional generation resources; increase the efficiency due to a reduction in the line losses; reduce the energy cost by providing access to diverse generation resources; make wholesale markets more competitive and efficient [23]. In this study, let us suppose that the additional income of the transmission grid is distributed equivalently among the existing network and the newly built objects; then, we obtain the amount of annual income: I Caug Rinc l , Is 2
where
Caug 1Ean 2Eantr ,
(7)
(8)
where IS – the annual investment in a transmission grid; Il – the investment in the construction of the OHL; Ean – the annual growth of the power consumption; Eantr – transit energy; α1 and α2 – the power consumption growth coefficients; β – the rate of the cost of energy. 3. RESULTS and DISCUSSION Let us consider an example of using the described methodology of optimization of the transmission line design based on a real project, which will be implemented in Latvia. In the Baltic region (Latvia, Lithuania, Estonia, the west coast of Russia, and Belarus) designing and construction of a number of major power plans, including a nuclear power plant, is performed. There are a number of projects including submarine cables and overhead lines, which have already been implemented or will be constructed in the near future for connecting with the power systems of Scandinavia and Poland. As a result of analysis of modes of energy systems there is a need to build new lines, the fragment of the diagram of such a power system, which includes these lines, is presented in Fig. 2. The fragment of the presented diagram describes only a small part of the whole interconnected power system. The electrodynamics model, which was used for the calculation of the static and dynamic modes of the Latvian power system, encompasses the vast Baltic countries region and includes one of the main objectives of selection of the maximum permissible current value of the transmission line under consideration. Power system analysis for the region’s development scenarios resulted in the following alternatives for the new transmission line (see Fig. 3): 110 kV transmission line with the maximum current of 1200 A (optimistic scenario 1) or 800 A (pessimistic scenario). 330 kV transmission line with a maximum current of 2000 A (optimistic scenario 2) or 1500 A (pessimistic scenario).
There is a 118 km long overhead line, which has to be designed for the particular climatic conditions of the region near the Baltic Sea: Wind pressure: 650 Pa (wind region II); Ice thickness: 10 mm (icing region II); Minimum temperature: –35°С; Maximum temperature: +35°С; Average operating temperature: +5°С.
Fig. 2. A fragment of a power system diagram including 330 kV and 110 kV lines under design
Fig. 3. A diagram of the optimistic and pessimistic scenarios of the capacity of the line for 330 kV and 110 kV circuits
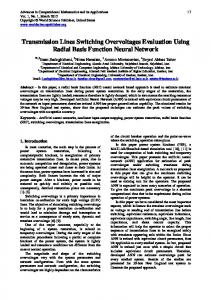
The optimization task of the structure and parameters of a new transmission line was formulated. After searching for the optimum solutions by using the software for OHL design, twenty alternatives were selected, formed by implementing different combinations of the examined towers and conductors (see Table 2). To simplify the posed task at the first stage instead of the NPV maximization according to part 5 there is a minimization of the invested capital is conducted. In the final comparison of the options the time-consuming task with the NPV criteria will be used. There are three main conductor types, which were chosen for the comparison: a) The traditional type conductor – the Aluminium Conductor Steel Reinforced (ACSR) consists of a steel core and aluminium strands [24]; b) The HTLS type conductor – the Aluminium Conductor Composite Core (ACCC) consists of a hybrid carbon and glass fiber core, which is stranded with trapezoidal shaped aluminium strands a steel core and aluminium strands [3]; c) The HTLS type conductor – the Aluminium Conductor Composite Reinforced (ACCR) relies only on aluminium-based materials, where the core strands are composed of wires formed from aluminium oxide fibers embedded in high purity aluminium [25]. Based on the experience in constructing power lines of the examined voltage and an interview with the manufacturers of the towers, the two types of towers were accepted. There are two general technical solutions for the design of a line. Firstly, using standard towers (the height to the lower conductor is 20 m) with a combination of different conductor types. Secondly, the same solution as in the first case, but with a difference in the use of higher towers (the height to the lower conductor is 22 m). The height of the towers, the span lengths, the clearances between the conductors and the ground or to the crossed objects identify the electric and magnetic field parameters, the values of which are regulated with the purpose of decreasing the impact on the environment. To simplify the evaluation of this impact, calculations were done; the results are presented in Fig. 4. The verification of the constrains was simplified due to the existence of these results in the evaluation of the alternatives.
Fig. 4. Electric field distribution (Emax) at Y = 1.8 m above ground in the cross-section of a 330/110 kV line for the minimum “clearing distances” of the 330/110 kV conductors: 8/10 m, 9/11 m, 9.5/11.5 m, 10/12 m, 11/13 m and 12/14 m
The following groups of combinations were selected: a) V1 and V10; V11 and V20 mean that there are the traditional type conductors for both 110 kV and 330 kV circuits; b) V6 … V9; V16 … V19 – there are HTLS conductors for both 110 kV and 330 kV circuits; c) V2 … V5; V12 … V15 – there are conductors of the traditional type with a combination with HTLS conductors for 110 kV and 330 kV circuits (see Fig. 5). Table 2 The combinations of the examined variants
Combinations V1 V2 V3 V4 V5 V6 V7 V8 V9 V10
Invested capital (IC), p.u. Optimistic scenario 1 5.22 5.23 5.23 4.70 4.69 4.95 4.53 4.95 4.41 4.30
Combinations V11 V12 V13 V14 V15 V16 V17 V18 V19 V20
Invested capital (IC), p.u. Pessimistic scenario 2 4.85 4.86 4.86 4.37 4.36 4.60 4.21 4.60 4.10 3.93
Fig. 5 reflects the optimum solution results of two-objective optimization by implementing Pareto approach [26], where IC (p.u.) is the invested capital and E (kV/m) is the strength of the electrical field. As a result, the competitive variants are V6, V7, V9, V10, V15, V17, V19 and V20. The resulting values of the optimization criteria are summarized in Table 3 (only competitive alternatives are left for further consideration). Analysis of the table reveals the following: 1. If the “classical” problem formulation, namely, maximization of the NPV, complying with all the constrains, would be used, one of the alternatives V10 would be chosen. The final decision would be taken using one of the criteria in [19]. 2. If violation of the constraint is allowed, one of the alternatives V17 or V19 should be chosen. Table 3 Expected worth of Net Present Value and constrain indicators Ri Alternatives V10 V17 V19
Optimistic scenario 1 NPV11||R11 4.7 // 6.9 6.2 // 7.1 6.7 // 8.0
Pessimistic scenario 2 NPV11||R11 5.4 / 5.0 5.33 / 5.6 5.7 / 7.3
Fig. 5. A diagram of Pareto set for the combination variants
The risks of the emergence of conditions leading to changes in operation, in its turn leading to additional economic losses, were estimated in order to make the final decision. Violation of limits of the strength of the electric field for the considered example for the Latvian climate can arise at the maximum air temperature of +35C and the maximum load current. The combination of these two conditions has a very low probability; for the alternative V10 it is 0.01, while for the alternative V17 0.000001 (both probabilities are estimated considering the optimistic scenario). After taking into consideration the above-mentioned probabilities, the alternative V17 was chosen as a final decision for real-life implementation; besides, to satisfy the required legislative conditions for the electric field, permanent monitoring and operation is needed. 4. CONCLUSIONS The latest tendencies in the development of power systems – deregulation of the electricity market, introduction of new technologies and increase of distributed and renewable generation – considerably influence the process of transmission network planning. The new methods are required to be able to facilitate decisionmaking resulting in reduced invested capital and power losses, and improved reliability and power quality. The problem of optimization of the design of transmission lines is a multicriteria optimization task with a large number of state and decision variables. This task has to be formulated taking into consideration the possible influence of
random and uncertain parameters. The solution of such a problem is associated with considerable mathematical, computational and informational difficulties. Utilization of multi-criteria optimization partially based on the stochastic approach ensures the possibility to consider even the alternatives with constraint violations which with some additional measures can represent the most costeffective solution. In this work, the OHL design method, which is partially based on a stochastic approach and game theory criteria, was used for the final decisionmaking. As a result, it can be concluded that, if the maximization of the NPV would be used, complying with all the constrains, one of the alternatives, namely, V10, would be chosen, the final decision would be taken using one of the main technical, mechanical and environmental criteria. At the same time, if constraint violation is allowed using several preventing actions, for example, permanent monitoring and operation of the examined line model, then one of the alternatives V17 or V19 should be chosen. The final decision is based on the probability of occurrence of one of the selected variants, the alternative with the smallest probability value has to be chosen; and in this case, it is V17.
ACKNOWLEDGEMENT This work has been supported by the European Social Fund within the project «Support for the implementation of doctoral studies at Riga Technical University». This work has been supported by the Latvian National Research programme “Technologies for Innovative Production and Use of Energy Resources and Provision of Low Carbon Emissions by Means of Renewable Energy Resources, Support Measures for the Mitigation of Environmental and Climate Degradation LATENERGI”.
REFERENCES 1. A. L΄ Abbate, G. Migliavacca, T. Pagano, A. Vafeas. (2011) Advanced transmission technologies in Europe: a roadmap towards the Smart Grid evolution. In IEEE PowerTech Conf., 19-23 June. (pp. 1-8) Trondheim, Norway: IEEE. DOI: 10.1109/PTC.2011.6019186 2. Dale A. Douglass. (2004) Practical application of High-Temperature Low-Sag (HTLS) Transmission Conductors. New Haven, Connecticut, p. 53. 3. Ravi Gorur, Barzin Mobasher, Robert Olsen. (2009) Characterization of Composite Cores for High Temperature-Low Sag (HTLS) conductors. Final project report. PSERC Publication 09-05. June, p. 52. 4. S. S. Karimi Madahi, M. Hassani. (2012) Optimal design of insulators of using Artificial Neural Network (ANN). Journal of Basic and Applied Scientific Research 2 (1), pp. 60-64. 5. G. Visweswara Rao. (1995) Optimum designs for transmission line towers. Computers & Structures, Vol. 57, No. 1, pp. 81-92.
6. L. Ekonomou, D. P. Iracleous, I. F. Gonos, I. A. Stathopulos. (2006) An optimal design method for improving the lightning performance of overhead high voltage transmission lines. Electric Power Systems Research 76, pp. 493-499. 7. The special program “SAPR LEP 2011” description. Modern design System. [Online]. Available: http://www.bsapr.ru/prod/progs/element.php?ID=250 [in Russian]. 8. PLS-CADD™ (Power Line Systems - Computer Aided Design and Drafting). [Online]. Available: http://www.powline.com/products/pls_cadd.html 9. King Fahd University of Petroleum and Minerals: Chapter 7 Net Present Value and Other Investment Criteria. [Online]. Available: http://faculty.kfupm.edu.sa/FINEC/mfaraj/fin301/notes/Ch7.pdf 10. W.S. Chang, C.D. Zinn. (1976) Minimization of the cost of an electrical transmission line system. IEEE Trans. PAS 95 (4), pp. 1091–1098. 11. I.S. Grant, R.E. Clayton. (1987) Transmission line optimization. IEEE Trans. Power Deliv. 2 (2), pp. 520–526. 12. R.E. Kennon, D.A. Douglass. (1990) EHV transmission line design opportunities for cost reduction", IEEE Trans. Power Deliv. 5 (2), pp. 1145– 1152. 13. L. Ekonomou, G. P. Fotis, T. I. Maris. (2008) Cost related optimum design method for overhead high voltage transmission lines. Euro, Trans. Electr. Power 18, pp. 437-447. 14. M.M. Saied, M. Jaboori, D. El-Nakid. (1990) On the optimal design of high voltage overhead transmission lines. J. Electr. Mach. Power Syst. 18 (3), pp. 293-312. 15. Kjetil Bevanger, Gundula Bartzke, Henrik Brøseth, Espen Lie Dahl, Jan Ove Gjershaug, Frank Hanssen, Karl-Otto Jacobsen, Pål Kvaløy, Roel May, Roger Meås, Torgeir Nygård, Steinar Refsnæs, Sigbjørn Stokke, Jørn Thomassen. (2011) Optimal design and routing of power lines; ecological, technical and economic perspectives (OPTIPOL). Progress Report – NINA Report 762, pp. 52. 16. V. Neimane. (2001) On development planning of electricity distribution networks. Ph.D. thesis, Royal Inst. Of Technology, Stockholm, Sweden. 17. Lebesgue-Stieltjes integrals. [Online]. Available: http://www.math.sunysb.edu/~daryl/ls.pdf 18. János Fülöp. Introduction to Decision Making Methods. [Online]. Available: http://academic.evergreen.edu/projects/bdei/documents/decisionmakingmethods .pdf 19. Svetlana Beryozkina, Antans Sauhats, Edvins Vanzovichs. (2011) Climate Conditions Impact on the Permissible Load Current of the Transmission Line. In Proc. IEEE PowerTech Conf., 19-23 June 2011. (pp. 1-6) Trondheim, Norway: IEEE. DOI: 10.1109/PTC.2011.6019252 20. Overhead electrical conductors-Calculation methods for stranded bare conductors, IEC 1597. 21. Мисриханов М.Ш., Иостсон Ю.А., Рубцова Н.Б., Токарский А.Ю., The electromagnetic parameters of overhead power transmission lines. Certificate of official registration of computer software, No. 2006613744, October 27, 2006. // Software for computers, databases and topology of integral microcircuits. Official Bulletin of the Federal Service of Intellectual
Property, Patents and Trademarks – No. 1 (58) – М. – Federal State Institution “Federal Industrial Property Institute”, – 2007. [in Russian]. 22. ICF Consulting. (2002, Oct.). Unit Costs of constructing new transmission assets at 380kV within the European Union, Norway and Switzerland, Final Report. [Online]. Available: http://ec.europa.eu/energy/electricity/publications/doc/comp_cost_380kV_en.p df 23. Alison Silverstein. (2011) NCEP Transmission Technologies Workshop. April 20-21. [Online]. Available: http://www.naruc.org/grants/Documents/Silverstein%20NCEP%20T101%200420111.pdf 24. F. Ridley Thrash, Jr. Transmission Conductors - A review of the design and selection criteria". [Online]. Available: http://www.southwire.com/support/TransmissionConductoraReviewOfTheDesi gnandSelectionCriteria.htm 25. Powering the next generation. (2007) Composite Technology Corporation. V8.4 Public NYC. [Online]. Available: http://ctc-energy.com/products/files/block_1/page12_2.pdf 26. V. Pareto. (1896) Cours D'Economie Politique, Vol. I and II. F. Rouge, Lausanne. ELEKTROPĀRVADES LĪNIJAS DAUDZKRITERIĀLĀ OPTIMIZĀCIJA S. Berjozkina, A. Sauhats, V. Neimane Kopsavilkums Elektropārvades tīklam rodas nepieciešamība pēc jauniem elektriskajiem pieslēgumiem, kas noved pie esošo gaisvadu līniju jaudas nepietiekamības. Viens no iespējamajiem pastāvošās problēmas risinājumiem ir jaunu gaisvadu līniju un apakšstacijas būvniecība. Gaisvadu līniju projektēšana ir saistīta ar ievērojamām tehniskām, vides un ekonomiskām problēmām. Darbā aprakstīta elektropārvades līnijas optimālās trases izvēles daudzkritēriju optimizācijas koncepcija, ieskaitot balstu tipa, balstu izvietojuma koordināšu, balstu ģeometrijas, vadu tipu un parametru, izolatoru tipu, vibroslāpētāju tipu, zibensaizsardzības un zemēšanas sistēmu, kā arī laidumu garumu izvēles optimizāciju. Optimizācijas uzdevums tiek organizēts piecos posmos. Pirmajā un otrajā posmā tiek meklēta optimālo risinājumu kopa, kā arī noteikti galvenie ietekmējošie faktori. Nākamie divi posmi atspoguļo divkritēriju optimizāciju, izmantojot Pareto pieeju. Pēdējā posmā, kas ilustrēts ar situācijas piemēru, tiek novērtēta ierobežojumu pārkāpumu nosacījumu rašanās varbūtība. Tiek identificēts cēlonis un tā novēršanas metodes. Atspoguļotā pieeja ir balstīta uz reālas līnijas projektēšanas piemēra ar galveno mērķi – mazināt kopējo ieguldīto kapitālu un palielināt pašreizējo neto vērtību. Iegūtie rezultāti aplūkoti šajā darbā. 31.05.2013