LETTER
doi:10.1038/nature14238
Multi-omics of permafrost, active layer and thermokarst bog soil microbiomes Jenni Hultman1{, Mark P. Waldrop2, Rachel Mackelprang3,4, Maude M. David1, Jack McFarland2, Steven J. Blazewicz2, Jennifer Harden2, Merritt R. Turetsky5, A. David McGuire6, Manesh B. Shah7{, Nathan C. VerBerkmoes7, Lang Ho Lee8, Kostas Mavrommatis4{ & Janet K. Jansson1,4,9,10{
Over 20% of Earth’s terrestrial surface is underlain by permafrost with vast stores of carbon that, once thawed, may represent the largest future transfer of carbon from the biosphere to the atmosphere1. This process is largely dependent on microbial responses, but we know little about microbial activity in intact, let alone in thawing, permafrost. Molecular approaches have recently revealed the identities and functional gene composition of microorganisms in some permafrost soils2–4 and a rapid shift in functional gene composition during short-term thaw experiments3. However, the fate of permafrost carbon depends on climatic, hydrological and microbial responses to thaw at decadal scales5,6. Here we use the combination of several molecular ‘omics’ approaches to determine the phylogenetic composition of the microbial communities, including several draft genomes of novel species, their functional potential and activity in soils representing different states of thaw: intact permafrost, seasonally thawed active layer and thermokarst bog. The multi-omics strategy reveals a good correlation of process rates to omics data for dominant processes, such as methanogenesis in the bog, as well as novel survival strategies for potentially active microbes in permafrost. We collected replicate permafrost soil cores (including the seasonally thawed active layer) from a permafrost plateau and an adjacent young thermokarst bog from a site in interior Alaska that represents future anticipated ecosystem transformations as permafrost thaws7. Owing to the recognized difficulty in cultivating the majority of microorganisms from soil8, we combined several culture-independent ‘omics’ approaches: targeted 16S rRNA gene sequencing (16S) to determine the microbial community composition; total metagenomic DNA sequencing (MG) to determine the complement of phylogenetic and functional genes; total metatranscriptome RNA sequencing (MT) to determine which genes were expressed; and shotgun mass spectrometry-based metaproteomics (MP) to determine which proteins were produced. Together these analyses resulted in a large amount of data including 84.2 gigabases (Gb) of MG sequence, 20.4 Gb of MT sequence and approximately 7,000 proteins, which are among the highest yields obtained for any soil type so far9,10. We also compared the different molecular approaches among each other and to measured process rates. We analysed relative differences in gene expression among samples on the basis of the ratio of functional gene transcripts to genes (MT/MG). The permafrost, active layer and thermokarst bog soils had a unique complement of genes, transcripts and proteins (Extended Data Fig. 1). Bacteria and Archaea dominated the data, with only a small fraction corresponding to fungi (MG 0.07 6 0.04%, MT 0.41 6 0.47%, zero in MP), so we omitted fungi from further analyses. There was greater overlap
in shared genes between the soils, compared with transcripts and proteins (Extended Data Figs 1 and 2). Permafrost had fewer and more unique transcripts and proteins than active layer and thermokarst bog soils (Extended Data Figs 1 and 2). By contrast, many transcripts were shared between the bog and active layer, including many transporters (Extended Data Figs 1d and 3). The most abundant bacteria found in the permafrost soil on the basis of 16S were members of Chloroflexi (19.2 6 6.3% s.d.), Proteobacteria (17.9 6 1.3%) and Actinobacteria (12.5 6 3.1%) (Fig. 1a). Similar distributions were observed in 16S, MG and MT data sets (correlation coefficient r . 0.9 for 16S:MG and MG:MT; r . 0.8 for 16S:MT, Fig. 1b). However, some differences were found, such as higher representation of Actinobacteria in MG than 16S (27% and 12%, respectively; P 5 0.007), partly explained by biases used in the 16S approach. Also, some phyla were more or less represented in the MT than the 16S and MG data, and we propose that these differences can be used to predict their relative activity at the time the samples were collected. In permafrost, the MT/MG ratios were highest for Proteobacteria (MT/MG 5 1.7), Acidobacteria (MT/MG 5 1.4), and Firmicutes (MT/MG 5 1.6), suggesting that these representatives were acclimated to be active in subzero temperatures (Fig. 1b). Also, binning of MG assemblies from permafrost resulted in a draft genome of a novel Acidobacterium (PF_ 400, Extended Data Table 1) with closest sequence similarity to ironreducing Acidimicrobium ferrooxidans (Genome-to-Genome Distance Calculator11 DNA–DNA hybridization (DDH) 19.60% 6 2.30). The draft genome contained many interesting features including genes involved in Fe(III) transport, and cytochromes putatively involved in iron uptake and reduction (Extended Data Table 1). The genetic capacity for iron reduction in permafrost correlated well with dissimilatory Fe(III) reduction rates measured at the site (Table 1). The active layer exhibited both more species and functional diversity than the other two soils (Fig. 1a), consistent with previous findings2,3,12. Members of the Actinobacteria, Acidobacteria and Proteobacteria phyla had the highest MT/MG ratios (Fig. 1b), suggesting that they were among the most active members in the seasonally thawed soil. A draft genome of a novel member of one of the Proteobacteria (AL_334) was also obtained from the active layer MG (Extended Data Table 1). Functional screening of the MG and MT data revealed many genes involved in specific biogeochemical cycles, including those for denitrification, nitrate reduction, iron reduction and methane oxidation (see Supplementary Information for brief overview), correlating with process measurements at the site (Table 1).
1
Earth Sciences Division, Lawrence Berkeley National Laboratory, 1 Cyclotron Road, Berkeley, California, 94720, USA. 2US Geological Survey, 345 Middlefield Road, Menlo Park, California 94025, USA. Biology Department, 18111 Nordhoff Street, California State University Northridge, Northridge, California 91330, USA. 4US Department of Energy Joint Genome Institute, 2800 Mitchell Drive, Walnut Creek, California 94598, USA. 5Department of Integrative Biology, 50 Stone Road East, University of Guelph, Guelph, Ontario N1G 2W1, Canada. 6US Geological Survey, Alaska Cooperative Fish and Wildlife Research Unit, 211A Irving I Building, University of Alaska Fairbanks, Fairbanks, Alaska 99775, USA. 7Chemical Sciences Division, One Bethel Valley Road, Building 1059, Oak Ridge National Laboratory, Oak Ridge, Tennessee 37831-6420, USA. 8Graduate School of Genome Science and Technology, University of Tennessee and Oak Ridge National Laboratory, 2510 River Drive, Knoxville, Tennessee 37996, USA. 9Department of Plant and Microbial Biology, 111 Koshland Hall, University of California, Berkeley, Berkeley, California 94720, USA. 10Center for Permafrost Research (CENPERM), Department of Biology, Universitetsparken 15, University of Copenhagen, Copenhagen, DK-2100 Copenhagen, Denmark. {Present addresses: Department of Food Safety and Environmental Health, Agnes Sjo¨bergin katu 2, University of Helsinki, Helsinki 00014, Finland (J.H.); Oak Ridge National Laboratory, Biosciences Division, Tennessee 37831, USA (M.B.S.); Celgene Corporation, 1500 Owens Street, San Francisco, California 94158-2335, USA (K.M.); Biological Sciences Division, Pacific Northwest National Laboratory, 902 Battelle Boulevard, Richland, Washington 99352, USA (J.K.J.).
3
0 0 M O N T H 2 0 1 5 | VO L 0 0 0 | N AT U R E | 1
©2015 Macmillan Publishers Limited. All rights reserved
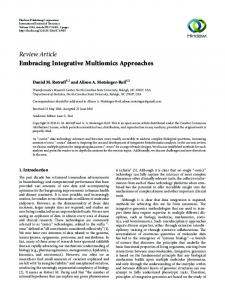
RESEARCH LETTER Figure 1 | Microbial phylogenetic composition in permafrost, active layer and thermokarst bog soils. a, Relative abundance of phyla on the basis of targeted 16S rRNA gene sequencing (16S), 16S rRNA gene reads from metagenomes (MG) and from metatranscriptomes (MT). The data represent the average of four replicates for 16S, two for MG and two for MT, except for permafrost MT which was obtained from only one sample owing to low RNA yield. b, Ratios of average relative abundance of ten abundant phyla in the metatranscriptomes relative to the metagenomes (MT/MG). Blue, permafrost; green, active layer; pink, bog. Bars marked with an asterisk are significantly different (two-tailed t-test, a P value of 0.05 was used as the significance level) from MT/MG 5 1.0, to highlight potentially relatively higher activity.
a
Relative abundance (%)
100
WS2 Crenarchaeota Others Spirochaetes Fibrobacteres OP3 C2 ZB2 TM7 Unknown Verrucomicrobia Caldiserica/OP5 AD3 Chlorobi Planctomycetes OP11 Gemmatimonadetes Euryarchaeota Firmicutes Bacteroidetes Acidobacteria Chloroflexi Actinobacteria Proteobacteria
80
60
40
20
0
16S rRNA MG
MT
16S rRNA MG
Permafrost
MT
16S rRNA MG
MT
Thermokarst bog
Active layer
b Crenarchaeota OP11 * Gemmatimonadetes
* * *
Euryarchaeota Firmicutes
*
Bacteroidetes Acidobacteria Chloroflexi Actinobacteria Proteobacteria
* 0
0.2
0.4
0.6
0.8
1
1.2
1.4
1.6
1.8
2
Ratio of average relative abundance (MT/MG)
In the thermokarst bog, the combined omics data correctly predicted that methanogenesis was predominant where high rates of methane production were observed (Table 1 and Fig. 2). Several genes involved in methanogenesis (mcrABG) were detected in the MG and MT data sets. The MT/MG ratios for methanogenesis were higher in the bog than any other site (Fig. 2). Also, the Euryarchaea had high MT/MG ratios of 1.69 6 1.14 (Fig. 1b), and methanogen 16S rRNA gene sequences, transcripts and proteins were highly abundant (Figs 1–3). Of all the 16S sequences, 6.8–10.5% were assigned to Methanosarcina, a metabolically
diverse methanogen that can produce methane using a variety of metabolic routes, including the acetoclastic pathway (Fig. 1a and Extended Data Fig. 4). We also binned three draft methanogen genomes from the bog MG (Extended Data Table 1), with the largest bin, Bog_15, containing genes for methane production via the hydrogenotrophic route, several of which were expressed and detected in the MT and the MP as well (Extended Data Table 1). A methanogen genome binned from an arctic wetland MG, Methanoflorens stordalenmirensis, was recently reported4, with low sequence similarity to those we found here (DDH
Table 1 | Soil characteristics and process rates from the permafrost, active layer and thermokarst bog Permafrost Plant community
Soil dissolved organic carbon (mg g21) Soil total dissolved nitrogen (mg g21) pH Aerobic respiration (mg C h21 g21) Anaerobic respiration (mg C h21 g21) Methanogenesis (ng C h21 g21) Denitrification (ng N2O h21 g21) Nitrate reduction (ng NO3 h21 g21) Fe reduction (ng Fe h21 g21) Sulphate reduction (ng SO4 h21 g21) Aerobic methane oxidation (ng C h21 g21) Moisture (%) Electrical conductivity (mSiemens)
0.08 6 0.01{ 0.02 6 0.002{ 5.76 6 0.16* 0.09 6 0.01{ 0.02 6 0.002{ ND 1.0 6 0.7{ 0.19 6 0.10* 10.0 6 8.0{ 2.9 6 0.7{ NA 58.2 6 3.3{ 379 6 53*
Active layer
Bog
Black spruce/feathermoss
Sphagnum moss
1.05 6 0.18* 0.08 6 0.01* 4.69 6 0.10{ 0.09 6 0.01{ 0.03 6 0.01{ ND 3.0 6 0.8*{ 0.40 6 0.08* 26.2 6 3.1* 4.2 6 0.6*{ 200 6 150 81.4 6 2.7* 272 6 19*
0.95 6 0.21* 0.07 6 0.01* 4.88 6 0.02{ 1.61 6 0.40* 1.21 6 0.27* 454 6 150 6.4 6 1.4* 132 6 36{ ND 71 6 17* 700 6 400 83.5 6 1.2* 242 6 13*
Units are means 6 1 s.e.m. ND, not detected; NA, not determined. Footnote symbols (*, {) denote significant differences among soils (P , 0.05).
2 | N AT U R E | VO L 0 0 0 | 0 0 M O N T H 2 0 1 5
©2015 Macmillan Publishers Limited. All rights reserved
LETTER RESEARCH a
b
Permafrost 21
Active layer 20
MT/MG ratio
2
16
1.6
12
1.2 8 0.8 4
0.4 0
Met
Thermokarst bog
c
0
Nif Amm Denit Mox Sul
25
Methanogenesis Nitrogen fixation Ammonia uptake Denitrification Methane oxidation Sulphur cycling
20
6 MT/MG ratio
Nif Amm Denit Mox Sul
Cross zone comparison
d
8
Met
15 4 10 2
5
0 Met
0
Nif Amm Denit Mox Sul
Permafrost Active layer
Bog
Figure 2 | Average MT/MG ratios. a, Permafrost; b, active layer; c, thermokarst bog soils for two replicate cores. d, Comparison of MT/MG on the same plot. Error bars, s.e.m. Amm, ammonia uptake; Denit, denitrification; Met, methanogenesis; Mox, methane oxidation; Nif, nitrogen fixation; Sul, sulphate reduction.
20.60–37.30%). Closest sequenced relatives to our draft genomes were Methanosarcina acetivorans (Bog_301, 69.70% 6 2.92) and Methanosaeta concilii (with Bog_232 46.60% 6 2.58 and Bog_15 42.70 6 2.53 DDH similarity (Extended Data Table 1)); thus they represent previously undescribed methanogen genomes. Two novel Chloroflexi draft genomes were also binned from the bog MG (Extended Data Table 1). One of them, Bog_440, with closest similarity to a representative of the genus Anaerolinea (A. thermophila, DDH 15.20% 6 2.14), was phylogenetically similar to a dominant operational taxonomic unit (OTU) in the 16S data (Fig. 1a and SOGA31 in Extended Data Fig. 5) and has previously been reported as abundant in
other arctic samples on the basis of 16S3,13, but represents an undersampled phylum with few isolates and none with sequence similarity to those we found here. Draft Bog_440 possessed some genes involved in sulphate reduction and iron utilization (Extended Data Table 1), suggesting that it may play a role in these processes. The metaproteomics data enabled us to detect the dominant microbial proteins actually produced and/or stabilized in the soil. Most of the proteins matched to the metagenomes and many were ‘uncharacterized’ or ‘hypothetical’ (Table 2 and Supplementary Table 1), or predicted to be involved in housekeeping functions (Extended Data Fig. 1 and Fig. 4). In permafrost, we detected a relatively high representation of cold-shock proteins, presumably for survival under frozen conditions (Fig. 4a and Supplementary Table 1). Surprisingly, proteins involved in chemotaxis and motility were also observed in permafrost (Supplementary Table 1), suggesting that some members of the community had the capacity for motility. Fewer transporters were detected in permafrost than active layer and bog soils (Fig. 4a and Supplementary Table 1), as also reflected by lower levels of transporter transcripts in permafrost (Extended Data Supplementary Fig. 3). Several cold-shock proteins were also detected in the active layer (Fig. 4b), reflecting the need for the community to cope with not only the seasonal shifts in temperatures, but also exposure to extreme freezing conditions. Other abundant proteins in the active layer included several transporters (Extended Data Fig. 1, Fig. 4b and Supplementary Table 1), indicative of greater potential for microbial transport of nutrients in the thawed soils (Extended Data Figs 1b, d and 3). Unlike the permafrost and active layer, there were fewer proteins linked to cold tolerance and other stress-related reactions in the bog soils (7%, 14% and 12% in bog, active layer and permafrost, respectively) (Supplementary Table 1). In addition to proteome searches against the matched metagenomes, we also performed searches to microbial genomes: 180 environmental isolates, plus an additional 13 recently sequenced isolates from cold environments (Supplementary Table 3). Rhodoferax ferrireducens had many (58) protein matches in permafrost (Table 2 and Supplementary Table 1) although it was relatively rare in the MT (,0.001%), MG (,0.005%) and 16S sequences (0.1%). Several proteins were also assigned to some betaproteobacteria, nitrifiers, acidobacteria, facultative methylotrophs (Fig. 4a and Supplementary Table 1) and to several psychrophile isolates (Fig. 4a and Extended Data Table 2). More proteins were assigned to a wider range of the reference genomes in the active layer than permafrost soil (Table 2), indicating a larger diversity of active species in this soil, including several Proteobacteria, in addition to 11 of Table 2 | Twenty most abundant hits of metaproteome data to genomes/metagenomes Reference metagenome/genome
50
Pink = bog Green = active layer Blue = permafrost
30 3.0 20
)
2.5
0.4
0.6
0.8
1.0
1.2
ra at et
0 0.2
M
0 0.0
ip
1.0 0.5
cr
10
to m
e
(%
2.0 1.5 ns
Metaproteome (%)
40
1.4
Metagenome (%)
Figure 3 | Relationships among MG, MT and MP for nitrogen cycling (circle), sulphur cycling (square) and methanogenesis (triangle) in permafrost (blue), active layer (green) and thermokarst bog soils (pink). Points represent the sum of all data involved in the particular process.
Permafrost
Active layer
41.6 6 3.3 32.3 6 7.4 54.6 6 37.4 50.5 6 8.2 38.4 6 0.3 46.6 6 4.8
Permafrost metagenome Active layer metagenome Bog metagenome
Methane production/oxidation Nitrogen cycle Sulphur cycle
Bradyrhizobium japonicum USDA 110 Burkholderia xenovorans LB400 Arthroderma benhamiae CBS 112371 Rhodopseudomonas palustris CGA009 Nitrobacter winogradskyi Nb-255 Burkholderia cepacia 383 Delftia acidovorans SPH-1 Methanosaeta concilii GP-6 Methanosarcina mazei Go1, DSM 3647 Solibacter usitatus Ellin6076 Nitrobacter sp. Nb-311A Rhodoferax ferrireducens T118 Acidovorax sp. JS42 Ensifer medicae WSM419 Ralstonia solanacearum GMI1000 Methylobacterium nodulans ORS 2060
2.6 6 1.1 2 6 2.3 0.3 6 0.4 1.0 6 0.3 1.8 6 0.8 1.5 6 1.7 1.4 6 1.9 0.1 6 0.0 0.0 6 0.0 1.3 6 1.1 0.9 6 0.2 4.0 6 2.6 1.9 6 1.6 1.9 6 2.5 1.8 6 1.6 1.7 6 1.2
6.3 6 2.1 3.0 6 2.1 2.8 6 3.2 2.4 6 1.4 2.2 6 0.9 2.0 6 1.1 1.9 6 1.7 0.0 6 0.0 0.0 6 0.0 1.6 6 0.9 1.7 6 1.3 1.7 6 0.9 1.6 6 1.0 0.4 6 0.4 1.8 6 0.8 1.2 6 0.2
Bog
21.1 6 12.3 21.8 6 22.5 73.3 6 10.7 2.6 6 2.1 0.1 6 0.1 2.3 6 2.7 1.5 6 1.5 1.0 6 0.9 0.1 6 0.1 0.4 6 0.6 2.7 6 2.3 2.0 6 0.4 1.5 6 1.0 1.1 6 0.9 0.5 6 0.6 0.4 6 0.5 0.4 6 0.0 0.3 6 0.2 1.0 6 0.3
The ten most abundant database hits are highlighted in bold for each soil. Each metagenome data set (first three rows) was obtained from the same source sample as the metaproteomes. Based on the average normalized spectral abundance factor (NSAF) values and standard deviation of four replicate Velos/Orbitrap mass spectrometer runs for each soil.
0 0 M O N T H 2 0 1 5 | VO L 0 0 0 | N AT U R E | 3
©2015 Macmillan Publishers Limited. All rights reserved
RESEARCH LETTER
Urea
Fe
P
Flagella
Fe 9
8 CO dehydrogenase Phasin
11
10
MGS
cydB
crtH
BlaR1
GR
gltB
cysG
sufS
PHA
Glucose dehydrogenase
glnA
Translation elongation Glycolysis/gluconeogenesis factor Tu 1 2 3 4 Ribosomal proteins L5, S8, L4/L1e, L25/23, L9
glpK
glnA
Phasin
5
CO2
5
mcrA
TCA cycle
Ribosomal proteins S8, S3, L1
mcrB
RNA polymerase
GroEL GroES chaperones
7
6
Glutamate synthase
glnB
CH4
1. Acetate-CoA ligase 2. Glyceraldehyde-3-phosphate dehydrogenase 3. Pyruvate kinase 4. Aldehyde ferredoxin oxidoreductase 5. Malate dehydrogenase Bradyrhizobium japonicum 6. Succinyl-CoA synthetase Rhodoferax ferrireducens 7. Succinate dehydrogenase/fumarate reductaseflavoprotein 8. K+ transporting ATPase Nitrobacter sp. 9. Potassium-transporting ATPase subunit B 10. MCP Winogradskyella psychrotolerans 11. SusD, outer membrane protein
Porins
Permafrost metagenome Methylobacterium sp.
ATP synthase ABC transporter Other transporter
K
c553
lemA lemA
asa
lip
Bacterioferritin
flot
lpxD
PHA
CO dehydrogenase glnA Glycolysis/ gluconeogenesis
Cold shock monoxB
1
2
1
2
3
11 12
4
gfa
ohr
sod
5 TCA cycle
MutS
7
6
14
8
8
9
9
pdp
glnB
Pentose phosphate pathway
uvrC rbr
metK
gfa
Phasin
pqq-dh
asd
nor
CO dehydrogenase
Phasin
iolD
glnB
mxaF
13
infB
rho
Translation elongation factor Tu
rho
10 10 RNA polymerase
Translation initiation factor
RNase
GroEL GroES chaperones
Ribosomal proteins
Active layer metagenome
Porins
6. 7. 8. 9. 10. Glyceraldehyde-3-phosphate dehydrogenase 11. Pyruvate kinase 12. Phosphopyruvate hydratase 13. Malate dehydrogenase 14. Pyruvate phosphate dikinase Bradyrhizobium japonicum
ATP synthase
Solibacter usitatus
1. 2. 3. 4. 5.
ABC transporter Other transporter
Citrate synthase Succinyl CoA synthetase Acetyl-CoA acetyltransferase Alcohol dehydrogenase Aldehyde dehydrogenase Glucose dehydrogenase Gluconolactonase 6-Phosphogulconate dehydrogenase Response regulator of citrate/malate metabolism
Flagella p
lem lip
HdrA
Melibiase
glnA mips
gldh
ggt
glpK
pas
PKG ilvE
glnB
CO dehydrogenase
Glycolysis/ gluconeogenesis 1
2
3
4
CO dehydrogenase CO dehydrogenase
5
Bacterioferritin
nifH
PRC barrel
Translation infB initiation factor Translation elongation factors Tu, EF1, GTPase
3 moxR 6 7
exo
CO dehydrogenase (aerobic-type)
glnB
pas
mo
dhaK
dCXXCH
glnB
8
Porins
9 TCA cycle
Ribosomal proteins
ptol
11
Cold shock
mtd mer
hup
mtrA
mtrH
mcrA
mcrB
mcrA
mcrB
dnaK thr
dsrA
CO2
mcrB
10 thr
ccp
GroEL GroES chaperones
RNase RNA polymerase
mcrG
12
CH4
Bog metagenome
4. NAD-dependent aldehyde dehydrogenases 5. Phosphoenolpyruvate synthase/pyruvate phosphate dikinase (EMP in archaea) 6. Pyruvate phosphate dikinase Bradyrhizobium japonicum 7. Dihydrodipicolinate synthase 8. Glucose/sorbosone dehydrogenase Methanoflorens stordalenmirensis 9. Acetoacetate decarboxylase ABC transporter 10. Pyruvate/2-oxoglutarate dehydrogenase complex 1. 6-Phosphofructokinase 11. Acetyl-CoA synthetase Other transporter 2. Glyceraldehyde-3-phosphate dehydrogenase 12. Coenzyme F420-reducing hydrogenase, alpha 3. Acetyl-CoA acetyltransferase and beta subunit Methanosaeta concilii
ATP synthase
4 | N AT U R E | VO L 0 0 0 | 0 0 M O N T H 2 0 1 5
©2015 Macmillan Publishers Limited. All rights reserved
Figure 4 | Visualization of proteins identified from metaproteomics data sets. a, Permafrost; b, active layer; c, thermokarst bog soils. The proteins were identified by searching against databases comprising matched metagenomes from each site and for genomes from selected sequenced microbial isolates. Grey shading indicates predicted proteins that were not detected. Key to abbreviations: asa, arylsulphatase A; asd, aspartatesemialdehyde dehydrogenase; BlaR1, regulatory sensor-transducer, BlaR1/MecR1 family; c553, cytochrome c-553; ccp, cytochrome c peroxidase; crtH, carotenoid cis-transisomerase; cydB, cytochrome d ubiquinol oxidase subunit I; cysG, uroporphyrinogen-III methyltransferase; dcxxch, doubled CXXCH domain containing protein; dhaK, dihydroxyacetone kinase; dnaK, DnaK chaperone protein; dsrA, sulphite reductase subunit A; exo, exosome complex exonuclease 1; flot, flotillin protein; gfa, S-(hydroxymethyl) glutathione synthase; ggt, c-glutamyltransferase; gldh, glutamate dehydrogenase; glnA, glutamate synthetase; glnB, nitrogen regulatory protein P-II; glpK, glycerol kinase; gltB, ferredoxin-dependent glutamate synthase; GR, glutathione reductase-like proteins; HdrA, heterodisulphide reductase subunit A and related polyferredoxins; hflC, hydrolase serine protease transmembrane protein; hup, heterosulphide reductase; ilvE, branchedchain amino-acid aminotransferase; infB, translation initiation factor IF-2; iolD, malonic semialdehyde oxidative decarboxylase; lem, peptidoglycan-associated lipoprotein dehydrogenase; lemA, outer membrane protein and related peptidoglycan-associated; (lipo) proteins; lip, periplasmic or secreted lipoprotein; lpxD, UDP-3-O-(3-hydroxymyristoyl) glucosamine N-acetyl transferase; mer, 5,10-methylenetetrahydromethanopterin reductase; metK, methionine adenosyltransferase; MGS, methylglyoxal synthase; mips, myoinositol-1-phosphate synthase; mo, methane monooxygenase/ammonia monooxygenase; monoxB, Monooxygenase subunit B protein; moxR,MoxR family protein; Mtd, coenzyme F420-dependent N(5),N(10)-; methenyltetrahydromethanopterin; mte, MotA/TolQ/ExbB proton channel; mtrA, N5-methyltetrahydromethanopterin,coenzyme M; methyltransferase subunit A; mtrB, decahaemassociated outer membrane protein; mtrH, tetrahydromethanopterin S-methyltransferase, subunit H; mutS, mismatch repair ATPase (MutS family); mxaF, methanol dehydrogenase; napC, NapC/Nir T cytochrome c family; nor, nitrous oxide accessory protein; ohr, peroxiredoxin, Ohr subfamily; opa, opacity protein; p, TonBdependent receptor plug; pas, PAS domain S box; pdp, pyrimidine-nucleoside phosphorylase; PKG, phosphoglycerate kinase; pqq-dh, PQQ-dependent dehydrogenase methanol/ethanol family; PSP, phosphate-selective porin; ptol, periplasmic component of the Tol biopolymer transport system; rbr, rubrerythrin; rho, transcription termination factor Rho; RNase, ribonuclease E; rng, ribonuclease G; sod, superoxide dismutase; thr, thermosome; uvrC, exinuclease ABC, C subunit.
LETTER RESEARCH the R. ferrireducens proteins mentioned above (Supplementary Table 1), and to some of the psychrophile isolates with the majority matching to Rhodonellum psychrophilum and Winogradskyella psychrotolerans (Supplementary Table 3). In the bog, several proteins matched to methanogens, including Methanosarcina mazei, Methanosaeta concilii, Methylobacterium nodulans, Methanoflorens stordalenmirensis (Table 2, Supplementary Table 3 and Fig. 4c) and to our draft methanogen genomes, reflecting the high rates of methanogenesis in the bog. These included proteins involved in methanogenesis, nitrogen metabolism, iron transport and tolerance of cold and redox induced stress (Fig. 4c). As in the other samples, many proteins also matched to some of the psychrophile genomes (Supplementary Table 3). Comparison of the MG, MT and MP data from the three soils provides insights into the linkages between omics data and processes. Processes that were detected in each of the three omics data sets, namely nitrogen, sulphur and methane cycling pathways, are shown in Fig. 3 (see Supplementary Information for details). The results indicate that permafrost microbial communities have a lower general functional potential than thawed soils, but also provide insights into adaptation strategies for life in frozen conditions. We found that global molecular data were a poorer predictor of biogeochemical process rates in permafrost than the other soils, probably owing, in part, to the frozen state of the soil. All measured process rates were generally low in frozen permafrost, but relative abundances of transcripts and proteins for several genes and proteins of some specific pathways, such as methane oxidation, were nonetheless similar to those for the active layer. It is possible that some of the RNA and proteins were preserved for long periods in this frozen environment, or that they were maintained in microbes that are surviving in a dormant state. Alternatively, some microbes in permafrost are actively expressing these genes and translating them into proteins in subzero conditions. In particular, dissimilatory Fe(III) reduction emerged as a potential metabolic strategy used by microbes in permafrost, as supported by combined omics data and process rates. By comparison, the active layer communities expressed genes and proteins involved in obtaining energy and nutrients from a diversity of aerobic and anaerobic processes and were equipped with functions for survival under freeze–thaw conditions. The bog represented a different scenario with a very high measured rate of methanogenesis and correspondingly high relative abundances of genes, transcripts and proteins involved in methanogenesis, thus demonstrating the potential linkage between molecular data and ecosystem level process rates, particularly when the process is dominant. Online Content Methods, along with any additional Extended Data display items and Source Data, are available in the online version of the paper; references unique to these sections appear only in the online paper. Received 22 April 2014; accepted 19 January 2015. Published online 4 March 2015. 1. 2.
Koven, C. D. et al. Permafrost carbon-climate feedbacks accelerate global warming. Proc. Natl Acad. Sci. USA 108, 14769–14774 (2011). Yergeau, E., Hogues, H., Whyte, L. G. & Greer, C. W. The functional potential of high Arctic permafrost revealed by metagenomic sequencing, qPCR and microarray analyses. ISME J. 4, 1206–1214 (2010).
3. 4. 5. 6. 7.
8. 9. 10. 11.
12.
13.
Mackelprang, R. et al. Metagenomic analysis of a permafrost microbial community reveals a rapid response to thaw. Nature 480, 368–371 (2011). Mondav, R. et al. Discovery of a novel methanogen prevalent in thawing permafrost. Nat. Commun. 5, 3212 (2014). Schuur, E. A. & Abbott, B. Climate change: high risk of permafrost thaw. Nature 480, 32–33 (2011). McCalley, C. K. et al. Methane dynamics regulated by microbial community response to permafrost thaw. Nature 514, 478–481 (2014). Jorgenson, M. T., Racine, C. H., Walters, J. C. & Osterkamp, T. E. Permafrost degradation and ecological changes associated with a warming climate in central Alaska. Clim. Change 48, 551–579 (2001). Jansson, J. K. Towards ‘‘Tera-Terra’’: terabase sequencing of terrestrial metagenomes. Microbe 6, 309–315 (2012). Chourey, K. et al. Direct cellular lysis/protein extraction protocol for soil metaproteomics. J. Proteome Res. 9, 6615–6622 (2010). Nicora, C. D. et al. Amino acid treatment enhances protein recovery from sediment and soils for metaproteomic studies. Proteomics 13, 2776–2785 (2013). Auch, A. F., von Jan, M., Klenk, H. P. & Goker, M. Digital DNA-DNA hybridization for microbial species delineation by means of genome-to-genome sequence comparison. Stand. Genomic Sci. 2, 117–134 (2010). Waldrop, M. P. et al. Molecular investigations into a globally important carbon pool: permafrost-protected carbon in Alaskan soils. Glob. Change Biol. 16, 2543–2554 (2010). Liebner, S., Harder, J. & Wagner, D. Bacterial diversity and community structure in polygonal tundra soils from Samoylov Island, Lena Delta, Siberia. Int. Microbiol. 11, 195–202 (2008).
Supplementary Information is available in the online version of the paper. Acknowledgements We thank R. Hettich and the Organic and Biological Mass Spectrometry group at Oak Ridge National Laboratory for access to mass spectrometry instrumentation. M. Haw, K. Li, K. Chavarria and R. Lamendella are acknowledged for help with pre-processing frozen samples. We thank K. Billis for help with RNA sequence preprocessing. This work was partly supported by the Director, Office of Science, Office of Biological and Environmental Research, Climate and Environmental Science Division, of the US Department of Energy, Terrestrial Ecosystem Science-Scientific Focus Area (TES-SFA), through a Community Sequencing Project at the DOE Joint Genome Institute (JGI CSP - 152) and by a Lawrence Berkeley National Laboratory Laboratory Directed Research & Development (LDRD) grant, all under contract number DE-AC02-05CH11231; by the Pacific Northwest National Laboratory under contract number DE-AC05-76RL01830; and by the Danish National Research Foundation (CENPERM DNRF100). The work conducted by the US Department of Energy Joint Genome Institute, a DOE Office of Science User Facility, is supported by the Office of Science of the US Department of Energy under contract number DE-AC02-05CH11231. Additional funding and considerable logistic support were provided by the Bonanza Creek Long-Term Ecological Research Program, which is jointly funded by National Science Foundation (DEB 1026415) and the US Department of Agriculture Forest Service, Pacific Northwest Research Station (PNW01-JV112619320-16). Support was also received from the US Geological Survey Climate R&D Program and Alaska Climate Science Center. J.Hu. was supported by Academy of Finland grant number 135669. Author Contributions J.K.J., M.P.W. and J.Hu. planned the study. M.P.W. and J.M. collected the samples and J.M. performed the chemical analyses. J.Ha., M.R.T. and A.D.M. performed the site characterization. M.B.S., N.C.V., M.M.D. and L.H.L. performed the proteomics. J.Hu., R.M., S.J.B. and K.M. analysed the sequence data. J.Hu., M.P.W. and J.K.J. wrote the paper with contributions from all authors. J.Hu., J.K.J., M.P.W. and R.M. made the figures. Author Information The 454 nucleotide sequences have been deposited in Sequence Read Archive under BioProject number PRJNA222786, metagenomes and metatranscriptomes in IMG/M under Study ID Gs0063124 MG-RAST under project number 11953 and proteomics data in the PRIDE partner repository under dataset identifier PXD001131. Reprints and permissions information is available at www.nature.com/reprints. The authors declare no competing financial interests. Readers are welcome to comment on the online version of the paper. Correspondence and requests for materials should be addressed to J.K.J. (
[email protected]).
0 0 M O N T H 2 0 1 5 | VO L 0 0 0 | N AT U R E | 5
©2015 Macmillan Publishers Limited. All rights reserved
RESEARCH LETTER METHODS No statistical methods were used to predetermine sample size. Site description. The sites used in this experiment are part of the Alaska Peatland Experiment (APEX), which is part of the Bonanza Creek Long-Term Ecological Research Program just outside Fairbanks, Alaska (64.70u N, 2148.3u W). The forested site is underlain by permafrost, is dominated by black spruce (Picea mariana) and has an understorey composed of Vaccinium uliginosum, Vaccinium vitis-idaea, Calamagrostis canadensis and occasionally Eriophorum vaginatum, Larix laricina and Salix bebbiana. Understorey non-vascular vegetation is composed of moss species Hylocomium splendens, Sphagnum sp., Dicramium sp. and lichen. The thermokarst bog site is primarily composed of Sphagnum mosses, as well as vascular species Carex aquatilis, Eriophorum chamissonis, Chamaedaphne calyculata and Carex chordorrhiza, and contains recently deceased black spruce trees. During the time of sample collection, the temperature of the surface permafrost was just below freezing, much like most of the surface permafrost in interior Alaska (60 cm: maximum 20.052 uC, minimum 22.18 uC). In the thermokarst bog, the soil temperature ranged from 3.49 to 20.08 uC at 100 cm to 6.6 to 22.69 uC at 50 cm. The pH at the sites was 4.8 in active layer, 4.9 and 5.8 in permafrost (1:1 soil water ratio). Sample collection. Samples of the active layer and permafrost (black spruce site) were taken in summer 2009 (for DNA extraction, four cores per soil) and summer 2012 (for process rate measurements) by using a SIPRE corer that produces a 7.5 cm diameter core down to 1 m. Maximum active layer depth was measured at 55 cm at this site. Samples of the active layer were at approximately 30–35 cm depth and of permafrost were 65–75 cm depth. The thermokarst site underwent a thaw approximately 100 years ago supported by air photographic interpretation (Turetsky) and radiocarbon analysis of the transition between permafrost and thermokarst soils. Cores (for DNA extraction, four cores) were taken using a sharpened polyvinyl chloride (PVC) pipe of diameter 4 feet (,1.22 m) and by cutting around the bottom of the PVC pipe as it was slowly inserted into the bog, without compacting the organic materials. When the PVC pipe was inserted as far as it could go (approximately 1.2 m), the bottom of the PVC tube was covered with a PVC cap and the core was slowly raised out of the ground. The PVC core was quickly wrapped in a plastic bag, taped tightly and placed into a cooler with dry ice to be immediately frozen. Samples for microbial analysis were taken at approximately 100 cm depth. Samples for process rate measurements were collected in April 2011 using a SIPRE corer. In the field, cores were wrapped in aluminium foil and packed in dry ice for transport to our laboratory facilities, where they were kept frozen pending subsampling. Process measurements were conducted on core splits from about 45–60 cm below the surface. Sample processing. For incubation studies, frozen soils were sectioned using a compound mitre saw. Before sectioning, cores were scraped of surface organic matter and other contaminants that froze, or otherwise adhered to the core during the drilling and extraction process. Frozen soil or peat aliquots were split from each core section for downstream analyses using a band saw to divide sections along the vertical profile. Core splits were thawed in a glove box under anaerobic conditions (1–2% H2 atmosphere volume balanced with N2) and homogenized by hand. Core splits were allocated either to standard soil analyses, for example moisture, pH and total CN content, or incubation units for sequential determination of Fe(III)/Fe(II), SO422, NO32, denitrification potential, as well trace gas production (CO2, CH4 and N2O) by aerobic and anaerobic pathways. Soil analyses. Soil moisture was determined gravimetrically by drying samples to a constant mass at 65 uC. These subsamples were subsequently powdered in a modified roller mill and used to measure soil organic carbon and total nitrogen by combustion analysis on a LECO 2000 CNS Autoanalyzer calibrated with National Institute of Standards and Technology standards Buffalo River sediment and apple leaves (SRM 2704 and SRM 1515, respectively). Owing to the acidity of these samples, carbonate removal was not necessary before analysis. For gamma samples, soil pH was determined from a 1:2 (mass:volume) slurry of oven-dried soils and deionized water which was allowed to equilibrate at room temperature for 30 min. For beta samples, we measured pH on pore water collected in July using acid-washed (30 cm 3 6.0 mm internal diameter), stainless steel sediment pore water samplers connected to 60 ml syringes fitted with three-way Luer-lock stopcocks. The samplers were flushed with several volumes of pore water before collecting and filtering (0.45 mm nylon) samples into sterile 50 ml polyethylene centrifuge tubes. Rates of iron reduction, and sulphate and nitrate utilization. We established two series of six incubation units representing six sampling periods (0, 1, 3, 5, 8 and 12 d) for each of the forest and permafrost samples, and two series of four incubation units (0, 1, 5, 12 d) for each bog soil core. An additional incubation unit consisting of autoclaved soil was established for each bog core section, and harvested at 12 d. Incubation units consisted of about 5 g of homogenized whole soil or peat, subsampled under anaerobic conditions into 40 ml borosilicate glass vials fitted
with 3.18 mm polypropylene septa (Environmental Sampling Supply). Each series was incubated in the dark at 5 or 22 uC under a microaerobic atmosphere maintained by a vacuum desiccator purged with five volumes of argon and held at a tension slightly below ambient pressure. On the appropriate sampling date, one vial from each series was destructively harvested by adding 15 ml of O2-free deionized water to the vial and vortexing at maximum speed for 60 s. Pore water and solids were separated by centrifugation (15 min at 500g) and subsampled in the glove box to minimize potential for oxidation. Pore waters were filtered through a sterile 0.2 mm syringe filter into 15 ml polyethylene centrifuge tubes and stored frozen at 225 uC pending analysis for sulphate and nitrate content. Sulphate concentrations were determined using a Dionex DX ion chromatograph equipped with a 4 mm AS4A-SC column (Dionex Corporation). Peak areas for sulphate were quantified against a six-point calibration (0.5–20.0 mg ml21) developed from a commercial 1,000 mg ml21 stock SO4 solution (Ultra Scientific). Nitrate content was analysed colorimetrically using an automated discrete photometric analyser (Aquakem 250, Thermo Fisher Scientific) following United States Environmental Protection Agency method 353.1. Changes in SO4 and NO3 over time were used as estimates of reduction rates. Rates of acid-extractable ferric iron (Fe(III)) reduction were estimated at multiple time points by measuring ferrous iron (Fe(II)) production colorimetrically using the ferrozine method14. Briefly, 0.5 g of homogenized whole soil, or peat, was transferred under anaerobic conditions into a 15 ml plastic centrifuge tube. We added 10 ml of 0.5 M HCl to the tube, and vortexed the mixture at maximium speed for 15 s. Tubes were shaken in the dark for 1 h at 200 revolutions per minute, and then centrifuged at 2,500g for 15 min. A 100 ml subsample of the supernatant was added to 5.0 ml of ferrozine solution (1.0 g l21 3-(2-pyridyl)-5,6-diphenyl-1,2,4triazine-49, 40-disulphonic acid sodium in 50 mM HEPES (4-(2-hydroxyethyl)-1piperazineethanesulphonic acid) adjusted to pH 4) and vortexed for 10 s. Absorbance was measured at 562 nm after allowing a full minute for colour development. To determine Fe(III), we subsequently added 0.25 ml hydroxylamine-HCl (0.25 M in 0.25 M HCl) to each tube, and re-read absorbance at 562 nm, after allowing 15 min for the reduction of Fe(III) to Fe(II). We used a six-point calibration of Fe(II) standards (2–80 mg ml21) to determine acid-extractable iron fractions. Amorphous ferric iron content was calculated as the difference between total acid-extractable iron and ferrous iron content before the addition of hydroxylamine. Fe(II) production over time was used as an estimate of reduction rate. Denitrification rate measurements. We employed a modified acetylene inhibition technique15 to evaluate rates of denitrification among soil and peat replicates. In an anaerobic glove box, we placed about 3.0 ml of material (soil or peat) under field-moist conditions into two series of six serum vials (13 ml volume), representing five sampling periods and a sterilized control, for each core section. Vials were crimp-sealed with butyl rubber stoppers, with the exception of sterilized controls, which were autoclaved (121 uC and 250 kPa) for 30 min, and allowed to cool in the glove box before sealing. Vials were amended with a 15% headspace addition of acetylene gas and inverted several times to improve diffusion of the acetylene. Each series of vials was incubated statically at 5 or 22 uC before sampling for N2O. Sampling times were 10 min and 1, 2, 3 or 5 days after the addition of acetylene. At the appropriate sampling time, N2O concentrations were measured by injecting 0.25 ml of headspace gas into an HNU model 301 gas chromatograph fitted with a Valco 63 Ni electron-capture detector and a 2.6 m (1.5 mm internal diameter) Porapak R 100/120 mesh column. Peak detection for N2O was calibrated with certified N2Oin-N2 standards with concentrations of 0.101, 1.02 and 10.1 ppm by volume (Air Liquide America Speciality Gases). Denitrification rates were determined by calculating the change in N2O over time. Methane oxidation. Soils were collected from the bog and black spruce forest APEX sites in Bonanza Creek Long-Term Ecological Research on 18 June 2009. At each site, soil cores were taken every 10 m along 40 m transects with five soil cores (each core representing a replicate) collected along each transect. Bog and black spruce forest cores were collected down to the ice layer using a corer with a diameter of 4 feet. The living vegetation top layer was removed from each core. Bog cores were approximately 30 cm deep (measured from below the vegetative layer to the ice layer), and each core was split up into three depth samples: 0–10 cm, 10– 20 cm and 20–30 cm. Only data from 20–30 cm are reported here. Forest cores were approximately 10 cm deep. Cores were kept on ice and transported to the University of California, Berkeley, where they were stored at 4 uC until incubation experiments were initiated. CH4 oxidation incubations. For CH4 oxidation incubations, soils were delivered (10.0 6 0.1 g) to sterile 250 ml jars. The jars were sealed with airtight lids containing septa to allow for headspace gas sampling. The initial headspace was composed of room air. To ensure that oxygen was not depleted during the CH4 oxidation incubations, at the end of the incubations, headspaces were analysed for O2 concentration, using a Probe YSI 52 oxygen meter. The final average headspace O2 concentration was 19.2 6 1.0%. For CH4 production incubations, soils (10 g) were
©2015 Macmillan Publishers Limited. All rights reserved
LETTER RESEARCH loaded into 100 ml serum bottles, and bottles were sealed with gas-impermeable blue butyl rubber septa (Bellco). Anoxic conditions were created using a standard alternating vacuum and pressure approach (for example refs 16, 17). Briefly, bottle headspaces were evacuated by vacuuming to 51 kPa and then over-pressured with N2 to 40 kPa, and this process was repeated ten times. On final filling, headspace was only filled to 13 kPa with N2. The headspaces were then flushed with N2/CO2 (98/2%) at 135 kPa for 5 min through the septa using 23-gauge needles as input and exhaust ports. Headspace pressure was equilibrated to 10 kPa using a N2 flushed syringe. For the anaerobic work, all transfers, additions and headspace samplings were done using gas-tight syringes fitted with stopcocks that were first degassed with N2 to avoid O2 contamination. For all anaerobic work, N2 and N2/CO2 were first passed through hot copper fillings (,350 uC) to remove traces of O2 (for example ref. 18), and the copper fillings were reduced daily using H2. All incubations were setup with five replicates and with heat killed controls (autoclaved twice at 121 uC for 20 min). Methane (1,700 ppm) was delivered to all treatments. Soils were incubated for 5 days at 11 uC in the dark. CH4 oxidation gas analysis. Headspace samples (2 ml) were taken from incubation jars via gas tight syringe fitted with a stopcock at t 5 0 (30 min after CH4 was delivered), 24 h and 5 d. Headspace samples were transferred to 10 ml serum bottles sealed with thick black butyl rubber stoppers. Samples were analysed using an HP6890 GC (Hewlett Packard) fitted with a flame ionization detector and pulsed discharge ionization detector for CH4 and CO2 analysis, respectively. CH4 oxidation and production rates were calculated by difference in total CH4 concentration in the headspace at the beginning and end of the incubation period. Laboratory incubation experiment and the rate of trace gas production. Trace gas (CH4, CO2, N2O) production was monitored under aerobic and anaerobic conditions during a long-term (1 year) laboratory incubation experiment. We added 1–7 g (dry mass) of soil or peat, with field-moisture content, to 100 ml clear borosilicate glass serum vials (Sigma Aldrich) fitted with either 20 mm grey (aerobic) or blue (anaerobic) butyl rubber stoppers (Bellco Glass) and aluminium crimp seals. All vials were sealed and pre-incubated for 3 days in the dark before gas measurements were initiated. To prevent inhibition of respiration due to excessive CO2 build-up, aerobic vials were capped for only 24 h before gas flux measurements, then aerated before being returned to their respective incubation chambers. Between sampling periods, these vials were covered with 0.8 mm polyethylene sheeting to prevent excessive moisture loss while still allowing gas exchange. Anaerobic vials were flushed with argon for 10 min after measurement to reset headspace atmosphere for the next sampling period. After gas sampling, the water content of all vials was checked gravimetrically and adjusted, as necessary, to the original fieldmoisture content with O2-free deionized water. Incubations were conducted at 5 uC and room temperature (22 uC). We sampled the headspace of all vials weekly for 4 weeks. We removed 5 ml from the headspace of each vial using an air-tight syringe, fitted with a Luer-lock stopcock sealed with high-performance vacuum grease, and measured CO2, CH4 and N2O with a gas chromatograph pre-configured for greenhouse gas monitoring (SRI 8610C gas chromatograph with flame ionization detector–methanizer and electron capture detector, column 3.2 mm internal diameter 3 6 m HaySep D, 1 ml sample loop; SRI Instruments). Peak areas for trace gases were calibrated using a three-point curve (100, 1,000 and 10,000 ppm) for CO2, a three-point curve (10, 100 and 1,000 ppm) for CH4 and a two-point curve (0.101 and 1.02 ppm) for N2O. Calibration curves were developed with certified gas standards balanced with N2 (Air Liquide America Speciality Gases). Statistical analysis for soil edaphic characteristics and process rates. One-way analysis of variance was used to compare moisture content, pH, electrical conductivity, dissolved organic carbon and total dissolved nitrogen among active layer, permafrost and bog soils (n 5 4–5). In the cases where data were not normally distributed or could not be transformed to a normal distribution, non-parametric Wilcoxon tests were used. A P value of 0.05 was used as the significance level. For Fe(II) production, SO4 loss, NO3 loss, denitrification and CH4 flux at 4 weeks under anaerobic conditions, aerobic CO2 production at 4 weeks and anaerobic CO2 production at 4 weeks, two-way analysis of variance was used with soil type and incubation temperature as the independent variables. In all cases, except for NO3 loss, rates were higher with increased temperature. In Table 1, we present the main effect of ‘soil type’ and its mean and standard error. For each soil 3 temperature combination, n 5 5. Sample preparation for nucleic-acid extraction. To ensure that the samples were free of surface contamination before further processing for microbial analyses, all surfaces of the frozen sections were removed before nucleic-acid extraction. The permafrost soil cubes were sprayed with 1.82 3 109 fluorescent microbeads (Fluoresbrite Yellow Green latex microbeads, 0.5 mm, Polyscience) to detect removal of the possibly contaminated surface soil of the cubes. The beads were washed three times with 70% RNase-free ethanol and twice with diethylpyrocarbonate (DEPC)treated Milli-Q water before use. All tools were sterilized by autoclaving twice followed by baking at 120 uC overnight. The cubes were sawn with an electronic
jigsaw on a dry ice bed using sterile blades. Sterile, chilled clamps were used to hold the cube as it was sawn. After cutting a side of the cube, the clamps were soaked in 10% bleach followed by sterile Milli-Q water and finally wiped with 70% ethanol before using them for sawing the new surface. During the sawing, the dry ice was covered with sterile and RNase-free foil that was changed after sawing each of the cube’s sides. After sawing, samples were taken from the newly exposed surface with a sterile scalpel and examined by epifluorescence microscopy for the presence of the fluorescent beads. Acridine orange direct staining and epifluorecence microscopy was conducted on all samples; cell density in permafrost was found to be approximately 1 3 108, and in bog and active layer was twice that amount: approximately 2 3 108 cells per gram of soil (data not shown). Subsamples were taken from the cleaned and frozen soil cubes, homogenized while frozen and nucleic acids were extracted from three replicate 500 mg of soil from each cube. Nucleic acids were extracted using the hexadecyltrimethyl ammonium bromide (CTAB) and phenol–chloroform and bead beating protocol (see ref. 3) with a modification of adding a pressure lysis step before bead beating with a Barocycler (Pressure Biosciences) set to alter pressure from ambient to 2,413 bar for 20 s and back to ambient for 10 s, 20 times. After extraction, nucleic acids were purified with the AllPrep kit (Qiagen) according to the manufacturer’s instructions, with DNase treatment for the RNA samples. The purified replicates of the DNA and RNA samples were pooled and the resulting yield and quality were measured with a Bioanalyzer (Agilent). The V6–V9 area of the 16S rRNA gene was amplified at the Joint Genome Institute (JGI) with primers 926wF (aaa ctY aaa Kga att gRc gg) and 1406R creating an amplicon of approximately 480 base pairs (bp). The reverse primer included a 5-bp barcode for multiplexing of samples during sequencing. The sequence reads were de-noised using Pyrotagger19. Sequence reads were assigned into OTUs with 97% similarity. The representative from each OTU (97%) was classified by comparing with the Greengenes database (version 29nov2010). Potential chimaeras were removed using Pyrotagger and 69 OTUs were detected as possibly chimaeric and removed from the data set. As the number of sequence reads recovered from each sample varied, the sample data sets were rarified before alpha diversity analysis using the number of reads in the lowest sample. The microbial diversity did not vary drastically between the different samples, showing the frozen and thawed sites to carry a diverse microbial community by the OTU number and chao1 and ACE diversity estimates (Extended Data Table 2). Alpha diversity indices were calculated with R statistical calculation software package vegan (http://cran.r-project.org/web/packages/vegan/index.html)20 and in QIIME21 using a rarified data set as the number of sequence reads per sample varied. The OTU matrix with the relative abundance of each OTU was used to build a rank abundance curve of the 20 most abundant OTUs in all samples (Extended Data Fig. 5). The 454 reads have been deposited in the Sequence Read Archive under BioProject number PRJNA222786. Metagenomes. Two samples from each of the three sample types were metagenome sequenced: active layer samples A2 and A5, permafrost samples P1 and P3 and thermokarst bog samples B3 and B4. The quantity of the extracted DNA from the permafrost samples was not adequate for Illumina sample preparation and thus the DNA was emulsion PCR amplified as previously described3 after shearing it into fragments of about 300–500 bp. Briefly, 10 ng of DNA was sheared with a Covaris shearing apparatus and Illumina sequencing adapters were ligated to the endrepaired fragments. The fragments were amplified with the adaptor primers in an emulsion so that each fragment was amplified in an individual oil droplet. After amplification, the correct size fragments were extracted from a low-melting electrophoresis gel; the purified fragments were sequenced using the Illumina GAII sequencing platform (Illumina) for two cycles, generating 2 3 113 bp paired-end reads. Assembly. The metagenomic reads were assembled using the de novo assembler at CLC Genomics Workbench (CLC bio). The default parameters were used except the minimum length of contigs, which was 1,000. CLC assembler resulted in assembly of 18.8–59.8% of reads with an N50 from 890 to 1,117 bp. All of the contigs and the individual reads were submitted to the Integrated Microbial Genomes and Metagenomes (IMG/M, US Department of Energy22) for gene calling and annotation. Additionally, the reads were annotated in MG-RAST23 against the SEED subsystems database with an e value of 1025. Binning draft genomes from MG. Reads were mapped to contigs using BWA. Contigs greater than 2.5 kilobases in length were grouped into genome bins on the basis of abundance and tetranucleotide frequency using MetaBat (https://bitbucket. org/berkeleylab/metabat). To account for the fact that our data represent complex communities and to minimize contamination, we used the very specific option, which specifies a probability cutoff of 90% for imminent neighbours, 90% for secondary neighbours and 90% for tertiary neighbours. All other parameters were set to default. Completeness and contamination of genome bins were assessed using
©2015 Macmillan Publishers Limited. All rights reserved
RESEARCH LETTER CheckM24, which identified lineage-specific single-copy marker genes in each bin. Genome completeness was estimated using number of marker genes present in genome and contamination was evaluated from the number of multi-copy marker genes. Bins that were less than 20% complete or with greater than 10% contamination were discarded. AMPHORA2 was used to evaluate taxonomy. A confidence score for each gene was generated at each rank of classification25. Marker lineage was reported if 75% of the classifications were in agreement at a particular taxonomic level. Genome-to-Genome Distance Calculator11 was used for selected binds to calculate the DDH similarity. The annotated bins are stored at IMG/M under Study ID Gs0063124. Metatranscriptomics. Approximately 14 ng of RNA was used in first-strand synthesis of complementary DNA (cDNA) with 100 nM of primer N6-T7 (59 NNNN NN-T7) and Superscript III First-Strand kit (Invitrogen) at 37 uC without the last denaturation step26 and with 200 mM of random hexamers. An Invitrogen SecondStrand synthesis kit was used for second-strand synthesis at 16 uC followed by purification with Qiagen PCR purification columns. The purified cDNA was amplified with the Ambion aRNA amplification kit (Ambion) according to the manufacturer’s protocol. The resulting cDNA was purified on Qiagen PCR columns and eluted to RNase free water. The cDNA was quantified and qualified with Bioanalyzer Pico RNA chips (Bioanalyzer). For the permafrost samples, 10 ng of linear amplified cDNA was used for Illumina library preparation through emulsion PCR as with metagenomes. The active layer and thermokarst samples were used directly in the Illumina library preparation at the JGI sequencing facility using the manufacturer’s protocols. One Illumina HiSeq lane was sequenced per sample with 150 bp for two cycles generating 2 3 150 bp paired-end reads. Individual reads were annotated at IMG/M and MG-RAST according to the parameters used for metagenomic reads. Metagenomic and metatranscriptomic read annotations can be viewed at IMG/M under following submission numbers: sample P1-MG, 10301 and 10302; P3-MG, 10298 and 10299; B3-MG, 10560; B4-MG, 10561 and 10562; A2-MG, 10308 and 10559; A5-MG, 10305 and 10306; P3-MT, 10300; B3-MT, 10304; B4-MT, 10303; A2-MT, 10309; A5-MT, 10307. Metagenomic and metatranscriptomic annotations can be viewed at IMG/M under Study ID Gs0063124. Metaproteomics. Proteins were extracted using the SDS lysis-based method with trichloroacetic acid (TCA) precipitation and cleanup step followed by 10 kDA spin filter, modified from ref. 9. Briefly, 5 g of frozen sample were suspended in 5 ml of SDS lysis buffer (4% SDS, 100 mM Tris-HCl, pH 8.0) and boiled for 5 min; this procedure presumably shuts down all cellular processes and captures the metaproteome in situ. Cells were further disrupted by sonication pulses of 10 s on, 10 off, for 2 min. After the second 5 min boiling step the samples were centrifuged and dithiothreitol (DTT) was added to a final concentration of 24 mM to the supernatant. The samples were precipitated with 20% TCA overnight at 220 uC. Precipitated samples were centrifuged at 10,000g for 40 min at 4 uC and the pellets were washed with ice-cold acetone. After mixing by vortexing, the samples were centrifuged for 5 min at 4 uC at 21,000g. Protein pellets were solubilized in 8 M urea with 100 mM Tris-HCl, pH 8.0, by incubation at room temperature (27 uC) for 30 min and sonicated in an ice-water bath to keep the samples below 37 uC. Samples were adjusted to 20 mM iodoacetamide and incubated in the dark for 15 min at room temperature. Trypsin digestion and peptide clean-up were performed as in ref. 27; the resultant peptide solutions were split into four replicates and frozen at 280 uC until analysis. Measurement of peptides by two-dimensional liquid chromatography–tandem mass spectrometry. Complex peptide samples from each soil type were pressure cell loaded onto a biphasic two-dimensional back column packed with 5 cm strong cation exchange resin for charge-based separation of peptides followed by 3 cm C18 reversed phase for online desalting (Luna and Aqua respectively, Phenomenex). Once loaded, the sample columns were washed offline with solvent A (5% acetonitrile, 95% high-performance liquid chromatography (HPLC)-grade water, 0.1% formic acid) for 15 min to remove residual urea and NaCl followed by a gradient to 100% solvent B (70% acetonitrile, 30% HPLC-grade water, 0.1% formic acid) over 30 min to move the peptide population from the reversed phase to the strong cation exchange resin. Washed samples were then placed in-line with a nanospray emitter (100 mm internal diameter, New Objective) packed with 15 cm of C18 reversed phase material (Aqua) and analysed in duplicate by 24 h two-dimensional liquid chromatography–tandem mass spectrometry (MS/MS) (11 salt-pulses: 5, 7.5, 10, 12.5, 15, 17.5, 20, 25, 35, 50, 100% of 500 mM ammonium acetate followed by a 100 min gradient to 50% solvent B) with a hybrid Velos/Orbitrap mass spectrometer (Thermo Fisher Scientific) operating in data-dependent mode. Full MS1 scans were obtained using an Orbitrap mass analyser set to 330,000 resolution, while 20 data-dependent MS/MS scans were acquired per full scan (two microscans). Data-dependent MS/MS scans were acquired in the Velos linear ion trap, with two
microscans averaged and dynamic exclusion set to on. Two replicate measurements were obtained for each sample, except sample B4 which had one measurement. Database searching and protein identification. FASTA databases were compiled with the protein sequences of the assembled and annotated metagenomes (active layer, permafrost and thermokarst bog), 180 proteomes of known soil bacteria (Supplementary Table 2) and known protein contaminants (trypsin, keratin, etc.) into one single composite database. Assembled metagenomes used for proteome searches were submitted to IMG under the following submission numbers: permafrost, 2321; active layer, 2382; thermokarst bog, 2383. All MS/MS spectra were searched as in ref. 27 with the SEQUEST algorithm against the composite FASTA database and filtered with DTASelect/Contrast at the peptide level (Xcorrs of at least 1.8 (11), 2.5 (12), 3.5 (13)). Only proteins identified with two fully tryptic peptides, with one unique to that specific protein entry, from a 22 h run were considered for further biological study. Metaproteomics data analysis. To prepare for semiquantitative proteome analysis, DTASelect-filtered data were subjected to spectral count balancing and subsequent normalized spectral abundance factor (NSAF) determination28. For the former, the unique status of each identified peptide was assessed. If a peptide was deemed unique, it retained 100% of its previously assessed spectral count. However, if a peptide was found to belong to more than one representative protein, namely nonunique, its spectral count was re-calculated on the basis of the ratio of uniquely identified peptides between the two or more proteins that shared the non-unique peptide in question. The adjusted spectral count of the proteins incorporated these balanced values, which corrected for the slight quantitative bias that occurs with homologous proteins and/or proteins with homologous regions, both of which artificially inflate spectral count values at the expense of proteins that share no homology. Once spectrally balanced, NSAF values were calculated for each protein in a specific run to normalize individual MS runs on the basis of the total number of spectra collected and protein length, which by itself introduces a bias that favours larger proteins if not corrected for. Summed technical replicates and NSAF values were used for subsequent analysis. A Venn diagram was drawn for the shared and unique proteins present in three out of four technical replicates in each soil. The mass spectrometry proteomics data have been deposited in the ProteomeXchange Consortium via the PRIDE partner repository with the data set identifier PXD001131. Proteome search to additional genomes. Microbial proteins from 13 recently sequenced species isolated from cold environments (Supplementary Table 2) were collected from NCBI RefSeq and JGI in FASTA format. With these protein sequences, we searched MS/MS peaks of our data using MyriMatch 2.1.138. We set MyriMatch options as MonoPrecursorMzTolerance 5 3 m/z, MonoisotopeAdjustmentSet 5 0, FragmentMzTolerance 5 0.8 m/z, CleavageRules 5 Trypsin/P, MinTerminiCleavages 5 1, ComputeXCorr 5 true and MaxResultRank 5 10. We also added static carbamidomethyl modification on Cys by adding 57.021462 Da. We ran MyriMatch with 48 central processing units at the Newton cluster of the University of Tennessee, Knoxville (https://newton.utk.edu/). PepXML files, produced by MyriMatch, were analysed by in-house Python scripts to get proteins from peptide-to-spectrum matches as was done by DTASelect in the original search. Spectrum counts of every protein were balanced and normalized by NSAF as was done in the original search. BLASTP was used to compare protein sequences between the original database and 13 new species. We used default options of BLASTP and accepted BLAST hits that their matched length was bigger than 95% length of a query protein and had no gap opens. Data analysis. In addition to IMG/M annotation, a BLAST search was conducted on the metagenomic and metatranscriptomic reads against the Greengenes database (version 29nov2010); one best hit was chosen for each read, with an e value cutoff of 1025 to focus on the 16S rRNA gene profiles. Since the Illumina HiSeq runs produced over 20 Gb of data, the reads were pre-analysed with the Ribopicker program to collect only the presumably 16S rRNA origin reads, which were further classified with BLAST. The relative abundance of each phylum in MG and MT data sets was compared in STAMP29 with Fisher’s alpha test and Storey’s false discovery rate correlation. MT/MG data were compared with a two-tailed t-test. Triplots based on the relative abundance, normalized read annotations were calculated in R package vcd (http://cran.r-project.org/web/packages/vcd/index.html)30 and barcharts were drawn for selected cycles using the normalized data. The heatmap focusing on the transporters was obtained from the top 40 (relative abundance) MT reads that were assigned as transporters. A Venn diagram (Extended Data Fig. 2) was constructed from the selected genes present in the three sample types (permafrost, active layer and bog) for all three data sets (MG, MT and MP). The three different omics approaches were compared (Extended Data Fig. 6) for each site by extracting the Kyoto Encyclopedia of Genes and Genomes (KEGG) hits for MG, MT and MT data sets and comparing these in ternary plots as described above; the MT and MG data sets were multiplied by 100 to make the values comparable.
©2015 Macmillan Publishers Limited. All rights reserved
LETTER RESEARCH 14. Lovley, D. R. & Phillips, E. J. Rapid assay for microbially reducible ferric iron in aquatic sediments. Appl. Environ. Microbiol. 53, 1536–1540 (1987). 15. Balderston, W. L., Sherr, B. & Payne, W. J. Blockage by acetylene of nitrous oxide reduction in Pseudomonas perfectomarinus. Appl. Environ. Microbiol. 31, 504–508 (1976). 16. Balch, W. E., Fox, G. E., Magrum, L. J., Woese, C. R. & Wolfe, R. S. Methanogens: reevaluation of a unique biological group. Microbiol. Rev. 43, 260–296 (1979). 17. Zehnder, A. J. & Brock, T. D. Anaerobic methane oxidation: occurrence and ecology. Appl. Environ. Microbiol. 39, 194–204 (1980). 18. Macy, J. M., Snellen, J. E. & Hungate, R. E. Use of syringe methods for anaerobiosis. Am. J. Clin. Nutr. 25, 1318–1323 (1972). 19. Kunin, V. & Hugenholtz, P. PyroTagger: a fast, accurate pipelinde for analysis for analysis of rRNA amplicon pyrosequencing data. Open J. 1, 1–8 (2010). 20. Oksanen, J., Kindt, R., Legendre, P. & O’Hara, R. B. Vegan: Community Ecology Package v.1.8-2 (2006). 21. Caporaso, J. G. et al. QIIME allows analysis of high-throughput community sequencing data. Nature Methods 7, 335–336 (2010). 22. Markowitz, V. M. et al. IMG: the Integrated Microbial Genomes database and comparative analysis system. Nucleic Acids Res. 40, D115–D122 (2012).
23. Meyer, F. et al. The metagenomics RAST server – a public resource for the automatic phylogenetic and functional analysis of metagenomes. BMC Bioinformatics 9, 386 (2008). 24. Parks, D. H., Imelfort, M., Skennerton, C. T., Hugenholtz, P. & Tyson G. W. CheckM: assessing the quality of microbial genomes recovered from isolates, single cells, and metagenomes. PeerJ PrePrints 2, e554v1 (2014). 25. Wu, M. & Scott, A. J. Phylogenomic analysis of bacterial and archaeal sequences with AMPHORA2. Bioinformatics 28, 1033–1034 (2012). 26. Leininger, S. et al. Archaea predominate among ammonia-oxidizing prokaryotes in soils. Nature 442, 806–809 (2006). 27. Giannone, R. J. et al. Proteomic characterization of cellular and molecular processes that enable the Nanoarchaeum equitans–Ignicoccus hospitalis relationship. PLoS ONE 6, e22942 (2011). 28. Florens, L. & Washburn, M. P. Proteomic analysis by multidimensional protein identification technology. Methods Mol. Biol. 328, 159–175 (2006). 29. Parks, D. H. & Beiko, R. G. Identifying biologically relevant differences between metagenomic communities. Bioinformatics 26, 715–721 (2010). 30. Meyer, D., Zeileis, A. & Hornik, K. vcd: Visualizing Categorical Data v.1.2-13 (2012).
©2015 Macmillan Publishers Limited. All rights reserved
RESEARCH LETTER
Extended Data Figure 1 | Comparison of multi-omics data between the three zones. The triplots visually present selected functions in (a) metagenomes, (b) metatranscriptomes and (c) metaproteomes in the three studied zones (permafrost, active layer and thermokarst bog). The colours correspond to SEED subsystems categories in MG-RAST; in addition, the closer the symbol is to the node of the triplot, the more abundant the gene,
transcript or protein is in that particular soil type. Functions in the centre are shared among all three sites, those on edges are shared between two zones and those on the nodes are unique to that site. Owing to the large number of shared functions between bog and active layer in the metatranscriptomes, these categories are specifically compared in d.
©2015 Macmillan Publishers Limited. All rights reserved
LETTER RESEARCH
Extended Data Figure 2 | Shared and unique genes, transcripts and proteins in the three zones. The Venn diagrams for (a) metagenome, (b) metatranscriptome and (c) metaproteome data illustrate the shared and unique genes, transcripts and proteins in the three zones.
©2015 Macmillan Publishers Limited. All rights reserved
RESEARCH LETTER
Extended Data Figure 3 | Heatmap showing the 40 most abundant transporters found in the metatranscriptomes.
©2015 Macmillan Publishers Limited. All rights reserved
LETTER RESEARCH
Extended Data Figure 4 | Abundance of genes involved in sulphate reduction, nitrogen cycle, methanogenesis and methane oxidation. The relative abundance of each gene is shown; error bars, s.d. The genes with protein matches in the metaproteome data are marked with a triangle.
©2015 Macmillan Publishers Limited. All rights reserved
RESEARCH LETTER
Extended Data Figure 5 | The 20 most abundant OTUs found in permafrost, active layer and thermokarst bog. a, Bacterial OTUs; b, archaeal OTUs. A single Chloroflexi OTU constituted up to 15% of the OTUs in
permafrost and a draft genome bin was obtained that corresponded to this OTU (Extended Data Table 1). The abundant archaeal OTUs were methanogens.
©2015 Macmillan Publishers Limited. All rights reserved
LETTER RESEARCH
Extended Data Figure 6 | Comparison of abundant KEGG orthologous groups found in all three omics approaches (MG, MT and MP) for each site. Permafrost: restriction modification systems, PAS sensors, ABC transporters for oligopeptides and nucleic-acid synthesis. Active layer: chaperonins,
dehydrogenases and transporters for branched-chain amino acids and sugars. Thermokarst bog: methyl coenzyme M reductase, glycerol kinase, nucleic-acid synthesis and ATPases.
©2015 Macmillan Publishers Limited. All rights reserved
RESEARCH LETTER Extended Data Table 1 | Metagenomic bins produced from the metagenomes Genes of interest
136 55
0
0
27.67
0
454,972 118
p_Euryarchaeota, c_Methanomicrobia
23 201
5
0
88.15
2.92
1,227,542 154
x
Bog_232 p_Euryarchaeota, c_Methanomicrobia
44 183
2
0
77.14
0.97
879,929 153
x
Bog_301 p_Euryarchaeota, c_Methanomicrobia
62 167
0
0
70.47
0
1,008,045 190
x
Bog_263 p_Chloroflexi
45
96
10
0
62.42
8.42
2,081,309 490
1
54.19
2.38
2,013,476 473
Bog_1285
Bog
p_Spirochaetes, c_Spirochaetia, o_Spirochaetales, f_Spirochaetaceae
65
75
1
p_Chloroflexi, c_Anaerolineae, o_Anaerolineales, Bog_440 f_Anaerolineaceae, g_Anaerolinea, s_Thermophila
70
76
Bog_246 p_Proteobacteria
75
17
0
47.95
9.12
1,269,542 328
28
1
0
30.25
1.72
1,127,004 295
Bog_283 p_Proteobacteria, c_Deltaproteobacteria, o_Myxococcales 172 64
12
0
28.36
4.56
1,845,531 529
p_Actinobacteria, c_Actinobacteria, o_Solirubrobacterales, f_Conexibacteraceae, g_Conexibacter, s_Woesei
21
0
0
23.24
0
886,523 220
188 58
2
0
23.08
0.36
540,522 151
Bog_474
p_Proteobacteria, c_Deltaproteobacteria, Bog_532 o_Syntrophobacterales, f_Syntrophaceae, g_Syntrophus, s_Aciditrophicus
83
x
x
x
x
x
x
x
x
x
x
x
x
oligopeptide/dipeptide
x
x
similar DDH %
x
x
x
x Acidimicrobium ferrooxidans, DDH 19.60% +/- 2.30
x
x
x
x
x
x
x x
x
x
x
x
x
x
x
x Methanosarcina acetivorans, DDH 69.70% +/- 2.92
x
x
x
x
x
x Anaerolinea thermophila, DDH 15.20% +/- 2.14
x
x
x
x
x
x
x
x
x
x
x
x
x x
x
gene present
dsr: dissimilatory sulfate reduction
RNA transcripts
fmd: formylmethanofuran dehydrogenase
proteins
mtr: Tetrahydromethanopterin S-methyltransferase N5-methyltetrahydromethanopterin:coenzyme M methyltransferase mcr: Methyl coenzyme M reductase
©2015 Macmillan Publishers Limited. All rights reserved
x
x
x
x
x
x
x
x
x
x
Methanosaeta concilii DDH 42.70 +/- 2.53 Methanosaeta concilii, DDH 46.60% +/- 2.58
x
x
x
x x
x
x
cysN/C: sulfate adenylyltransferase x
x
Molybdenum
x
Thiamin
p_Proteobacteria
Bog_15
x
Xylose
PF_8
x
x
NH4
4,300,461 237
x
NO3/NO2
522,584 134
1.28
aminoacids
1.72
89.74
P
31.9
0
Mn
0
2
x
Mg/Co/Ni
1
17 152
x
S
21
p_Actinobacteria, c_Actinobacteria, o_Acidimicrobiales, f_Acidimicrobiaceae, g_Acidimicrobium, s_Ferrooxidans
Fe3+
82
PF_400
transporter for methyl-H4SPT:coenzyme M methyltransferase
p_Gemmatimonadetes, c_Gemmatimonadetes, o_Gemmatimonadales, f_Gemmatimonadaceae, g_Gemmatimonas, s_Aurantiaca
1,497,758 371
CO dehydrogenase/acetyl-CoA synthase
PF_55 Permafrost
Size
phosphotransacetylase
0
mcrA, B, G
24.83
mtrA,C-E, G
0
fmdA-E
Contamination
0
cytochrome b/c
3
19
Active Layer AL_334
Marker Lineage
cysN/C
2
85
Bin ID
dsrA-B
1
p_Proteobacteria, c_Betaproteobacteria
Marker Gene Copies Zone
Contig Count
0
Completeness
methanogenesis
x
LETTER RESEARCH
524
simpson eveness
simpson
shannon
reciprocal simpson
doubles
827 223 1.008 8.306 0.992 0.001
Active_layer_A3
2790 1076.23
Active_layer_A4
9166 1939.81 1687.22 2077.29 0.014 1048
521 166 1.015 7.630 0.986 0.001
9217 3436.39 2831.32 3571.33 0.009 1361
815 183 1.010 8.128 0.991 0.001
Active_layer_A5
955.00 1368.01 0.016
OTUs
13196 3226.70 2798.70 3397.00 0.008 1544
singles
dominance
chao1 upper bound
Active_layer_A2
ACE
Sample
sequences after QC
chao1 lower bound
Extended Data Table 2 | Number of OTUs from 454 sequencing and alpha diversity indices
289
68 1.016 7.322 0.984 0.002
Bog_site_B1
10430 2332.45 2071.78 2532.03 0.026 1234
630 189 1.026 7.492 0.974 0.001
Bog_site_B2
9455 1800.56 1621.60 2010.99 0.024 1015
485 150 1.025 7.332 0.976 0.001
Bog_site_B3
8317 2039.81 1745.67 2127.27 0.024 1097
546 181 1.024 7.522 0.976 0.001
Bog_site_B4
8194 1611.11 1369.57 1726.94 0.031
428 135 1.032 6.913 0.969 0.001
Permafrost_layer_P1
7888 5228.38 4100.70 5016.39 0.019 1810 1208 268 1.020 8.195 0.981 0.001
Permafrost_layer_P3 Permafrost_layer_P4 Permafrost_layer_P5
853
20442 2333.84 2280.85 2901.55 0.035 1242 8935 1846.10 1575.33 2051.06 0.030
609 140 1.036 6.959 0.965 0.001
875
473 122 1.031 6.826 0.970 0.001
24306 2438.27 2220.88 2720.56 0.021 1333
622 173 1.022 7.274 0.979 0.001
©2015 Macmillan Publishers Limited. All rights reserved