Robotics and Autonomous Systems 59 (2011) 867–881
Contents lists available at SciVerse ScienceDirect
Robotics and Autonomous Systems journal homepage: www.elsevier.com/locate/robot
Multi-robot olfactory search in structured environments Ali Marjovi ∗ , Lino Marques Institute of Systems and Robotics, University of Coimbra, Portugal
article
info
Article history: Received 6 February 2011 Received in revised form 20 July 2011 Accepted 25 July 2011 Available online 2 August 2011 Keywords: Olfactory search Topological exploration Odor source localization Search in structured environments
abstract This paper presents a cooperative distributed approach for searching odor sources in unknown structured environments with multiple mobile robots. While searching and exploring the environment, the robots independently generate on-line local topological maps and by sharing them with each other they construct a global map. The proposed method is a decentralized frontier based algorithm enhanced by a cost/utility evaluation function that considers the odor concentration and airflow at each frontier. Therefore, frontiers with higher probability of containing an odor source will be searched and explored first. The method also improves path planning of the robots for the exploration process by presenting a priority policy. Since there is no global positioning system and each robot has its own coordinate reference system for its localization, this paper uses topological graph matching techniques for map merging. The proposed method was tested in both simulation and real world environments with different number of robots and different scenarios. The search time, exploration time, complexity of the environment and number of double-visited map nodes were investigated in the tests. The experimental results validate the functionality of the method in different configurations. © 2011 Elsevier B.V. All rights reserved.
1. Introduction Search and rescue operations inside buildings, caves, tunnels and mines can be extremely dangerous tasks. An example of such an extremely risky situation is human operation inside an industrial warehouse during a fire. In these cases, human senses can become severely impaired: smoke reduces visibility, communication is rendered impossible by the noise caused by the fire, and additionally, dangerous vapors and toxins may be released. The use of autonomous robots to assist such tasks reduces the risks involved in these operations. Robots can search for toxic chemicals and other desired targets while they explore the environment, providing real-time data about the discovered map and the status of the facility. An air scenting Search and Rescue (SaR) dog is especially trained to locate the scent of any human in a specific area and get close to the source of the scent; they can do so from hundreds of meters away, in heavy bush or in the dark. Handlers working with SaR Dogs are very much aware of surface winds. They position their dogs downwind from all portions of their assigned sector during the search. Future robots equipped with olfactory sensors can potentially preform the same task in SaR applications. This study was integrated in a European project named GUARDIANS1 and its main goal was to develop a group of autonomous robots to navigate and search urban environments. The
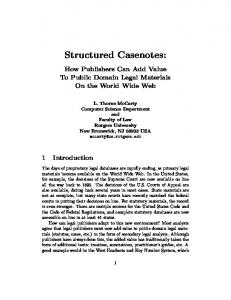
GUARDIANS central example was a search and rescue mission in an industrial warehouse (similar to Fig. 1) containing smoke. The robots should search for toxic chemicals (odor sources) and generate a map of the building while providing information for the firefighters. 1.1. Problem statement Consider a group of N mobile robots, moving in R2 that are labeled as R1 , R2 , . . . , RN . Each robot Ri (i = 1, . . . , N ) is able to communicate with the other robots located at a short distance ∆. The robots are equipped with sensors for measuring the odor concentration and air flow direction. There are unknown number of odor sources in the area which emit odor gas into the environment. There is no central base-station for the system, so the robots should act separately and independently from each other. There is no global localization system and the robots’ odometry is not very accurate. There is no prior knowledge about the environment except that it is a structured building similar to a warehouse containing corridors, corners, branches, crosses, etc. (Fig. 1). The problem is to localize all odor sources in the environment, explore the whole area, and generate a map of the environment. 1.2. Challenges
∗
Corresponding author. Tel.: +351912839734; fax: +351 239 406 672. E-mail addresses:
[email protected] (A. Marjovi),
[email protected] (L. Marques).
1 http://www.guardians-project.eu/. 0921-8890/$ – see front matter © 2011 Elsevier B.V. All rights reserved. doi:10.1016/j.robot.2011.07.010
a
Efficient search and exploration in unknown environments is fundamental problem for mobile robotics. As this problem
868
A. Marjovi, L. Marques / Robotics and Autonomous Systems 59 (2011) 867–881
Fig. 2. Multi-robot frontier-based search and exploration.
Fig. 1. Robots searching in a warehouse.
becomes increasingly solved by single robots, especially in obstacle free environments, the next problem is to extend these techniques to groups of robots on structured environments. Using multirobot systems may potentially provide several advantages over single robot systems, namely faster exploration, better accuracy, and system fault tolerance. However, in addition to the problems occurring in single robot olfactory search and exploration, the extension to multiple robots poses following challenges:
• Multi-robot olfactory searching. • Multi-robot task sharing and cooperation. • Localization and multi-robot mapping. 1.2.1. Multi-robot olfactory searching Most of the related works concerning olfactory search have focused on either single robot experiments [1–3] or multiple robots operating in open areas free of obstacles [4–6] with a background fluid flow. The odor is carried downwind originating from the source forming a plume. Due to turbulence the chemical concentration within the plume is patchy [7]. Researchers have developed methods that employ combinations and variations of plume acquisition [8,9] and plume upwind following [5,8,10] using reactive control algorithms (a comparison of these methods is in [11]). Most of these approaches are inspired by very simple creatures like moths [3], glowworms [12], etc., therefore they are mostly low-level algorithms making the robot react to the environmental changes based on some defined rules. Despite most of these works, this paper needs to fulfill the goal with higher level of cooperation of multiple robots in real structured environments. How can a group of robots efficiently localize odor sources in structured buildings? This is a challenge that should be more studied in the robotic community. 1.2.2. Multi-robot task sharing and cooperation Cooperation is a key parameter in the performance of a group of robots which are trying to solve a general search problem. The more robots that search an environment, the more important the coordination between their actions becomes. The cooperation, communication, and management of the robots in a multi-agent system can be done either in centralized way by using a base station as the server, or decentralized way by having a distributed behavioral based method (like in [13–15]). This study tackles the searching problem in unknown environments without using a central station. The lack of a central station makes it more difficult to distribute the tasks between the robots. Since the environment is unknown, the robots are unaware of the tasks before searching
the area, i.e. there can be no kind of task allocation before the start of the mission. Task allocation must be done automatically during the mission by the participating robots. The problem statement in this paper explained that there are unknown number of odor sources in the environment and the robots should localize all of them. Since the robots have no a priori knowledge about the number of odor sources they must operate in the environment until they cover all the area, i.e. they must continue searching while there are still unexplored areas. Therefore this search problem should be complimented with unknown environment exploration problem. Singh and Fujimura [16] presented a decentralized online approach for heterogeneous robots. In their method the robots work independently most of the time. When a robot finds a situation that is difficult to solve by itself, it sends the problem to another robot which may be able to solve the situation. The candidate robot is chosen by trading off the number of areas to be explored, the size of the robot and the straight-line distance between the robot and the target region. This technique generates a grid geometric map; therefore, the accuracy of the map depends on the grid size. Moreover, all the robots need to have a considerable amount of memory to store the entire map. Yamauchi [17] proposed a distributed method for multi-robot exploration, yielding a robust solution even with the loss of one or more vehicles. A key aspect of that approach involves sharing map information among the robotic agents so that they execute their own exploration strategy independently of all other agents. The robots move to the closest frontier2 according to the current map, however, there is no coordination component which chooses different frontiers for the individual robots. If the robots know their relative locations and share a map of the explored area, then effective coordination can be achieved through guiding the robots into different, non-overlapping areas of the environment. In other words, effective coordination can be achieved by extracting exploration frontiers from the partial maps and assigning robots to frontiers based on a global measure of performance [14,18]. Frontier based exploration is a simple approach for decentralized multiple robot task allocation (Fig. 2). These frontiers, thus, represent locations that are reachable from within the partial map and provide opportunities for exploring unknown terrain, thereby allowing the robots to greedily maximize information gain [19]. However, these methods should have a strategy to avoid sending two robots toward the same frontier. Most of the related works in this area (namely [18,14]) try to explore the environment with minimal excess effort in the minimum possible time, however, the main goal of this project is olfactory search rather than exploration. The exploration must be done in such a way that the group of robots automatically intends to look for the odor sources in the environment.
2 Frontiers are the borders of the partial map, between explored space and unexplored area.
A. Marjovi, L. Marques / Robotics and Autonomous Systems 59 (2011) 867–881
1.2.3. Localization and multi-robot mapping While multiple robots cooperatively search and explore an environment, information from individual robots must be integrated to produce a single globally consistent map. This is a difficult problem to solve when the robots do not have a common reference frame or physical global positioning system [20]. Most of the existing approaches to coordinate multi-robot mapping assume that all agents know their locations in a shared (partial) map of the environment [13,14,18]. Having a physical general positioning system is an undesired constraint in unknown areas where there is no previous knowledge about the environment. Simultaneous localization and mapping (SLAM) has been a topic of much interest because it provides an autonomous vehicle with the ability to discern and represent its location in a feature rich environment. Some of the statistical techniques used in SLAM include extended Kalman filters, particle filters (Monte Carlo methods) and scan matching of range data [21]. However, in the context of metric map building, SLAM’s performance depends on the accuracy of the environmental sensors and requires very high data processing and also communication between the robots. This work uses the concepts of topological SLAM [22] for creation of globally consistent maps of structured environments in real time within the computational limits of available hardware. Topological maps provide a brief characterization of the navigability of a structured environment, and, with measurements easily collected during exploration, the vertices of the map can be embedded in a metric space [20]. These maps use a graph to represent possibilities for navigation through an environment and need less memory than their metric counterpart. The proposed approach employs a topological mapping technique, so the robots only exchange few environmental features. Using topological maps, the problem of ‘‘map merging’’ is reduced to a ‘‘graph merging’’ problem [20,23]. Whereas most approaches to topological map merging and related problems have focused on using either map structure or map geometry [24], the proposed algorithm in this paper takes advantage of both. Similar to [20], the use of map structure allows quick identification of potential vertex matches in the maps (and rejection of mismatches), while the use of map geometry enables the algorithm to directly merge maps with multiple (disconnected) overlapping regions. However, if the geometric data of the local maps are not obtained through a unique coordinate system these methods are not functional. This paper deals with two issues concerning map merging, the first, dealing with the uncertainty in the localization of each robot by correcting it using the information of the partial maps, and the second, presenting an approach for map merging for the case in which the robots’ coordinate systems are different from one another. The main contribution of this paper is taking olfactory clues into the decision making of exploration of unknown structured environments with multiple robots. The proposed method is a decentralized frontier based algorithm enhanced by a cost /utility evaluation function that considers the odor concentration and airflow at each frontier so that the robots will try to find the odor sources as fast as possible. The researchers who have presented cooperative multi-robot approaches in the field of olfactory search, have not addressed the problem by a frontier-based search and exploration method (maybe one of the reasons is that most of them do not consider the problem in structured environments and with multiple robots). On the other hand, the researchers who have been working on multi-robot unknown environment exploration have not addressed the problem of olfactory search. We believe that for searching olfactory sources in unknown structured environments by a team of robots, modified exploration methods can practically address the problem.
869
In our previous studies [13,18], techniques for multiple robots that intended to explore an unknown environment and generate its topological map were presented. In those studies the robots explore the whole environment but the current research tries to search the environment based on the odor concentration that is reported in each frontier while at the end the whole environment will be explored. ‘‘Cooperation’’ is done by sharing and integrating the local robots’ information into the topological map. Each robot transfers its own local data (including its aimed target) to the other robots. In this way the whole group is aware of the explored environment and therefore is able to make future decisions based on that information. Moreover, the robots maintain a policy of avoiding collisions between each other. ‘‘Task sharing’’ is performed based on the following policy; the robots automatically pick up the tasks such that the unexplored frontier with the highest odor concentration will be assigned to the nearest idle robot. In terms of ‘‘map merging’’ this paper proposes a method based on subgraph isomorphism that works even if the robots do not have the same reference coordinate systems. 2. The proposed method It is desired to find odor sources and explore the whole environment as fast as possible. Therefore, it is essential that the robots share their tasks and individually achieve the objectives through optimal paths toward the odor sources. In an unknown environment, the immediate goals are the frontiers. while the robots are exploring an area, there are several unexplored regions, which poses a problem of how to assign specific frontiers to the individual robots without the existence of a specific task allocator. In the proposed approach, the robots firstly decide to explore the frontiers which indicate higher odor concentration. The robots must avoid selecting the same frontier, this may result in collision concerns. Another problem is the lack of base station, so the robots should be able to explore autonomously and also avoid collisions between themselves. To address these problems, the proposed method is based on a behavioral decision-making exploration strategy that is shown in Algorithm 1. The flowchart of this method is depicted in Fig. 3. 2.1. Odor source search and exploration algorithm Algorithm 1 describes the decision making technique that should be run on every robot. The robots start exploring the environment independently. Each robot goes forward to get into new features in the environment. It generates its own local topological map out of the detected features of the environment and also transmits this local map to the other robots which are working on the same environment. When a robot has to make a decision to select its future path (e.g. in the branches), it first measures odor concentration in that place. If the odor concentration is more than a certain threshold, it means that the robot is in an odor plume and it must go up-wind direction in order to localize the source. However if a robot is traveling inside an already explored area and wants to select a frontier to explore, the frontier should be selected based on the cost of reaching it and the utility it can provide to the search. The cost is calculated through the A* method [25], where it simultaneously determines the optimal path to reach the frontier and its distance. Therefore, the cost is proportional to the distance that the robot has to pass to reach the frontier. cost (i, R) = dist (A∗i=0,n [(XR , YR ), (Xfi , Yfi )]) where:
(XR , YR ) → position of the robot R (Xfi , Yfi ) → position of the frontier i n → number of frontiers.
(1)
870
A. Marjovi, L. Marques / Robotics and Autonomous Systems 59 (2011) 867–881 Algorithm 1: Odor source search and exploration algorithm 1 2 3 4 5 6 7 8 9 10 11 12 13 14 15 16
// Definitions: // feature: features are corridors, corners, etc. in a structured environment. // node: a node represents an environmental feature in the topological map. // frontier: an unexplored link in a node in the map. begin while there is at least one frontier in the map do repeat Go forward and follow potential field algorithm() Path planning improvement() // explained in Section 2.4 Feature extraction() // explained in Section 2.2 until getting a different environmental feature; C = Measure odor concentration() W = Detect wind direction by anemometer() if current node exists in the map then Update map’s data() Localization correction() // explained in Section 2.6
17 18
else
19 20
if (M >odor_threshold) and (W is not explored) then Set Objective to go(W )
21 22 23 24 25
else
26 27
if Odor source detected() then Report this place as an odor source into the map()
28 29 30
Send the new local map to the other robots() if received map data from other robots then Map Merging() // explained in Section 2.5
Add current node to map()
F = unassigned frontier with highest Utility − Cost() Assign frontier F to this robot() // in the map D = the best path based on the A∗ algorithm(F ) Set the new Objective to go(D)
31 end
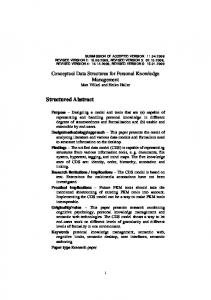
Fig. 4. 3 robots searching in a small-scaled structured environment. Fig. 3. The flowchart of the proposed method.
The utility depends on the level of odor concentration in that frontier, which means that if there are several frontiers at similar distances, the robot will go to the one that has higher utility, i.e. higher odor concentration.
∀i ∈ {1 . . . n} utility(i) = Odor_Concentration(i).
(2)
The profit of a frontier i for a robot R is then calculated as profit (i, R) = utility(i) − β × cost (i, R)
(3)
where β represents a coefficient representing the relative values of cost and utility. Since each robot always tries to maximize the profit function in its frontier selection, the frontiers with higher odor concentration will be explored faster by the robots which are more close to them. Fig. 4 shows a snapshot of three robots searching in a structured
environment. The already explored area is highlighted and the frontiers are colored by green. The robots select frontiers based on the explained algorithm. During exploration and navigation, the robots are simultaneously acquiring olfactory information (odor concentration and air flow direction) of the environment. While a robot is traveling upwind direction, if the level of detected gas decreases suddenly it means that the robot has passed an odor source during its path. On the other hand, if a robot is traveling in the down-wind direction and it starts to detect a high concentration of odor, it means that there is an odor source in this location. The robots generate the topological map of the environment during their search and exploration mission. Within the topological map, besides having information regarding the kind of nodes, their position and the odor concentration in that feature, it also has data describing the location of the robots and their target frontier. Through this data, a robot can see which frontiers are unexplored, their position and if any robot has targeted them as its objective
A. Marjovi, L. Marques / Robotics and Autonomous Systems 59 (2011) 867–881
871
Table 1 Characteristics used in classifying the environmental features. Feature name
No. of blobs
No. of segments
No. of corners
Histogram peaks
Corridor Corner T -junction Cross Dead-end
2 2 3 4 1
2 4 5 8 3
0 2 2 4 2
0 0 and 90 0 and 90 0 and 90 0 and 90
Fig. 5. Feature detection, left: corridor, right: branch.
(see Fig. 11). Therefore, the robots will not attempt to explore the same frontiers. Each robot is aware of the frontier that the other robots have aimed to explore, so it will choose another frontier that is unexplored and unassigned to any other robot. As a result, the robots will autonomously pick up the tasks in a way that not any frontier will be assigned to more than one robot. The robots repeat this procedure while there is at least one unexplored frontier in the environment. At the end all odor sources will be localized and the whole environment will be explored, no matter how many odor sources are in the environment or how many robots participate in the search. 2.2. Environmental features With the type of environment considered in this paper, there are five types of features that can be extracted; corridors, corners, crosses, T -junctions (branches) and dead-ends. The robots recognize environmental features based on a local metric map (also called local sensing frame) constructed with the range sensors while the robot moves across the environment. Fig. 5 shows a robot in different environmental features and Fig. 6 shows local sensing frames extracted by the robots. The known features are classified based on the differences that they show in their sensing frames. Similar to several other studies (e.g. [26]) this paper uses pattern recognition algorithms that has been addressed in its literature. Blob detection [27], line-segment extraction [28] and corner detection [29] are used to classify the features (See Table 1). A dead-end (shown in Fig. 7) has only one blob that is a unique identification of this feature among all the other ones. T -junction has 3 blobs, cross has 4 blobs, corner has 2 and corridor also has 2 blobs. To correctly identify the features, similar to the method used in [30] for corridor detection, the histogram of dominant angles of the extracted blobs is calculated to provide more clues to correctly identify the features. For example one of the differences between a corridor and a corner is that a corner has a peak in the
Fig. 7. Feature detection process, blob detection and Segment-line extraction in a T -junction (left) and a dead-end (right). The blobs are presented in yellow and the extracted lines are presented in red. (For interpretation of the references to colour in this figure legend, the reader is referred to the web version of this article.)
90° value of its histogram since it has two 90° angles in its segment lines, but the corridors do not. This histogram is also useful to avoid the false positive results and is applied to detect the other features (e.g. dead-ends). Table 1 presents the characteristics of different features based on mentioned parameters. The function IsSimilar() in Algorithm 2 does the blob detection, corner detection, segmentline extraction and histogram calculation on the acquired data and returns True if the local sensing frame presents the same characteristics as the compared known feature. Algorithm 2: Feature detection algorithm 1 2 3 4 5 6 7 8 9 10 11 12 13 14 15 16
// Inputs: // Known_Feature[]: dataset of sensory data of the known features // M: Number of needed iterations to process an area // N: Number of needed similar features to recognize that feature as detected // Output: Detected feature Start: i=1 repeat Found = False while !Found do S[] = acquire sensors’ data() foreach Known_Feature[k] do if IsSimilar(S[],Known_Feature[k]) then F[i++] = Known_Feature[k] Found = True Break
17 18 19 20 21
until i ≥ N; MF = Most_repeated_Value_in_F[] Freq = Frequency_of_MF_in_F[] if Freq ≤ M then Goto Start // did not detect any feature!
22 return (MF)
In Algorithm 2 the robot constantly tries to detect the environmental features of its surrounding area. If at least in M out of N iterations the robot detects one feature, it considers this feature as the detected feature of the local area. The values of M and N depend
Fig. 6. Local sensing frame in different features. Left to right: Corridor, Corner, T -junction, dead-end.
872
A. Marjovi, L. Marques / Robotics and Autonomous Systems 59 (2011) 867–881
on its current velocity v ⃗ (t ) and the forces that are applied to it F⃗ (t );
v⃗ (t + 1t ) = v⃗ (t ) + µF⃗ (t )1t
(4)
with µ a constant coefficient. The equation of forces that is applied to a robot is given by: F⃗ (t ) = c1 (Goal_Pose − x(t ))n +
Fig. 8. Artificial attractive/repulsive forces in an unknown environment. d1–d5 correspond the distance measured by five sonar sensors. R1–R5 are the artificial repulsive forces that are calculated based on the inverse distance of d1–d5. ‘‘A1’’ represents the artificial attraction to the targeted goal. ‘‘A/R’’ shows the summation of the attractive and repulsive forces and the direction that the robot actually takes.
on (i) the velocity of the robot, (ii) the accuracy of the sensors and (iii) the characteristics of environmental features. If the robot could not detect M similar features in N iterations, it must slow-down its speed and does the feature extraction of that place from the beginning. Based on this method the robots were able to accurately classify the environmental features in the testing environments. It was found that this feature extraction and classification process highly depends on the accuracy of sensory system. The accuracy of the sonars that are used in the maze-like environment tests (explained in Section 3.1) is less than 3 cm in the range of 1.5 m. Having this accuracy, the robots could perfectly distinguish the environmental features from each other. If the environment has more complex features the sensors of the robots also need to be more complex. In all of experiments in this paper, it is assumed that the robots are able to accurately classify the environmental features. This study has tried to design and explain the algorithm independent from feature extraction methods. In fact any kind of environmental feature extraction technique that can lead to topological mapping is appropriate to be used in this project. We used five sonar sensors mounted on different sides of robots and Algorithm 2 to distinguish basic environment features from each other, i.e. each robot can recognize if it is located in a corridor or in a corner or any other environmental feature. We have also tested this process using a Laser range finder instead of sonars with a few minor changes in extracting local sensing frames. 2.3. Robots’ motion The low level of autonomous navigation of a robot relies on the ability of the robot to simultaneously achieve its target goal and avoid the obstacles in the environment. In an unknown environment the robot should reactively avoid the obstacles while exploring. To avoid the obstacles, a reactive potential field control method [31] was used. The targeted goal of the potential field is provided by the exploration algorithm (explained in Section 2.1) and the distance to obstacles are measured by the range sensors. In this method, the goal generates an attractive artificial force, while the obstacles generate artificial repulsive forces to the robot. The resulting motion is obtained by the summation of these attractive/repulsive forces. Fig. 8 illustrates the action of this method in a corridor. Considering the robot holonomic with N range sensors, its next velocity v ⃗ (t + 1t ) can be calculated based
N −
c2
j =1
|d(j)|m
⃗ j ). (Vec
(5)
The position of the robot at time t is described by x(t ) ∈ R2 . Goal_Pose − x(t ) is the distance vector between the robot and its targeted goal. The first term in (5) is an attraction force toward the goal that its amplitude is relative to the distance between the robot and its goal. Since d(j) is simply the distance between the robot and the surrounding environment that is reported by the sensor j, the second term is a force that is the inverse function ⃗ j is a of the distance of the robot to the surrounding obstacles. Vec predefined vector whose magnitude is set to one and its direction is from sensor j toward the center of the robot. c1 and c2 are two positive coefficients and n and m are even integer parameters, therefore the first term is always a force toward the goal and the second term is a forces from obstacles toward the robot, meaning that, the robot will try to get far from the obstacles and reach its targeted goal. 2.4. Path planning improvement for exploration enhancement Robots’ motion is controlled through potential fields. This technique of motion planning avoids static obstacles very well, but in situations that two or more moving robots are facing to each other in narrow corridor, this technique makes the movements very slow and the performance of the mission gets low. In order to improve the exploration process, this paper presents some control rules to prevent this kind of situations. These rules are shown in Algorithm 3. In this algorithm, each robot considers a virtual bubble around itself. Once another robot enters to this bubble, this robot checks the probability of direct collision between them. The policy is to give priority to one of them, so one of them stops and the other passes through the area. If one of the robots is located in the already explored area, the one that is exploring a frontier will have higher priority. But if both are in the same conditions the one that has lower robot ID has the priority (Algorithm 3). 2.5. Map merging Consider several robots searching in a single environment while each one has its own coordinate system. Their axes of X and Y do not match with each other and moreover they do not know where the reference point of the other’s localization system is. Each one of them is generating their own topological map of its visited local area. They are simultaneously sending these local self-generated topological maps to each other. The problem is ‘‘how each one of them can integrate the data coming from the others to its local map and generate a bigger map?’’. Fig. 9 shows an example of this problem. There is no central station unit for attuning the robots; moreover, there is no specific landmark in the environment. Therefore, the robots should solve the problem in a distributed way. Similar to [32,20], in this method, the generated map represents more than just the structure of the environment. Additional information, such as the degree of vertices, the orientation of edges at vertices, and other attributes, is recorded and stored in annotations of the graph. Fig. 11 shows an example of the topological map’s data with some descriptions. The next step is to match the topological maps and generate a
A. Marjovi, L. Marques / Robotics and Autonomous Systems 59 (2011) 867–881
873
Algorithm 3: Path planning improvement 1 Calculate a confined circular area around the robot() 2 if any other robot is inside the circle then 3 if there is a possibility of being in a direct collision pattern then 4 if it is a direct collision path then 5 Recalculate the objective() 6 7 8 9 10
else if both currently exploring frontiers OR both moving inside explored area then //Give priority to the one which has lowest ID. if the robot ID is higher that the other robot’s ID then go back to previous node and stop for a while() // so the other robot passes else
11 12 13 14 15 16 17 18
Continue navigating else //Give priority to the one that is exploring a frontier. if the robot is inside explored area then go back to previous node and stop for a while() // so the other robot passes else
Fig. 10. Matching generated maps of two robots exploring the environment in Fig. 9.
Continue navigating
19 else 20 Continue search and exploration algorithm.
Fig. 9. An environment being explored by two robots with different coordinate systems.
merged global map out of them. We consider the problem of ‘‘map merging’’ as a ‘‘graph matching’’ problem (see Figs. 9 and 10). One of the problems in graph matching is error-tolerant subgraph isomorphism. The robots should identify a common subgraph when there may be missing vertices and edges. The proposed method is a decentralized frontier based algorithm enhanced by a cost /utility evaluation function that considers the odor concentration and airflow at each frontier. Common subgraphs H1 = [V , E , k] (where V is the set of vertices vi , E is the set of edges ei and k is the subgraph size) and H2 = [W , F , k] of two given graphs G1 and G2 are isomorphic to each other if there is such numeration of subgraphs’ vertices x(i) and y(i), that ∀i, j ∈ {1 . . . k} ?
Equivalence_vertex_function(vx(i) , wy(i) ) = true
(6) ?
Equivalence_edge_function(e(x(i),x(j)) , f((y(i),y(j))) ) = true.
(7)
This paper defines the stated terms as following: ‘‘Equivalence_vertex_function’’: Two vertices are equivalent if their vertex types (presenting environmental features) match
with each other. Since we only have five types of environmental features in structured environments (corridor, corner, T junction, cross and dead-end), this literally means that a vertex that is presenting a cross is not matched with a corridor or a T -junction. ‘‘Equivalence_edge_function’’: Two edges are equivalent if their lengths are approximately equal and their connecting vertices are equivalent. Now we just look for numbered sets X = {x(i)}ki=1 and Y = {y(i)}ki=1 , satisfying conditions (6) and (7). In other words, it is required to find all pairs of matching vertices in the subgraphs which are connected by matching edges (including the null edges). Since the coordination systems of the robots are not aligned, the conditions (6) and (7) are not defined based on the position of the vertices (despite many previous works in this field). By that, the subgraphs match with each other regardless to the positions of the vertices but based on their topology. In the current work it is assumed that the robots start from the same point (usually an entrance of the building) at the beginning of the mission. By this assumption it is guaranteed that the first vertex of all local maps is from the same point, therefore the graphs always have at least one common subgraph and the robots are able to merge their maps in any case, while their coordinate system is not matched to one another. Whenever a robot finds a new feature in the environment, it adds this feature as a new node to its local map and sends a message to all the other robots and reports the new map. If a robot is walking inside already explored environment and gets into another feature that is different from its previously detected feature, it modifies this feature in its local map and again sends a message to all the other robots and reports the modifies map. On the other hand, each robot has a running memory-resident program that always is listening to the network and receives all the messages that are sent by the other robots. When a robot receives a message that shows another robot has found or modified a feature in its map, it starts the hypothesis building process by creating the list of all vertices in the local topological map that are structurally compatible with the new map (conditions (6) and (7)). Vertices are tested for compatibility by examining their attributes: exactly known attributes (e.g., vertex type) must match perfectly; inexactly known attributes (i.e., due to measurement error) must be compared with a similarity test. For the similarity check of inexact attributes, a threshold is defined based on the accuracy of sensors and the localization
874
A. Marjovi, L. Marques / Robotics and Autonomous Systems 59 (2011) 867–881
Fig. 11. An example of topological map data.
system. Since the localization is improved using the method explained in 2.6 the measurement error in the environmental features was always less than a few centimeters. Therefore a threshold of 10 cm is defined to compare the feature nodes of topological maps. This means that if one corridor is 90 cm length, it is similar to a corridor that is 99 cm. However, it is practically impossible that the robots make this mistake since not only the feature type and other attributes (e.g. length and width) must be similar for two features, but also the nodes that are connected to them should be the same. The threshold of this similarity test raises a constraint of minimum feature size and minimum feature distance to the testing environments. Having a threshold of T in similarity check means that the minimum length of environmental features must be bigger than T and the distance of two similar environmental features (features of the same type, e.g. the distance of two corridors) should be at least T . In these conditions the robots correctly distinguish similar environmental features from each other. Once a robot finds a subgraph in another map that is isomorphic to a subgraph of its own map, it will merge these maps together after finding the geometric transform function that converts the positions of the vertices of the second map to its current map. Since a position correction method is used (described in the next section) that corrects the localization of the robots, a linear function is good enough to transfer the coordinates of two maps to each other. The transform function is defined by a linear geometric calculation. Finally, the robot is able to add all the nodes of the other map to its own map after transforming their positioning data to its coordinate system. Having this transform function, the robots are also able to know where exactly the other robots are located and which frontiers are assigned to which robots. If the robots are not in communication range ∆, they independently explore the environment and share the maps whenever they are able to communicate. 2.6. Localization correction Robots’ localization is a key issue in multi-robot mapping and exploration. This work does not consider a global positioning system. The only tool that the robots have for determining their position is their odometry. However, the odometry is unreliable because of uneven floors and wheel slippage. It is therefore
necessary to increase localization accuracy by measuring position of the robot relative to known objects in the environment. Normally odometry errors accumulate incrementally as the robot is traveling, therefore, the robot’s localization is more accurate at the beginning of an experiment and loses its accuracy during the test. If the robot enters in an environmental feature that has already been explored, it can look at the map and find the start position of that feature, then correct its localization based on the data that has been stored in the map. It does not matter if this feature was added to the map by the current robot or by another robot in the team, since the feature has been added to the map in the past; it means that the location that was saved in the map is more reliable than the current localization of the robot. This method is only used when the robot is passing an area that has already been explored. In addition to correcting odometry errors using map’s data, the robots are able to correct their internal odometry angle based on the features of the environment. Since in usual structured buildings, all the corridors are parallel or perpendicular to the main direction, similar to [33], when the robot detects a corridor and is moving along it, the robot is able to correct the localization angle. This method is used in the unknown area as well as in the already explored environment. 3. Experimental results3 The proposed method has been tested and validated both in real world and in simulation. The functionality of the method in searching and exploration in a structured real environment has been verified. Afterward, in order to evaluate the method in more complex environments, the method has been tested in simulation. 3.1. Experiments in maze-like environments The proposed method was tested in different reduced scale maze-like environments, like the one shown in Fig. 14. This testing arena, with 3×4 m2 area by 0.5 m height, has controlled ventilation through a manifold that extracts air from the testing environment through a honeycomb mesh integrated into one of the walls. The opposite surface of the environment contains a similar mesh that allows the entrance of clean air that flows through the environment. Controlled gas sources are simulated with ethanol vapor, generated using bubblers and pumped to different places of the environment through a set of PVC tubes. Fig. 13 shows a chemical release mechanism that is used as odor source in the experiments. Inside this environment, a maze like structure is built to simulate real structured buildings. This environment is consist of corridors, crosses, corners and dead-ends. 3.1.1. The robots The iRobot4 Roomba was used in the experimental tests. This is an attractive platform because it is inexpensive, readily available and can be fully monitored and commanded through a serial port interface. In the current work, a set of Roombas were upgraded with a small laptop computer (ASUS Eee PC 901) running a Linux based operating system and the Player5 environment. The computer interfaces through a micro-controller board with a set of five sonars, three 2-D anemometers and a gas sensing board (Fig. 12). Based on values measured by sonar sensors, the robots recognize the basic environmental features (e.g. corridors,
3 The source code of all parts of this study are available online in http://www.isr.uc.pt/~ali/multiexp.htm. 4 http://www.irobot.com. 5 http://playerstage.sourceforge.net.
A. Marjovi, L. Marques / Robotics and Autonomous Systems 59 (2011) 867–881
875
Fig. 12. iRobot Roomba robot equipped with a laptop and sonar, gas, and anemometer sensors.
Fig. 13. The chemical release mechanism.
dead-ends, etc.). The gas concentration was measured with a custom sensing board based on metal oxide gas sensors (Figaro6 TGS2620). The directional anemometer was designed based on three self heated NTC7 sensors placed around a triangular prism and processing the raw measurements with a method similar to the one previously described in order to estimate the wind direction [34]. The Player/Stage driver for Roomba robots makes it possible to run the same code either in simulation or on the real Roomba robots. 3.1.2. Experimental validation In order to evaluate the method, the algorithm was experimented in the previously described environment with one, two and three Roomba robots separately, first without having any odor source, and then with an odor source releasing gas in the leftbottom corner of the arena at eight centimeters height, as shown in Fig. 15(1). The robots have no a-priori knowledge about the number of odor sources existing in the environment. When there is no odor source in the environment, all frontiers have the same utility and the search algorithm acts like a pure frontier based exploration algorithm that is enhanced by avoiding collisions between the robots. The method is validated by comparing the results and analyzing the behavior of the robots. Fig. 14 shows three robots exploring a small maze while searching for odor sources. In this experiment there were no odor sources. All robots started from the same point but not at the same time and were run a few seconds after each other (like if they
6 http://www.figarosensor.com. 7 Negative Temperature Coefficient.
Fig. 14. Three robots exploring a gas free environment.
were deployed at the entrance of a warehouse). The red footprint shows the first robot’s path, the blue footprint is related to the second robot and the green shows the footprint of the third robot. These experiments show the functionality of algorithm in different maze structures and with different number of robots. Frame 3 of
876
A. Marjovi, L. Marques / Robotics and Autonomous Systems 59 (2011) 867–881
Fig. 16. Generated maps for the environment in Fig. 4, red: without localization correction, green: with localization correction. (For interpretation of the references to colour in this figure legend, the reader is referred to the web version of this article.)
Fig. 17. Exploration time, with/without odor source.
Fig. 15. Three robots exploring the environment and finding the odor sources.
Fig. 14 shows an example of coordination between the robots; when the second robot reached the junction it figured out that the path in the front was already explored so it chose the left path. In frame 5, the third robot had decide to either take the front or the left path, since both paths were already explored, it
checked the nearest unexplored and unassigned frontier in the map that was provided by the other robots and finally chose the front path. ‘‘Path planning improvement’’ is presented in frames 9 and 10, when the second robot goes backward for a while to avoid possible collisions with the first robot. Fig. 16 shows a topological map generated by the robots in one experiment over the real topology of the testing environment. The red lines and vertices demonstrate the generated topological map before implementing the proposed localization correction method, and the green shows a map after applying the localization correction technique. The effect of localization correction technique is significant, e.g. all the lines of the green map are parallel to the corridors. The robots correct their odometry during the mission so the maps’ errors do not accumulatively increase. The maps out of several tests were similar, however they did not match perfectly. Fig. 15 shows the tests done with the same maze structure and the same robots, but with an ethanol odor source on the left side of the environment. The first robot in the first branch decided to go to the left-way because it sensed an odor clue in that direction (red footprints). The other robots also automatically changed their path in accordance with the new conditions. The results show the effect of odor concentration on the behavior of the robots. In each test the exploration time, that is the time it takes to cover all the maze paths, is measured. Fig. 17 shows that the complete exploration time is higher when considering gas cues, however the difference is less than 21%. Fig. 18 shows the time to reach the target (the location of the odor source) in these two scenarios. The chart shows that the robots reach the target much faster with having gas cues rather than without having it, which shows the functionality of the algorithm. Each result is the average of five similar tests. Different tests with constant conditions had similar results with about eight percent variance. The maximum speed of
Time to reach the target (sec)
A. Marjovi, L. Marques / Robotics and Autonomous Systems 59 (2011) 867–881
300
877
3.2. Performance assessment
250 200 150 100 50 0 1
2 Number of Robots
3
Fig. 18. Reaching the target (the location of the odor source), with/without olfactory cues. Without odor source the method acts like a pure frontier based exploration algorithm.
Fig. 19. Model of a testing environment in simulations.
the robots was kept constant in the tests. More experiments were done by placing the odor source in other locations of the arena and the results were similar to the graph in Fig. 18. The robots were initially released at the downwind side of the testbed (similar to many other previous works namely [10,8]) in the experiments. This is the same task that the handlers of SaR dogs do at the start of the search mission. In fact if we position the robots on the other side of the environment (upwind side) they will not be able to sense the odor and therefore they will explore the environment until they eventually get into the active odor plume area. The same point is valid if there is no air-flow in the environment, i.e. in this case the robots mostly explore the environment rather than tracking odor plumes and anyways they will intend to explore the frontiers with higher odor concentration first.
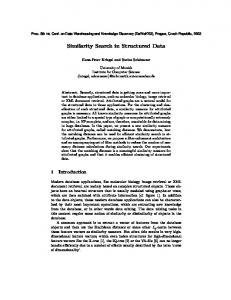
For evaluating the exploration algorithm and measuring its performance, the Player/Stage framework [35] was used, since in the real world, there are several constraints that do not allow easily testing the proposed method. The Player/Stage framework provides a very easy way of testing and monitoring the proposed algorithm in different configurations. Most of the parts of proposed method including decision-making, feature extraction, robots’ motion, localization correction, path planning improvement, and map merging are imported to the simulation with a few minor modifications. Only some parts related to sensory interfaces are totally changed in the simulations. Regarding the world model, in compare with real-world experiments, bigger and more complex environments are tested in the simulations. PlumeSim [36] is used for simulating odor plumes inside Player/Stage. It is capable of feeding simulated chemical plumes into Player/Stage from a wide variety of sources, from analytical models to data generated by CFD software. In this work the model of testing environment that is presented in Fig. 19 was given to ANSYS Fluent CFD [37] software to simulate odor sources and provide odor concentration data. 3-D ANSYS Fluent is used to simulate the odor plume, however, the robots move on the 2-D floor with gas sensors at 10 cm height, so, only the airflow and concentration measured by the robots at that height are relevant for their decisions. Fig. 20 shows four snapshots of 3-D plumes propagation during the time in one of the tested scenarios. The 2-D data is given to the PlumeSim simulator in Player/Stage and is shown in Fig. 21. This environment contains three simulated odor sources in three corners of the arena (the other corner is the entrance door). The airflow was ventilated from the inlet side (left) with constant speed of 0.5 m/s. Since the environment contains several obstacles, the flow velocity varies in different parts of the environment. For example in the left-top corridor, the air has lower velocity relatively to the bottom corridor since there is an obstacle in its front. As it is shown in the simulation snapshots of Fig. 20, the odor propagation directly depends on the airflow velocity. Fig. 22 shows the average results of five tests with one, two and three robots. A conclusion from Fig. 22 is that having more robots is more advantageous in finding more odor sources. Similar to many multi-agent systems, reduction of operation time by using more robots is calculated by speed up formula as below: Speedup =
Tsingle Tmulti
Fig. 20. ANSYS Fluent simulation results; contours of mass fraction of ethanol propagated in the testing environment of Fig. 19 during the time.
878
A. Marjovi, L. Marques / Robotics and Autonomous Systems 59 (2011) 867–881
Search time (s)
Fig. 21. Robots searching for simulated odor sources in Player/Stage.
600
Fig. 24. A maze with 34 nodes.
500
exploration problem would be reduced to the standard wellknown ‘‘multi-agent traveling salesman’’ (TSP) problem. It is very obvious that the exploration method will never be better than solution of traveling salesman problem, because the robots do not have a priori map of the environment before exploring but TSP does have the world model before the mission. However, the proposed search and exploration method are compared with the results of traveling salesman solution as an unreachable, more than perfect, optimal method. This can be a good criterion for evaluating the method. The method was tested with different number of robots in three different mazes (see Figs. 24–26). These mazes were also used to run an optimal TSP algorithm and the results are compared in Fig. 28. The graphs show the average of five tests for each data. The variance was less than five percent. The results show that the exploration time improves with higher number of robots. Another conclusion is that having more robots is more advantageous in a complex maze than in a simple maze. This also shows that the cooperation algorithm in this approach is efficiently functional. A repeated node is a node that robots pass more than once. Another good parameter for measuring the performance of the method is counting repeated nodes since these represent losses of performance. Fig. 27 shows the number of nodes that have been repeated more than once in the TSP algorithm as well as in the proposed method for the maze shown in Fig. 24. Although Fig. 27 shows that the number of repeated nodes is more in the proposed method comparing with TSP, the results are acceptably comparable especially considering the fact that TSP has prior knowledge about the world but the robots in the proposed method do not. A conclusion from Figs. 27 and 28 is that there is a trade-off between the number of robots and the size of the world since the number of repeated nodes tends to increase with the number of robots (e.g. when the number of robots is four, for the maze shown in Fig. 24, the number of revisited nodes is more than when there are three robots). However, Fig. 28 shows that even in this case the exploration time is improved. The algorithms and their parameters were modified and adjusted after several simulation experiments. For example, the value of k (common subgraph size) in conditions (6) and (7) is a critical issue. Based on simulation experiments, it was figured out that it is good enough to set k to eight. This means that if two robots find a common subgraph with eight vertices, they can merge their local maps together. However, this value is highly dependent on the structure of the environments. If an environment is rich of unique
400 300 200 100 0
1
2 Number of robots
3
Speedup, search for odor sources
Fig. 22. Results for different number of robots finding multiple sources.
2.5 2 1.5 1 1
2 Number of Robots
3
Fig. 23. Speedup for different number of robots finding multiple sources.
where:
• Tsingle : Operation time of the method using one robot. • Tmulti : Operation time of the method using several robots. In Fig. 23, it can be seen that speedup is more for more odor sources, i.e. having more robots in the operation will result in better search time in looking for more odor sources. The worst case in the search operations is when the robots search for odor sources but there is no odor source in the environment. In this case the robots have to cooperatively explore the whole environment without having any olfactory cue. Therefore, the method is tested in simulation in different environments without having any odor source to evaluate its ‘‘exploration’’ ability in complex scenarios. One of the possible ways to measure the performance of the proposed method is to compare it with an optimal method. However, there is no optimal method for exploring an unknown world. If the robots had prior map of the environment, the
Number of repeated nodes
A. Marjovi, L. Marques / Robotics and Autonomous Systems 59 (2011) 867–881
879
30 25 20 15 10 5 1
2 3 Number of Robots
4
Fig. 27. Number of repeated nodes, comparing the results of the proposed method with the TSP method in maze shown in Fig. 24.
Exploration Time (Min)
35 30 25 20 15 10 5 0
1
2 3 Number of Robots
4
Fig. 28. Test of various numbers of robots against complexity of the environment, 1: maze in Fig. 24, 2: maze in Fig. 25, 3: maze in Fig. 26.
Fig. 25. A maze with 82 nodes.
of performance increase. The ideal number of agents for the most efficient exploration of an environment depends on the nature of the environment. The large environment of Fig. 26 showed greater improvements in the exploration performance when the number of agents was increased. Another significant point is that the method is fully functional even in the case of some robots’ failures. If one or several robots fail during the operation the other robots will accomplish the mission. A not studied problem is when there are partially malfunctioning robots, in this case the robots might send wrong information about the environment to the others and the whole mission may fail. Regarding olfactory search the presented method does not have any assumption regarding air flow. If there is detectable air flow in the environment the robots take this clue inside their decision makings, but if there is no air flow the search algorithm acts like a cooperative exploration method. In the later case, the robots can eventually find odor sources (if there is any) during the exploration of the environment. 4. Conclusions and discussions
Fig. 26. A maze with 135 nodes.
features this value should be less and if an environment is full of similar features this value must be higher. The effectiveness of the algorithm was investigated as a function of the number of robots available. Ideally, it would be expected that doubling the number of agents would halve the time required for search and exploration. However, Even with a priori map information it is often not possible to achieve this amount
An algorithm for multi-robot odor source search, exploration and topological mapping inside large buildings composed by parallel and perpendicular corridors (warehouse-like environments) was proposed. The algorithm was experimentally validated in a small, realistic testing environment with up to three Roomba robots. Details about all the complementary aspects required to such implementation are provided. These include motion control, feature extraction and classification, localization and map merging. The exploration efficiency is improved by integrating odor sensing cues in the frontiers selection so they navigate toward the odor sources and localize them while cooperating with each other by sharing information in their local maps. If the robots do not sense any olfactory clue, they try to efficiently explore the environment
880
A. Marjovi, L. Marques / Robotics and Autonomous Systems 59 (2011) 867–881
until they get into active odor plume area. When a robot is inside an odor plume (sensing high odor concentration) it intends to track the plume by traveling in the upwind direction. In the case that a robot is in a situation that wants to make decision to select a frontier, it picks up the frontier with highest odor concentration. In terms of mapping, the robots generate the topological map of environment during exploration. Map sharing is the main tool for automatic distributed task sharing and cooperation in this method. The robots merge their topological maps based on common subgraph isomorphism techniques even if they do not have common coordinate systems. Based on the stored information inside the maps, each robot knows the location of unexplored frontiers and assigns one of them to itself as a target to explore, so the other robots will not select the same frontier. In addition to real world experiments, the algorithm has been simulated against a large variety of configurations in the Player/Stage framework. Odor plumes have been simulated using PlumeSim in Player/Stage. The effect of the number of robots on exploration in different type of environments has been analyzed and discussed. The results of real world experiments show the effect of gas cues on the behavior of robots and it shows that using the proposed algorithm, robots firstly explore the areas with higher probability of existence of odor sources. Simulation results show that having more robots is more advantageous in a complex maze than in a simple maze. Finally, there are some issues that should be discussed here. Although, most of the real world human-made structures can be modeled to the kind of environments that are tested in this paper but the question is if this approach can be easily adapted to a situation in which the robot cannot be assumed to be able to reliably perceive the feature it is traveling through. In more complex environments, as it was previously stated, the feature extraction method that is used in this study can be replaced by another methodology providing better results in the target environment. Even if the range of the sensors is limited or there is noise in sensing, the robot can perform some movements in the environment to correctly identify the environmental features. The number of defined features can also be increased in such complex environments. However, if the robots are not able to correctly identify the environmental features, the topological maps will have some degree of unreliability and map merging cannot be done based on similarity checks of this paper. In most of the human constructed facilities, the robots are able to classify the general features of the environment (maybe by using more complex sensors including 3D Laser range finders and cameras) and so this method can be applied. Regarding possible conflicts between the robots in their taskallocations, three points should be mentioned. First, the topological maps are very small data files that are transferred in a few milliseconds and there is not a big delay in the communications between the robots. Second, it must be very rare that two robots want to choose frontiers exactly at the same time because most of the times the robots are traveling without changing their frontiers. Third, even if two robots are going to choose frontiers at the same time, they might automatically choose different frontiers based on their positions and the utility/cost function. Considering these three points, the probability of two robots to choose the same frontier is very low. Even if this happens (that we have never seen in the experiments and simulations) two robots will temporarily travel to explore one frontier, however, as soon as one of them gets to a new detected feature, it will process the map to pick up a frontier and for sure this time it will not choose the same frontier since it is already taken by the other robot. The other point is that in the Algorithm 1 the robots make their decisions independently and there is no condition that may lead to a deadlock between the robots. In Algorithm 2 that is for improving the path planning of the
robots, there are priority checks between the robots. The robot that has lower priority should go back or wait for some seconds until the other robot passes. If The other robot fails at this moment, this robot will be waiting forever. This issue can be avoided by adding a timeout threshold in the Algorithm 2. Acknowledgments The authors would like to thank the anonymous reviewers for their insightful and constructive comments that helped in improving the manuscript. The authors also would like to thank João Nunes and Gonçalo Cabrita for their contributions during implementation of the method. This work was partially supported by the European project GUARDIANS contract FP6-IST-045269 as well as by the Portuguese Foundation for Science and Technology contract SFRH /BD /45740 /2008. Appendix. Supplementary data Supplementary material related to this article can be found online at doi:10.1016/j.robot.2011.07.010. References [1] A. Loutfi, S. Coradeschi, A. Lilienthal, J. Gonzalez, Gas distribution mapping of multiple odour sources using a mobile robot, Robotica 27 (02) (2008) 311–319. [2] A. Lilienthal, T. Duckett, Building gas concentration gridmaps with a mobile robot, Robotics and Autonomous Systems 48 (1) (2004) 3–16. [3] G. Ferri, E. Caselli, V. Mattoli, A. Mondini, B. Mazzolai, P. Dario, SPIRAL: a novel biologically-inspired algorithm for gas/odor source localization in an indoor environment with no strong airflow, Robotics and Autonomous Systems 57 (4) (2009) 393–402. [4] A. Hayes, A. Martinoli, R. Goodman, Distributed odor source localization, IEEE Sensors Journal 2 (3) (2002) 260–271. [5] A. Marjovi, J. Nunes, P. Sousa, R. Faria, L. Marques, An olfactory-based robot swarm navigation method, in: Proc. IEEE Int. Conf. on Robotics and Automation, Alaska, USA, 2010. [6] L. Marques, U. Nunes, A. de Almeida, Particle swarm-based olfactory guided search, Autonomous Robots 20 (3) (2006) 277–287. [7] G. Kowadlo, D. Rawlinson, R. Russell, R. Jarvis, Bi-modal search using complementary sensing (olfaction/vision) for odour source localisation, in: Proc. IEEE Int. Conf. on Robotics and Automation, Orlando, 2006. [8] L. Marques, N. Almeida, A. de Almeida, Olfactory sensory system for odourplume tracking and localization, in: IEEE Int. Conf. on Sensors, Toronto, Canada, 2003. [9] L. Marques, U. Nunes, A. Almeida, Olfaction-based mobile robot navigation, Thin Solid Films 418 (1) (2002) 51–58. [10] T. Lochmatter, E. Aydin, I. Navarro, A. Martinoli, A plume tracking algorithm based on crosswind formations, in: Proc. Int. Symp. on Distributed Autonomous Robotics Systems, Lausanne, Switzerland, 2010. [11] R. Russell, A. Bab-Hadiashar, R. Shepherd, G. Wallace, A comparison of reactive robot chemotaxis algorithms, Robotics and Autonomous Systems 45 (2) (2003) 83–97. [12] K. Krishnanand, D. Ghose, Theoretical foundations for rendezvous of glowworm-inspired agent swarms at multiple locations, Robotics and Autonomous Systems 56 (7) (2008) 549–569. [13] A. Marjovi, J. Nunes, L. Marques, A.T. de Almeida, Multi-robot exploration and fire searching, in: IEEE/RSJ Int. Conf. on Intelligent Robots and Systems, St. Louis, MO, USA, 2009. [14] W. Burgard, M. Moors, C. Stachniss, F. Schneider, Coordinated multi-robot exploration, IEEE Transactions on Robotics 21 (3) (2005) 376–386. [15] F. Tang, L. Parker, A complete methodology for generating multi-robot task solutions using ASyMTRe-D and market-based task allocation, in: Proc. IEEE Int. Conf. on Robotics and Automation, Italy, 2007. [16] K. Singh, K. Fujimura, Map making by cooperating mobile robots, in: Proc. IEEE Int. Conf. on Robotics and Automation, 1993. [17] B. Yamauchi, Frontier-based exploration using multiple robots, in: Proc. of 2nd Int. Conf. on Autonomous Agents, 1998. [18] A. Marjovi, J. Nunes, L. Marques, A. de Almeida, Multi-robot fire searching in unknown environment, in: A. Howard, K. Iagnemma, A. Kelly (Eds.), Field and Service Robotics, in: Springer Tracts in Advanced Robotics, vol. 62, 2010, pp. 341–351. [19] R. Zlot, A. Stentz, M. Bernardine Dias, S. Thayer, Multi-robot exploration controlled by a market economy, in: Proc. IEEE Int. Conf. on Robotics and Automation, Washington DC, USA, 2002. [20] W. Huang, K. Beevers, Topological map merging, The International Journal of Robotics Research 24 (8) (2005) 601. [21] C. Estrada, J. Neira, J. Tardós, Hierarchical SLAM: real-time accurate mapping of large environments, IEEE Transactions on Robotics 21 (4) (2005) 588–596.
A. Marjovi, L. Marques / Robotics and Autonomous Systems 59 (2011) 867–881 [22] H. Choset, K. Nagatani, Topological simultaneous localization and mapping (SLAM): toward exact localization without explicit localization, IEEE Transactions on Robotics and Automation 17 (2) (2001) 125–137. [23] E. Krissinel, K. Henrick, Common subgraph isomorphism detection by backtracking search, Software: Practice and Experience 34 (6) (2004) 591–607. [24] G. Dedeoglu, G. Sukhatme, Landmark-based matching algorithm for cooperative mapping by autonomous robots, in: Proc. Int. Symp. on Distributed Autonomous Robotics Systems, Knoxville, TN, 2000. [25] P. Hart, N. Nilsson, B. Raphael, A formal basis for the heuristic determination of minimum cost paths, IEEE Transactions on Systems Science and Cybernetics 4 (2) (1968) 100–107. [26] A. Romeo, L. Montano, Environment understanding: Robust feature extraction from range sensor data, in: IEEE/RSJ Int. Conf. on Intelligent Robots and Systems, 2006, pp. 3337–3343. [27] L. Shapiro, G. Stockman, Computer Vision, 2002, 69–73. [28] J. Burns, A. Hanson, E. Riseman, Extracting straight lines, IEEE Transactions on Pattern Analysis and Machine Intelligence (4) (1986) 425–455. [29] D.S. Guru, R. Dinesh, Non-parametric adaptive region of support useful for corner detection: a novel approach, Pattern Recognition 37 (1) (2004) 165–168. [30] J. Diaz, A. Stoytchev, R. Arkin, Exploring unknown structured environments, in: Int. Fairs Conf., 2001. [31] O. Khatib, Real time obstacle avoidance for manipulators and mobile robots, The International Journal of Robotics Research 5 (1) (1986) 90–99. [32] E. Fabrizi, A. Saffiotti, Augmenting topology-based maps with geometric information, Robotics and Autonomous Systems 40 (2–3) (2002) 91–97. [33] S. Bando, S. Yuta, Use of the parallel and perpendicular characteristics of building shape for indoor map making and positioning, in: IEEE/RSJ Int. Conf. on Intelligent Robots and Systems, Taiwan, 2010. [34] L. Marques, A. de Almeida, ThermalSkin: a distributed sensor for anemotaxis robot navigation, in: Proc. 5th IEEE Int. Conf. on Sensors, South Korea, 2006, pp. 1515–1518.
881
[35] B. Gerkey, R. Vaughan, A. Howard, The Player/Stage project: Tools for multirobot and distributed sensor systems, in: Proc. IEEE Int. Conf. on Advanced Robotics, Coimbra, Portugal, 2003. [36] G. Cabrita, P. Sousa, L. Marques, Player/stage simulation of olfactory experiments, in: IEEE/RSJ Int. Conf. on Intelligent Robots and Systems, Taiwan, 2010. [37] F. ANSYS, FLUENT user’s manual, Software Release 6.
Ali Marjovi received his B.Eng. degree in Computer Engineering from University of Isfahan, Iran in 2003 and his M.Sc. degree in computer-hardware engineering from Sharif University of Technology, Tehran, Iran, in 2005. He is currently a Ph.D. candidate in Institute of Systems and Robotics, University of Coimbra, Portugal. His research interests include multi-robot olfactory search and exploration, and swarm robotics olfaction.
Lino Marques has a Ph.D. degree in Electrical Engineering from the University of Coimbra, Portugal. He is currently an auxiliary professor at the Department of Electrical and Computer Engineering, University of Coimbra, and he heads the Embedded Systems Laboratory of the Institute for Systems and Robotics from that university (ISR-UC). His main research interests include embedded systems, mechatronics, robotics for risky environments, artificial olfaction systems and mobile robot olfaction.