Jul 15, 2016 - The time that B starts its task is then calculated as: (Ts. B|Ta .... of the Scipy package for Python [24]. .... using the scikit-learn module for Python.
1
Multi-robot task allocation with resource contention and uncertain timing
arXiv:1607.04358v1 [cs.MA] 15 Jul 2016
Andrew W. Palmer, Andrew J. Hill, and Steven J. Scheding
Abstract—This paper proposes an analytical framework for modelling resource contention in multi-robot systems, where the travel times and task durations are uncertain. It uses several approximation methods to quickly and accurately calculate the probability distributions describing the times that tasks start and finish. Specific contributions include a method for calculating the probability of a set of independent normally distributed random events occurring in a given order, an upper bound on that probability, and a method for calculating the most likely and n-th most likely orders of occurrence for a set of independent normally distributed random events that have equal standard deviations. The complete framework is shown to be much faster than a Monte Carlo approach for the same accuracy in two multirobot task allocation problems. This is a general framework that is agnostic to the optimisation method and objective function used, and is applicable to a wide range of robotics and nonrobotics problems. Index Terms—Multi-robot task allocation, uncertainty, resource contention
I. I NTRODUCTION OLUTIONS to the Multi-Robot Task Allocation (MRTA) problem are necessary for the efficient operation of many multi-robot systems. The MRTA problem is to take a set of robots and tasks, and optimally assign each robot to a task. Most of the work on MRTA problems makes assumptions that are not realistic for real-world problems, such as negligible interaction effects between robots, and deterministic robot dynamics. This paper relaxes these assumptions by considering uncertainty in the travel times and task durations of the robots, and modelling the effects that result from multiple robots using mutually exclusive resources. This work is motivated by multi-robot scenarios where there is a shared resource that cannot be used by all of the robots at once, such as an intersection or narrow passageway, as well as situations where the robots cannot perform their tasks in parallel and must wait for previous robots to finish before commencing their task, such as construction and maintenance tasks. The techniques developed in this paper for modelling these effects are applicable to a wide range of scenarios including machine shop scheduling [1] and processor scheduling [2], as well as other robotics problems such as multi-robot path planning [3]– [5], and planning for refuelling or recharging robots [6]–[8]. While there is literature on MRTA problems that incorporate either uncertainty [9]–[14] or resource contention [15]–[19],
S
This work was supported by the Rio Tinto Centre for Mine Automation and the Australian Centre for Field Robotics, University of Sydney, Australia. The authors are with the Australian Centre for Field Robotics, University of Sydney, Australia, e-mail addresses: {a.palmer;a.hill;s.scheding}@acfr.usyd.edu.au. Manuscript received xxx x, 201x; revised xxxx xx, 201x.
to the best of the authors’ knowledge this is the first work to combine the two. This paper develops a framework for analytically calculating the probability distributions describing the times at which the tasks are started and completed. This framework is independent of the choice of optimisation method used, facilitates the use of any objective function, and can also be used in conjunction with chance constraints. In the problems considered in this paper, the locations where the robots perform their tasks are the contended resource. Two specific problems are considered. In the first problem, the order in which the robots must perform their tasks is specified in the problem formulation. This behaviour can be found in construction and maintenance problems where specialised robots must perform their tasks first to enable other robots to execute their tasks. For example, one robot may need to remove a wheel to allow another robot to access the brakes on a vehicle. In the second problem, the order is unspecified and the robots perform their tasks in the order in which they arrive at the location. These situations can occur when there are robots or agents that are outside of the control of the system and rules are used to govern their behaviour. Examples of this include fleets of autonomous vehicles interacting with autonomous and manned vehicles at intersections through give way rules, and robots forming queues to perform tasks such as collecting and delivering packages. Beyond the development of the framework for modelling the effects of timing uncertainty and resource contention, specific contributions of this paper include: •
•
•
•
a method for calculating the probability, and an upper bound on the probability, of a set of independent normally distributed random events occurring in a given order; a method for calculating the most likely and n-th most likely orderings of independent normally distributed random events, when the standard deviations of the occurrence times for each event are equal; a normal approximation to the conditional probability distribution describing a random event given a specific order of events; and a comparison of the developed framework with deterministic and Monte Carlo approaches in two simulation examples.
The remainder of this paper is structured as follows: Section II presents an overview of related literature, Section III develops a framework for scenarios where the order in which the tasks must be performed is specified, and Section IV extends this framework to scenarios in which the order is not specified. Section V evaluates the utility of the developed framework
2
through two simulation examples, and Section VI concludes the paper with suggestions for future research. II. R ELATED LITERATURE MRTA problems have been extensively studied in the literature—a recent review of the state-of-the-art solution methods for MRTA problems is presented in [20]. The authors note that solving MRTA problems with complex constraints, including uncertainty and inter-robot effects, is still an open question. In general, much of the literature takes an idealistic view of the problem by ignoring both the uncertainty inherent in real-world scenarios and the effects of robots interacting with one another as they attempt to perform their tasks. While uncertainty has been considered by several papers, each paper has introduced and dealt with uncertainty in different ways. In [9], tasks were generated at random times and locations. Here, the authors empirically tested the effect of commitment versus coordination on the overall performance of the system, and found that the optimal strategy varies depending on the scenario. Trust was introduced in [10] as a way of modelling the uncertainty in whether an agent will succeed at a given task. The interval Hungarian algorithm was developed in [11] to deal with problems that have uncertainty in the utility estimate of a given assignment. This method relies on knowing the Probability Density Function (PDF) describing the utility. The interval Hungarian algorithm can be applied to problems with resource contention, using the framework developed in this paper to calculate the PDFs of the utility. Task allocation in teams consisting of both robots and humans was considered by [12], where humans have the option of rejecting a task assignment. They developed a replanning algorithm using a multi-agent Markov decision process that incorporated the probability that a human will reject the task. Finally, sensitivity analysis approaches were used in [13], [14] to quantify when a task assignment should be recomputed in response to changes in the environment. The effect of resource contention was not included in any of the above papers. Resource contention was considered in [15], where a team of robots operating in an office building frequently encountered areas where only one robot could operate at a time, such as doorways and cluttered corridors. The authors introduced a decentralised method that used aggression signalling to resolve interactions during task execution. A learnt model of the impact of interference between robots on the utility function was used by [16] within an auctioning algorithm. Vacancy chain scheduling was used in [17] for dealing with interaction effects in a MRTA problem with a homogeneous fleet of robots. The authors used reinforcement learning to spatially distribute the robots to avoid interference effects. The idea of spatially distributing the robots to avoid interference was also used in [18]. In each of the above works, global optimality of the solution was not considered. A method for calculating the optimal task assignment in scenarios with resource contention was developed in [19]. Interference costs were modelled using a penalisation function, and they showed that the task assignment problem is NP-hard when the penalisation function is polynomial-time computable. Their approach used Murty’s
ranking algorithm to find next best assignments when ignoring interference costs, and then evaluated these assignments with the interference costs included. The framework presented in this paper can be used to calculate the penalisation function when uncertainty is also considered. In summary, the literature on resource contention and uncertainty has thus far only considered these problems separately. The sections that follow incorporate these two aspects into a unifying framework.
III. O RDER IS SPECIFIED This section considers the problem of predicting the outcome of events that have uncertainty around their start time and duration, where the order in which the events occurs is provided. Consider a simple example of two robots, A and B, that both need to perform an action at the same location. Both the time of arrival at the location, TAa and TBa , and the duration of the action, DA and DB , are independent random variables. Only one robot can perform their action at the location at a time, so the second robot may have to wait for the first robot to complete its action before commencing its own action. If robot A must perform its action before B, then the time that robot A starts its action, TAs , is simply the time that it arrives at the location, TAa . The time that it finishes the action at, TAf , is given by: TAf = TAs + DA
(1)
Since robot B can only commence its action after A has finished, the time that robot B starts its action, TBs is given by: TBs = max(TAf , TBa )
(2)
and the time that robot B completes its action, TBf , is given by: TBf = TBs + DB
(3)
This process is easily extended to 3 or more robots. For many types of probability distributions, the above process requires numerical methods to calculate the sum and maximum of the random variables. However, if the arrival times and durations are described by independent normally distributed random variables, then analytical methods can be used. The summation of two independent normally distributed random variables is well known:
2 X ∼ N (µX , σX )
Y ∼ N (µY , σY2 ) Z =X +Y 2 Z ∼ N (µX + µY , σX + σY2 )
(4)
3
A. Maximum of random variables
0.45
An analytical approach for calculating the mean and variance of the maximum of two normally distributed random variables is given in [21]. This is summarised below for independent normally distributed random variables. 2 Consider X ∼ N (µX , σX ) and Y ∼ N (µY , σY2 ). Let:
0.40
Numerical Analytical
0.35 0.30 Probability
q 2 + σ2 α = σX Y
Probability versus Time
(5)
0.25 0.20 0.15 0.10
µX − µY β= α
0.05
(6)
0.00 24
Using the following notation: (7)
�� � � 1 x Φ(x) = φ(t)dt = 1 + erf √ 2 2 −∞
(8)
exp −τ
34
36
38
40
dτ
0.25
(9)
max(X, Y ) is approximated by a normal distribution, Z ∼ 2 ), where: N (µZ , σZ
(11)
For more than two random variables, the author suggests iteratively applying the above approximation. For three random variables, X, Y , and Z, the maximum is approximated as: max(X, Y, Z) ≈ max (max (X, Y ) , Z)
0.15
0.05 0.00 26
(10)
2 2 σZ = (µ2X + σX )Φ(β) + (µ2Y + σY2 )Φ(−β)
+ (µX + µY )αφ(β) − µ2Z
0.20
0.10
0
µZ = µX Φ(β) + µY Φ(−β) + αφ(β)
Numerical Analytical
0.30 Probability
2 erf(t) = √ π
32 Time
0.35
where erf(.) is the error function, defined as: � 2
30
Probability versus Time
0.40
x
Zt
28
(a) 10 random variables
exp(−x2 /2) p φ(x) = (2π) Z
26
(12)
Figure 1 presents examples of the approximation applied to 10 and 100 random variables. As would be expected, this approximation degrades as the number of random variables is increased. However, it is still a reasonably good approximation of the numerical result. For 10 random variables, the Kullback-Liebler divergence between the numerical and analytical distributions was approximately 1e−3 , while for 100 random variables it was approximately 3e−2 . The equations above have been simplified from the full method presented in [21]. Where the above equations are only valid for independent random variables, the full approach is valid for correlated random variables. While situations where the random variables are correlated are not considered in this paper, correlation may need to be accounted for in MRTA scenarios where the planner generates a sequence of tasks for each robot rather than just a single task.
28
30
32
34 Time
36
38
40
42
(b) 100 random variables
Fig. 1: These figures show two examples of the normal approximation of the maximum of (a) 10 random variables and (b) 100 random variables. The histogram is the result of a Monte Carlo simulation, the numerical distribution is a normal approximation of the histogram, and the analytical distribution is calculated using the method from [21]. B. Example Figure 2 shows the completion times of the actions of each robot in a three robot scenario. The parameters for each robot are detailed in the caption. In this case, the robots A, B, and C are to perform their tasks in the order ABC. As can be seen, the analytical approach presented in this section produces almost identical results to a numerical approach, even for Robot C in Fig. 2c where the histogram is clearly skewed. IV. O RDER IS UNSPECIFIED This section investigates the problem of predicting the outcome of uncertain events when their order of execution is not specified. This problem commonly occurs in situations that have a First-In First-Out (FIFO) property, such as queues and some intersections. Consider a similar multi-robot scenario to the previous section where two robots, A and B, travel to a location and perform a task. In contrast to the previous section, the first robot to arrive at the location is the first to perform its task. Clearly, there are two possible orders in which the
4
robots can arrive at the location—either A can arrive first, or B can arrive first. Consider the case where A arrives before B. The time that A starts its task is first conditioned on the order in which the robots arrive:
Probability versus Time
0.30
Numerical Analytical
0.25
Probability
0.20
(TAs |TAa < TBa ) = (TAa |TAa < TBa )
0.15
(13)
The time that A completes its task is given by:
0.10
(TAf |TAa < TBa ) = (TAs |TAa < TBa ) + DA
0.05
(14)
The time that B starts its task is then calculated as: 0.00 10
15
20
Time
25
30
35
� � (TBs |TAa < TBa ) = max (TAf |TAa < TBa ), (TBa |TAa < TBa ) (15) and the time that B completes its task is given by:
(a) Completion time of Robot A
Probability versus Time
0.30
Numerical Analytical
0.25
(TBf |TAa < TBa ) = (TBs |TAa < TBa ) + DB
The completion time for each robot, considering all orders of arrival, is calculated by summing the probability weighted completion times for each order of arrival. For robot A, this gives:
0.20 Probability
(16)
0.15 0.10
TAf = P (TAa < TBa )(TAf |TAa < TBa )
0.05 0.00 10
15
20
Time
25
30
a < TYa ) is the probability that X arrives before where P (TX Y . This process extends to n robots, with the downside that there are n! orders of arrival that have to be considered. The following sections present methods for calculating the probability of an order of arrival (Section IV-A), and for conditioning the arrival times on the order of arrival (Section IV-B), under the assumption of normally distributed arrival times. Section IV-C presents a short example, and Section IV-D discusses some possible approaches for reducing the computational requirements of the above method.
(b) Completion time of Robot B
Probability versus Time
0.30
Numerical Analytical
0.25 0.20 Probability
+ P (TBa < TAa )(TAf |TBa < TAa ) (17)
35
0.15 0.10
A. Calculating the probability of an order of arrival 0.05 0.00 10
15
20
Time
25
30
35
First, consider two robots with arrival times TA and TB . The probability that A arrives before B is given by:
(c) Completion time of Robot C
Fig. 2: Example for three robots, A, B, and C. The order in which they complete their actions is ABC. The arrival times and durations are TAa ∼ N (10, 1), DA ∼ N (5, 1), TBa ∼ N (15, 4), DB ∼ N (7, 1), TCa ∼ N (23, 16), DC ∼ N (2, 0.25). The histogram shows numerical results for the completion time of each robot, while the lines show the numerical and analytical normal approximations of the completion time. In each case, the analytical approximation is almost identical to the numerical approximation. Numerical results were generated using 1,000,000 samples.
P (TAa
𝜎𝐸 or δ < 0.316
𝜇𝐷 > −𝜇𝐸
𝜎𝐸 > 𝜎𝐷 or δ < 0.316
0.6 0.4 0.2 0.0 0.0
Method 2
Method 3
Method 3
Selected Optimal
0.8
Probability
Method 1
Probability versus Time
1.0
𝛾 > 1.3
0.5
Method 2
1.0
1.5
2.0
Time
2.5
3.0
3.5
4.5
(a) KL divergence = 1e−2
Fig. 3: Decision tree for determining the order in which to apply the conditions.
Probability versus Time
1.4
Selected Optimal
1.2
(35)
In this way, any number of robots can be considered. For
1.0 Probability
represented by a standard normal distribution. Values for µA and µC ranged between -3 and 3 in 0.2 step increments, and values for σA and σC ranged between 0.2 and 3 in 0.2 step increments. A separate set of 10,000 combinations of randomly sampled values was used to evaluate the decision tree. KL divergence was used as a measure of error between the method selected by the decision tree and the optimal method. The optimal method was selected by the decision tree in 84.8% of cases. For all cases, the average and Root Mean Squared (RMS) KL divergences were 3.1e−3 and 9.4e−2 respectively, and for cases where the incorrect decision was made they were 2.0e−2 and 2.4e−1 respectively. In 93.0% of the cases where the incorrect decision was made, the KL divergence was below 1e−2 . The majority of the error was accrued in a few cases where the distributions TAa and TCa have a very low probability of satisfying TAa < TCa , resulting in a very high KL divergence (> 1). Thus, even though this is a poor approximation in some of these cases, it will have a negligible impact on the result when it is multiplied by the probability of that order of arrival occurring. Figure 4 shows two examples where the decision tree gave an incorrect result to provide a sense of scale for the KL divergences. In Figure 4a, the KL divergence is 1e−2 and there is very little difference between the distributions. Approximately 99% of the test cases resulted in a KL divergence lower than this. The KL divergence in Figure 4b is 2e−1 . While there is a substantial difference between the distributions in this case, less than 0.4% of cases had a KL divergence this high. 2) Iteratively applying conditions: So far, only the second robot to arrive in a group of three robots has been considered. Analytically calculating the mean and variance for the conditional arrival time of the other robots is a challenging problem. Instead, it is proposed that the conditions be applied iteratively. The conditional arrival time of the first robot, (TAa |TAa < TBa < TCa ), is calculated as: (TAa |TAa < TBa < TCa ) = (TAa |TAa < (TBa |TBa < TCa ))
4.0
0.8 0.6 0.4 0.2 0.0 1.0
1.5
2.0
2.5
Time
3.0
3.5
4.0
4.5
(b) KL divergence = 2e−1
Fig. 4: Two examples where the method selected by the decision tree was not the optimal method. example, for four robots, A, B, C, and D, the conditional arrival time of each robot would be calculated as: a (TAa |TAa < TBa < TCa < TD ) a = (TAa |TAa < (TBa |TBa < (TCa |TCa < TD )))
(36)
a (TBa |TAa < TBa < TCa < TD ) a = (TBa |TAa < TBa < (TCa |TCa < TD )) (37) a (TCa |TAa < TBa < TCa < TD ) a = (TCa |(TBa |TAa < TBa ) < TCa < TD ) (38) a a (TD |TAa < TBa < TCa < TD ) a a = (TD |(TCa |(TBa |TAa < TBa ) < TCa ) < TD ) (39)
Figure 5 shows an example of the conditional arrival times for three robots, A, B, and C, if the order of arrival is ABC. As can be seen, the analytical approximation of the conditional distribution is a good match to the numerical approximation, even in the cases where the analytical approach was applied iteratively.
8
C. Example
Probability versus Time
0.45
Figure 6 shows an example of the probability distribution of the completion time for each robot in a three robot scenario when every arrival order is considered. The analytical result is composed of the probability weighted sum of the completion times for each order of arrival. The analytical method produces a good approximation to the numerical results in this case. Using the pairwise probability estimate proposed in Section IV-A1 also gives reasonably good results in this case. However, as it ignores the effects of the conditional probabilities, its performance degrades as the number of robots is increased, as shown in the example in Figure 7.
Numerical Analytical
0.40 0.35
Probability
0.30 0.25 0.20 0.15 0.10 0.05 0.00
6
8
10
12
Time
14
16
18
20
D. Computational complexity
a |T a < T a < T a ) (a) (TA A B C
Probability versus Time
0.45
Numerical Analytical
0.40 0.35
Probability
0.30 0.25 0.20 0.15 0.10 0.05 0.00
6
8
10
12
Time
14
16
18
20
a |T a < T a < T a ) (b) (TB A B C
Probability versus Time
0.45
Numerical Analytical
0.40 0.35
Probability
0.30 0.25 0.20 0.15
V. R ESULTS
0.10 0.05 0.00
As mentioned previously, there are n! possible orders that n robots can arrive in. This means that, as the number of robots is increased, the analytical approach presented above can quickly become computationally more expensive than numerical methods. The method of estimating the probability presented in Section IV-A1 can help to reduce the computational cost of each order considered. However, n! orders are still considered. In situations where there are only a few likely orders, the threshold method developed in Section IV-A2 can drastically cut down on the number of orders considered. However, in the worst case where the mean arrival time of each robot is equal, this approach may not result in much of a reduction in the number of orders examined. Another simple method of reducing the computational complexity is to examine pairs of robots and disregard a certain arrival order for that pair of robots if the probability is low enough. Consider the robots A, B, and C. If the probability that B arrives before A, evaluated using Eq. (19), is lower than a user specified threshold, then, of the six possible orders that the robots can arrive in, only ABC, ACB, and CAB would be evaluated. A discussion of other methods, including using the probability of partial orders of arrival to determine whether the full order of arrival should be considered, is presented in Section 5.3 of [27].
6
8
10
12
Time
14
16
18
20
a |T a < T a < T a ) (c) (TC A B C
Fig. 5: Example of the conditional arrival times for three robots, A, B, and C. The order in which they arrive is ABC. The unconditional arrival times are TAa ∼ N (10, 1), TBa ∼ N (12, 4), TCa ∼ N (11, 9). The histogram shows numerical results for the conditional arrival time of each robot, while the lines show the numerical and analytical normal approximations of the conditional arrival time. In each case, the analytical approximation is almost identical to the numerical approximation. Numerical results were generated using 1,000,000 samples.
This section presents results for two MRTA scenarios. In the first scenario, the order in which the robots must perform their tasks was specified and the analytical method presented in Section III was used to evaluate the task allocations. In the second scenario, the order that the tasks were performed in was determined by the order in which the robots arrive at the task, and the analytical method developed in Section IV was used to evaluate the task allocations. All methods were tested on a laptop with a 2.8GHz Intel i7-4810MQ and were programmed in Python 3 by the author. A. Scenario 1: Task order is specified The first scenario considered consisted of a heterogeneous fleet of four types of robots performing assembly tasks at four locations. These tasks must be executed in a specific order, so some robots may have to wait for other robots to complete
9
Probability versus Time Analytical Analytical with Probability Estimate
0.25
Probability versus Time Analytical Analytical with Probability Estimate
0.12 0.10
0.20
Probability
Probability
0.08 0.15 0.10
0.04
0.05 0.00
0.02
5
10
15
20 Time
25
30
35
Probability versus Time Analytical Analytical with Probability Estimate
0.25
Probability
0.20 0.15 0.10 0.05
5
10
15
20 Time
25
30
35
(b) Completion time of Robot B
Probability versus Time Analytical Analytical with Probability Estimate
0.25
0.00
5
10
15
20
Time
25
30
35
40
Fig. 7: Example of the completion time of a robot when there are 5 robots and the task order is unspecified.
(a) Completion time of Robot A
0.00
0.06
their task before commencing its own task. There are 16 robots in total—four of each type. The problem is to allocate one of each type of robot to each location. 100 random instances were considered. In each instance, the means and standard deviations of the distributions describing the uncertain travel times and uncertain task durations of each robot were randomly selected. The optimisation objective was to minimise the expected cost of the construction, where cost is incurred if the construction takes longer than a specified deadline, κ. The deadline used for each scenario was the minimum time to complete the construction if the robots had no uncertainty, as calculated using a deterministic approach. The analytical method (A) presented in Section III enables the calculation of the random variable describing the time at which the construction is completed, T . From this, the expected tardiness, π, is calculated as:
Probability
0.20 0.15 0.10 0.05 0.00
5
10
15
20 Time
25
30
35
(c) Completion time of Robot C
Fig. 6: Example of the completion times for three robots, A, B, and C, where the task order is unspecified. The arrival times and durations are TAa ∼ N (10, 4), DA ∼ N (3, 0.25), TBa ∼ N (12, 1), DB ∼ N (6, 1), TCa ∼ N (14, 9), DC ∼ N (5, 1). The histogram shows numerical results for the conditional arrival time of each robot, the dotted line shows the proposed analytical approach, and the solid line shows the proposed analytical approach using an estimate of the probability. In each case, the analytical approach is a good approximation to the numerical results. Numerical results were generated using 1,000,000 samples.
π = E(max(0, T − κ)) Z ∞ = tp(T − κ)dt � � Z0 ∞ t (t − (µT − κ))2 √ exp − dt = 2σ 2 σT 2π 0 ��T � � µT − κ µT − κ √ = 1 + erf 2 σT 2 � � σT (µT − κ)2 + √ exp − 2σT2 2π
(40)
where E(X) is the expected value of the random variable X. Both a deterministic (D) and a Monte Carlo (M) approach were used as benchmarks for the analytical method, with the number of samples used in the Monte Carlo method varied between 5 and 80. An exhaustive search over all possible allocations was used for testing each method, and ground truth costs were evaluated using a Monte Carlo method with 100,000 samples. Figure 8 shows the performance of each method versus its calculation time. For each random instance, the cost of the lowest cost assignment found by any method was subtracted from the cost for each method and then averaged across all instances. It was necessary to use this
10
Cost above best known solution
Cost above best known solution versus calculation time
Package 1 collection location
Package 1 delivery location
10 0 10 -1
Controlled robot B
Package 2 delivery location
Package 2 collection location
10 -2
10 -4 0 10
Controlled robot
A D M
10 -3 10 1 10 2 Calculation time (s)
Uncontrolled robot
10 3
Fig. 8: Results for Scenario 1 showing the average of the cost minus the best known cost for each scenario versus the calculation time to find the optimal allocation for each method. The error bars show a 95% confidence interval. The Monte Carlo method used 5, 10, 20, 40, and 80 samples.
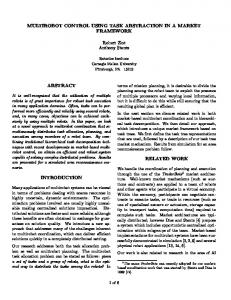
relative cost to enable comparison across scenarios. It was also infeasible to calculate the optimal allocation as this would have required using either the Monte Carlo approach with infinite samples, or an analytical approach that does not use approximations. As can be seen, the analytical approach presented in this paper consistently resulted in the lowest cost allocations. An unpaired-sample t-test was performed to test the statistical significance of the results, and the analytical method was found to produce better results than each of the other methods with a significance level of less than 0.01 in each case. B. Scenario 2: Task order is unspecified The second scenario consisted of multiple robots, with the caveat that some of the robots were controlled by other entities and their actions were not coordinated. Such situations may become common in the future where robots from multiple vendors coexist in uncontrolled environments without a centralised controller. In this scenario, 30 robots starting at random locations each collect a package from one of 30 locations and then deliver the package to its destination. The robots will encounter other robots collecting packages at the collection locations and may be required to queue before collecting the package. Thus, the resources under contention are the package collection locations. An example scenario with only 2 controlled robots is shown in Figure 9. It was assumed that the actions of the uncontrolled robots are known to the optimiser. The optimisation aim was to generate an optimal allocation of robots to packages that minimised the tardiness cost incurred for delivering packages after their deadline. In contrast to the previous scenario, individual deadlines were considered for each package. At each package collection location, n robots controlled by other entities were also collecting packages, where n was varied from 1 to 6. 100 random scenarios were tested for each value of n, each with random arrival time distributions and task durations for each robot and random deadlines for
Controlled robot A
Fig. 9: Example of the initial set-up for a simplified version of Scenario 2 with 2 controlled robots and 6 uncontrolled robots. Solid circles represent the controlled robots, while empty circles represent robots that are not controlled. The squares are locations where a package must be collected, and the crosses are the associated package delivery locations. Robots collecting a package from a collection location may have to wait for other robots collecting packages.
each package. The standard deviations of the arrival time distributions for each robot were set to be equal to one another to demonstrate the utility of the method presented in Section IV-A2 for calculating the set of most likely orders of arrival. Note that the results presented here are valid for cases where the standard deviations are not equal, with the exception of the methods using Algorithm 1 with a threshold less than 100%. The analytical method was tested using both the full method for calculating the probability of an order of arrival (A), and the method for estimating this probability (AEst). Only the A method used Algorithm 1 to limit the number of orders considered, and values of 80%, 90%, 95%, 99% and 100% were used for the probability threshold. These approaches were benchmarked against a deterministic approach (D), and a Monte Carlo approach (M). The number of samples used in the Monte Carlo approach was varied between 10 and 10,000 for the cases where n ≤ 5, and between 10 and 100,000 for the case where n = 6. As the controlled robots do not interact with each other, the cost associated with an individual robot being assigned to a specific task can be calculated prior to the optimisation and the Hungarian algorithm [28] can then be used to calculate the optimal allocation. Ground truth costs were evaluated using a Monte Carlo method with 100,000 samples where n ≤ 5, and 1,000,000 samples where n = 6. Figure 10 shows the results for each method versus the calculation time. As can be seen, the analytical method consistently achieved the lowest cost solutions when using a probability threshold of 100%. This came at the expense of calculation time as the number of external robots was increased. Lowering the probability threshold resulted in lower calculation times at the expense of solution cost. The other approach for reducing calculation time was using the probability estimate. This gave a reduction in calculation time of a factor of approximately 5 over the analytical approach with a probability threshold of 100%, but also suffered from increased solution cost. For the case where there is only 1 external robot per location, the probability estimate is equal to the actual probability.
11
TABLE I: Statistical significance levels of the analytical approach (A) outperforming the other approaches, calculated using an unpaired-sample t-test Robots
1
2
3
4
5
6
AEst D M10 M100 M1,000 M10,000 M100,000
0.5 < 0.01 < 0.01 < 0.01 < 0.01 < 0.01 –
0.10 < 0.01 < 0.01 < 0.01 < 0.01 0.02 –
0.02 < 0.01 < 0.01 < 0.01 < 0.01 < 0.01 –
0.02 < 0.01 < 0.01 < 0.01 < 0.01 < 0.01 –
< 0.01 < 0.01 < 0.01 < 0.01 < 0.01 < 0.01 –
< 0.01 < 0.01 < 0.01 < 0.01 < 0.01 < 0.01 0.47
TABLE II: Statistical significance levels of the analytical approach using the probability estimate (AEst) outperforming the other approaches, calculated using an unpaired-sample ttest Robots
1
2
3
4
5
6
A D M10 M100 M1,000 M10,000 M100,000
0.5 < 0.01 < 0.01 < 0.01 < 0.01 < 0.01 –
0.90 < 0.01 < 0.01 < 0.01 0.40 0.87 –
0.98 < 0.01 < 0.01 < 0.01 < 0.01 0.91 –
0.98 < 0.01 < 0.01 < 0.01 0.70 0.97 –
1.00 < 0.01 < 0.01 < 0.01 0.30 1.00 –
1.00 < 0.01 < 0.01 < 0.01 0.60 1.00 1.00
The analytical method with the probability threshold of 100% produced better results for the same calculation time in all bar one of the examined cases. In the case where n = 6, the proposed approach produced similar results to the Monte Carlo approach using 100,000 samples, both in terms of cost and calculation time. However, the proposed approach had the benefit of higher consistency in the results, as evidenced by the smaller confidence interval on the data point compared to the Monte Carlo method. The number of orders of arrival considered by the analytical method suffers from factorial growth as the number of external robots is increased. These results suggest that, for cases where there are 8 or more robots arriving at similar times, Monte Carlo approaches will outperform the analytical approach. However, if it is possible to separate the robots into multiple groups where the probability that any of the robots in an earlier group will arrive after any of the robots in a later group is negligible, then the analytical approach is potentially more suitable. The computationally expensive parts of the approach were calculating the probability of an order of arrival (81% of calculation time) and conditioning the arrival times on the order of arrival (14% of calculation time). Tables I and II show the statistical significance of the results for the analytical approach using a probability threshold of 100% and the analytical approach using the probability estimate respectively. The analytical method was statistically better than the deterministic and Monte Carlo methods with a significance of less than 0.01 in all bar 1 case, in which case it was statistically better with a significance of 0.02. The analytical method using the probability estimate was statistically better than the deterministic and Monte Carlo methods for small numbers of robots and samples.
VI. C ONCLUSION This paper presented an analytical framework for modelling timing uncertainty and resource contention in multirobot scenarios. Two specific problems were considered—in the first problem the order in which the resource was used was specified, and in the second the order was unspecified. The framework was shown to produce more accurate results than Monte Carlo methods with similar run-times. The main advantage of this approach over numerical methods is that it produces an accurate probability distribution of the result that can then be exploited in more complex optimisation methods such as chance constrained programming. In the second problem, the framework suffered from factorial growth in the number of robots using each specific resource. Thus, it is suitable only for small numbers of robots. Suggestions for future work are focussed on reducing the computational burden associated with the framework. Potential avenues include developing faster methods of calculating the probability of an order of arrival that trade off accuracy for speed, better estimates of the probability, and methods of grouping robots into distinct arrival groups such that the probabilities in each group can be calculated separately. A PPENDIX A P ROOF OF T HEOREM 1 This section proves the claim of Theorem 1 that the most likely order of arrival in the case where the variances of the arrival times are equal is the order in which the mean arrival times are ascending. This can be restated as, for any number of independent normally distributed random variables with equal variances, the most likely sequence of the random variables resulting from sorting using their actual values is the sequence in which the random variables are sorted by their mean values. Consider two neighbouring random variables, X and Y , in a sequence of random variables, where X and Y are independent and normally distributed, X ∼ N (µX , σ 2 ) and Y ∼ N (µY , σ 2 ), with µX < µY and equal variances. This section will show that, regardless of the random variables before and after X and Y , the probability that X occurs before Y is higher than the probability that Y occurs before X. Let a and b be constants representing the values taken by the random variables immediately before and after X and Y . Then this can be stated mathematically as:
P (X < Y |a < X < b, a < Y < b) > P (Y < X|a < X < b, a < Y < b) (41) Lemma 1. pX|a