Strouhal number - a dimensionless number describing oscillating unsteady flow ..... weight as one walks, and its fluid-like behaviour, from the handful of sand running ...... As a simple model, consider the contact as a linear spring with damping. The ...... 100. Multi-scale modelling of dry granular flows applications of FEM, this ...
Multi-scale multiphase modelling of granular flows
Krishna Kumar Soundararajan Department of Engineering University of Cambridge
This dissertation is submitted for the degree of Doctor of Philosophy
King’s College
August 2015
I would like to dedicate this thesis to my loving parents
Declaration I hereby declare that except where specific reference is made to the work of others, the contents of this dissertation are original and have not been submitted in whole or in part for consideration for any other degree or qualification in this, or any other university. This dissertation is the result of my own work and includes nothing which is the outcome of work done in collaboration, except where specifically indicated in the text. This dissertation contains fewer than 65,000 words including appendices, bibliography, footnotes, tables and equations and has fewer than 150 figures. Krishna Kumar Soundararajan August 2015
Acknowledgements My deepest gratitude goes to my supervisor, Prof. Kenichi Soga, for his generous help, support, guidance and encouragement throughout my PhD research. I feel privileged to have worked with him; thank you so much for a very inspiring and an interesting four years of research. I would like to express my sincere thanks to my advisor Prof. Malcolm Bolton, for his valuable advice and comments following my first year report. I am extremely grateful to Prof. Jean-Yves Delenne, Université Montpellier 2, France for his support and guidance in developing coupled Lattice Boltzmann - Discrete Element Model. I owe a debt of gratitude to Prof. Farhang Radjai, Université Montpellier 2, France for stimulating discussions and guidance for this work. I would like to thank Patrick Mutabaruka, Université Montpellier 2, France for the collaborative research work and for his support during my stay in Montpellier. I owe a debt of gratitude to Samila Bandara, EPFL for her continuous support, both as a friend and as a work colleague, for her assistance in bringing me up to speed with Material Point Method and for her continuous support and discussions. I would like to express my sincere gratitude to Prof Boominathan, Indian Institute of Technology, Madras for his continuous support throughout my research career. I sincerely thank my professors at Indian Institute of Technology Madras and at Thiagarajar College of Engineering for their support, encouragement and for their prior teaching. I would like to thank Dr Vidya Bhushan Maji for all his support and for his constant encouragement to pursue my PhD at the University of Cambridge, during my research at IITM. A very special thanks to Dr. Nagan, Dr. Sivagurunathan, and Dr. Sugunaseelan for their constant support and motivation throughout my engineering career. I’m greatly indebted to them for my research life. I owe a very special thanks to my aunt Chitra for all her support, care and affection she has showered on me and for always being there for me. I can never forget these four years in my life, thank you for making it so special and wonderful. Also an extra special thanks to her for getting me started on my computing journey. A special thanks to my uncle Sankar and my cousin Karthik for their encouragement and making these four years a very memorable experience.
viii Coming from India, particularly as this was my first time outside the country, my friends have always been around to make these four years a wonderful experience and making my stay at Cambridge feel like home. A very special thanks to Alex Ridge for being such a great friend and for being there for me pretty much every single day in the four years of my PhD. I would like to thank Adam Reid for all his support in easing me in to this new country and introducing me to table football. A special thanks to Adam for staying with me and supporting me even beyond the visiting hours of the hospital after my surgery. A sincere thanks to my extra special friend Nicole Grunstra for all our wonderful time together. Extra special thanks to Steven Kaneti, who has always been there for me and for all the interesting discussions about computing. A special thanks to my friend Charlotte Houldcroft for being such a great friend, and for proof-reading the chapters of my thesis. My sincere thanks to my friend Katie Fitzpatrick for proof reading the chapters of my thesis. I owe an extra special thanks to my friends Renate Fellinger, Wis Wang-Koh, Anne Musset, James Taylor, Max Hewkin-Smith, Marilena Frisone, Auerélie Petiot, Isabell Frank, Sarah Williams, Anna Bachmann, Stewart Forshaw and all the others, for making my time so far at Cambridge such an enjoyable one! A special thanks again to Alex Ridge, Nicole Grunstra and Steven Kaneti for spending sleepless nights to help me format the proceedings of the International Symposium on Geomechanics from Micro to Macro. I would like to extend my sincere thanks to my friends Karthik, Sundaralingam, SME Karthik, Meenakshi Sundaram, Sonu Thomas, Selvaganesh, Varun Thangamani, Anjana Bhashi and Aruna Prasath who have always been there for me and for their continuous support and encouragement. My time at the geotechnical research group would not have been so enjoyable without my friends and colleagues. Thank you Tina Schwamb, Denis Garber, Francesca Burali, Samila Bandara, Ouge Wang, Kirk Ellison, Paul Shepley, and Ermao Xu. I am very grateful for the memorable time, for the support and encouragement from all of you. A special thanks to the Div-D computer officer, Tim Ablett for all his support. Words cannot express the inspiration, understanding, patience and moral support of my parents Soundararajan and Meenakshi, my sister Shenbagam and my grandparents, not only in completing my PhD research work but also in all aspects of my life. Above all I thank the Gods for their abundant blessings showered upon me throughout my life. Furthermore, I would like to sincerely acknowledge the support of Cambridge Commonwealth, European and International Trust for my personal funding during this PhD, without which this research would not have been possible. I would like to acknowledge the Lundgren Research Award for their financial support during the final year of my PhD.
Abstract Geophysical hazards usually involve multiphase flow of dense granular solids and water. Understanding the mechanics of granular flow is of particular importance in predicting the run-out behaviour of debris flows. The dynamics of a homogeneous granular flow involve three distinct scales: the microscopic scale, the meso-scale, and the macroscopic scale. Conventionally, granular flows are modelled as a continuum because they exhibit many collective phenomena. Recent studies, however, suggest that a continuum law may be unable to capture the effect of inhomogeneities at the grain scale level, such as orientation of force chains, which are micro-structural effects. Discrete element methods (DEM) are capable of simulating these micro-structural effects, however they are computationally expensive. In the present study, a multi-scale approach is adopted, using both DEM and continuum techniques, to better understand the rheology of granular flows and the limitations of continuum models. The collapse of a granular column on a horizontal surface is a simple case of granular flow; however, a proper model that describes the flow dynamics is still lacking. In the present study, the generalised interpolation material point method (GIMPM), a hybrid Eulerian – Lagrangian approach, is implemented with the Mohr-Coloumb failure criterion to describe the continuum behaviour of granular flows. The granular column collapse is also simulated using DEM to understand the micro-mechanics of the flow. The limitations of MPM in modelling the flow dynamics are studied by inspecting the energy dissipation mechanisms. The lack of collisional dissipation in the Mohr-Coloumb model results in longer run-out distances for granular flows in dilute regimes (where the mean pressure is low). However, the model is able to capture the rheology of dense granular flows, such as the run-out evolution of slopes subjected to lateral excitation, where the inertial number I < 0.1. The initiation and propagation of submarine flows depend mainly on the slope, density, and quantity of the material destabilised. Certain macroscopic models are able to capture simple mechanical behaviours, however the complex physical mechanisms that occur at the grain scale, such as hydrodynamic instabilities and formation of clusters, have largely been ignored. In order to describe the mechanism of submarine granular flows, it is important to consider both the dynamics of the solid phase and the role of the ambient fluid. In the present study, a two-dimensional coupled Lattice Boltzmann LBM – DEM technique is developed
x to understand the micro-scale rheology of granular flows in fluid. Parametric analyses are performed to assess the influence of initial configuration, permeability, and slope of the inclined plane on the flow. The effect of hydrodynamic forces on the run-out evolution is analysed by comparing the energy dissipation and flow evolution between dry and immersed conditions.
Table of contents List of figures
xv
List of tables
xxiii
Nomenclature
xxv
1
Introduction 1.1 Modelling granular flow . . . . . . . . . . . . . . . . . . . . . . . . . . . 1.2 Objectives . . . . . . . . . . . . . . . . . . . . . . . . . . . . . . . . . . . 1.3 Overview of this work . . . . . . . . . . . . . . . . . . . . . . . . . . . .
2
Granular flows 2.1 Introduction . . . . . . . . . . . . . . . . . . . 2.2 Modelling granular flow . . . . . . . . . . . . 2.2.1 Continuum models . . . . . . . . . . . 2.2.2 Kinetic theory . . . . . . . . . . . . . . 2.2.3 Rheology . . . . . . . . . . . . . . . . 2.2.4 Shallow-water approximation . . . . . 2.3 Studies on granular flows . . . . . . . . . . . . 2.3.1 Granular column collapse . . . . . . . 2.3.2 Flow down an inclined plane . . . . . . 2.3.3 Saturated and submerged granular flows 2.4 Summary . . . . . . . . . . . . . . . . . . . .
3
Numerical modelling of granular flow 3.1 Introduction . . . . . . . . . . . . . . . . . . 3.2 Continuum modelling of granular flow . . . . 3.2.1 Mesh-based and mesh-free techniques 3.3 Material Point Method (MPM) . . . . . . . .
. . . .
. . . . . . . . . . .
. . . .
. . . . . . . . . . .
. . . .
. . . . . . . . . . .
. . . .
. . . . . . . . . . .
. . . .
. . . . . . . . . . .
. . . .
. . . . . . . . . . .
. . . .
. . . . . . . . . . .
. . . .
. . . . . . . . . . .
. . . .
. . . . . . . . . . .
. . . .
. . . . . . . . . . .
. . . .
. . . . . . . . . . .
. . . .
. . . . . . . . . . .
. . . .
. . . . . . . . . . .
. . . .
. . . . . . . . . . .
. . . .
1 4 6 7
. . . . . . . . . . .
9 9 11 13 14 15 22 24 24 35 38 45
. . . .
47 47 47 51 53
Table of contents
xii
3.4 3.5
3.6 4
5
3.3.1 Discrete formulation of the governing equations . 3.3.2 Boundary conditions . . . . . . . . . . . . . . . 3.3.3 Integration scheme . . . . . . . . . . . . . . . . 3.3.4 Solution scheme . . . . . . . . . . . . . . . . . 3.3.5 GIMP method . . . . . . . . . . . . . . . . . . 3.3.6 Application of MPM in geomechanics . . . . . . Particulate modelling of granular flows . . . . . . . . . . Discrete Element Method . . . . . . . . . . . . . . . . . 3.5.1 The Forces . . . . . . . . . . . . . . . . . . . . 3.5.2 Numerical algorithm and integration scheme . . 3.5.3 Boundary conditions . . . . . . . . . . . . . . . 3.5.4 Validation of DEM . . . . . . . . . . . . . . . . 3.5.5 Cumulative beta distribution . . . . . . . . . . . 3.5.6 Particle assembling methods . . . . . . . . . . . 3.5.7 Voronoi tessellation . . . . . . . . . . . . . . . . Summary . . . . . . . . . . . . . . . . . . . . . . . . .
. . . . . . . . . . . . . . . .
. . . . . . . . . . . . . . . .
. . . . . . . . . . . . . . . .
. . . . . . . . . . . . . . . .
. . . . . . . . . . . . . . . .
Multi-scale modelling of dry granular flows 4.1 Introduction . . . . . . . . . . . . . . . . . . . . . . . . . . . . . 4.2 Granular column collapse . . . . . . . . . . . . . . . . . . . . . . 4.2.1 Numerical set-up . . . . . . . . . . . . . . . . . . . . . . 4.2.2 Deposit morphology . . . . . . . . . . . . . . . . . . . . 4.2.3 Flow evolution and internal flow structure . . . . . . . . . 4.2.4 Energy dissipation mechanism . . . . . . . . . . . . . . . 4.3 Role of initial grain properties on the collapse of granular columns 4.4 Slopes subjected to horizontal excitation . . . . . . . . . . . . . . 4.4.1 Numerical set-up . . . . . . . . . . . . . . . . . . . . . . 4.4.2 Effect of mesh size and number of material points per cell 4.4.3 Evolution of pile geometry and run-out . . . . . . . . . . 4.4.4 Decay of kinetic energy . . . . . . . . . . . . . . . . . . 4.4.5 Effect of friction . . . . . . . . . . . . . . . . . . . . . . 4.4.6 Comparison with granular column collapse . . . . . . . . 4.5 Summary . . . . . . . . . . . . . . . . . . . . . . . . . . . . . .
. . . . . . . . . . . . . . . .
. . . . . . . . . . . . . . .
. . . . . . . . . . . . . . . .
. . . . . . . . . . . . . . .
. . . . . . . . . . . . . . . .
. . . . . . . . . . . . . . .
. . . . . . . . . . . . . . . .
. . . . . . . . . . . . . . .
. . . . . . . . . . . . . . . .
54 57 57 59 63 68 72 74 75 80 86 88 89 91 94 97
. . . . . . . . . . . . . . .
99 99 100 101 108 112 119 125 134 134 137 144 148 156 159 163
Numerical modelling of fluid–grain interactions 167 5.1 Fluid simulation using the lattice Boltzmann method . . . . . . . . . . . . 167 5.1.1 Formulation . . . . . . . . . . . . . . . . . . . . . . . . . . . . . . 169
Table of contents
5.2 5.3 5.4 5.5 6
7
xiii
5.1.2 Lattice Boltzmann - Multi-Relaxation Time (LBM-MRT) . 5.1.3 Boundary conditions . . . . . . . . . . . . . . . . . . . . Validation of the lattice Boltzmann method . . . . . . . . . . . . Turbulence in lattice Boltzmann method . . . . . . . . . . . . . . Coupled LBM and DEM for fluid-grain interactions . . . . . . . . 5.4.1 Draft, kiss and tumbling: Sedimentation of two grains . . GP-GPU Implementation . . . . . . . . . . . . . . . . . . . . . .
Underwater granular flows 6.1 Introduction . . . . . . . . . . . . . . . . . . . 6.2 LBM-DEM permeability . . . . . . . . . . . . 6.3 Granular collapse in fluid . . . . . . . . . . . . 6.3.1 LBM-DEM set-up . . . . . . . . . . . 6.3.2 Collapse in fluid: Flow evolution . . . . 6.3.3 Effect of permeability . . . . . . . . . 6.3.4 Effect of initial packing density . . . . 6.4 Submarine granular flows down inclined planes 6.4.1 Effect of initial density . . . . . . . . . 6.4.2 Effect of permeability . . . . . . . . . 6.5 Tall columns . . . . . . . . . . . . . . . . . . . 6.6 Summary . . . . . . . . . . . . . . . . . . . .
. . . . . . . . . . . .
. . . . . . . . . . . .
. . . . . . . . . . . .
Conclusions and recommendations for future research 7.1 Conclusions . . . . . . . . . . . . . . . . . . . . . . 7.1.1 Multi-scale modelling of dry granular flows . 7.1.2 Granular flows in fluid . . . . . . . . . . . . 7.2 Recommendations for future research . . . . . . . . 7.2.1 Development of numerical tools . . . . . . . 7.2.2 Understanding the rheology of granular flows
References
. . . . . . . . . . . .
. . . . . .
. . . . . . . . . . . .
. . . . . .
. . . . . . . . . . . .
. . . . . .
. . . . . . . . . . . .
. . . . . .
. . . . . . . . . . . .
. . . . . .
. . . . . . . . . . . .
. . . . . .
. . . . . . . . . . . .
. . . . . .
. . . . . . .
. . . . . . . . . . . .
. . . . . .
. . . . . . .
. . . . . . . . . . . .
. . . . . .
. . . . . . .
. . . . . . . . . . . .
. . . . . .
. . . . . . .
. . . . . . . . . . . .
. . . . . .
. . . . . . .
173 176 179 183 188 193 194
. . . . . . . . . . . .
203 203 204 209 210 212 225 237 250 250 258 264 274
. . . . . .
277 277 277 279 282 282 284 287
List of figures 1.1 1.2
Debris slide in Las Colinas, El Salvador, January 2001. . . . . . . . . . . . The extent of the Storegga landslide . . . . . . . . . . . . . . . . . . . . .
2 3
2.1 2.2 2.3
Particle size range and characteristics. . . . . . . . . . . . . . . . . . . . . The modes of viscous dissipation in a granular flow. . . . . . . . . . . . . . Plane shear stress distribution under a constant pressure and shear rate for a granular assembly. . . . . . . . . . . . . . . . . . . . . . . . . . . . . . . Dependence of frictional coefficient µ with dimensionless shear rate I. . . . Variation of dimensionless parameter I for different flow regimes. . . . . . Illustration of the Savage-Hutter model. . . . . . . . . . . . . . . . . . . . Schematic view of the experimental configuration of a quasi-two-dimensional granular column collapse in a rectangular channel (Lajeunesse et al., 2004). Normalised final run-out and height as a function of initial aspect ratio for plane-strain and axisymmetric collapse. . . . . . . . . . . . . . . . . . . . Collapse of granular column simulation using DEM and Shallow-water approximation. . . . . . . . . . . . . . . . . . . . . . . . . . . . . . . . . Final deposit profiles for granular column collapse experiments with different initial aspect ratios (Lube et al., 2005). . . . . . . . . . . . . . . . . . . . . The extent of the failure surface for granular columns with initial aspect ratio of 0.4 and 3 at time t = 0.4τc (Lajeunesse et al., 2004). . . . . . . . . . . . Rough inclined plane: (a) Set-up and (b) hstop (θ ) (black symbols) and hstart (θ ) (white symbols). Reproduced from (Midi, 2004). . . . . . . . . . Complex interactions in a submarine landslide. . . . . . . . . . . . . . . . Experimental set-up of granular collapse in fluid (Rondon et al., 2011). . . . Evolution of run-out and pore-water pressure at the bottom of the flow for granular column collapse in fluid for dense and loose conditions (Rondon et al., 2011). . . . . . . . . . . . . . . . . . . . . . . . . . . . . . . . . . . Pore pressure feedback mechanism: the effect of density (Iverson, 2000). .
10 12
2.4 2.5 2.6 2.7 2.8 2.9 2.10 2.11 2.12 2.13 2.14 2.15
2.16
17 18 20 22 25 27 29 31 32 36 39 39
40 42
List of figures
xvi
2.17 Normalised run-out distance as a function of the peak value of the horizontal kinetic energy per grain (Topin et al., 2011). . . . . . . . . . . . . . . . . . ˙ under a 2.18 Sketch of the motion of a grain, z(t), during a simple shear, γ, confining pressure, Pg . . . . . . . . . . . . . . . . . . . . . . . . . . . . . 3.1 3.2 3.3 3.4 3.5 3.6 3.7 3.8
3.9 3.10 3.11 3.12 3.13 3.14 3.15 3.16 3.17 3.18 4.1 4.2 4.3 4.4 4.5
43 44
Schematic representation of different scales of description involved in the multi-scale modelling of granular materials. . . . . . . . . . . . . . . . . . Difference between mesh-based and mesh-free techniques in modelling large deformation flow. . . . . . . . . . . . . . . . . . . . . . . . . . . . . . . . Typical discretisation of a domain in MPM. . . . . . . . . . . . . . . . . . Illustration of the MPM algorithm. . . . . . . . . . . . . . . . . . . . . . . Schematic description of the occurrence of cell crossing noise in MPM. . . Schematic view of the 1-D basis functions used in MPM (Steffen et al., 2008). Comparison between the GIMP method and the conventional MPM on the flow morphology of a granular column collapse (a = 0.4). . . . . . . . . . . Comparison between the GIMP method and the conventional MPM on the evolution of run-out and height with time for a granular column collapse (a = 0.4). . . . . . . . . . . . . . . . . . . . . . . . . . . . . . . . . . . . . . Calculation of normal force in DEM. . . . . . . . . . . . . . . . . . . . . . Verlet list algorithm for neighbourhood search. . . . . . . . . . . . . . . . Checking the validity of Verlet list in DEM simulations. . . . . . . . . . . . Illustration of the Verlet integration scheme. . . . . . . . . . . . . . . . . . A 2D periodic simulation cell ω with its basis vectors in an absolute frame. Validation of DEM using a disk rolling down an inclined plane. . . . . . . . Generation of a poly-disperse sample using ballistic deposition technique. . A poly-disperse DEM sample generated using ballistic deposition technique. Fortune sweep line algorithm for generating Voronoi Tessellation. . . . . . Voronoi tessellation of a run-out profile showing the local packing density. . The DEM sample used for the granular column collapse simulation and its grain size distribution curve. . . . . . . . . . . . . . . . . . . . . . . . . . DEM set-up of a granular collapse simulation (a = 0.8). . . . . . . . . . . . Periodic shear test using DEM to obtain macroscopic friction angle. . . . . MPM initial mesh and vertical stress for a granular column collapse simulation (a=1). . . . . . . . . . . . . . . . . . . . . . . . . . . . . . . . . . . . Normalised final run-out distance for columns with different initial aspect ratios. . . . . . . . . . . . . . . . . . . . . . . . . . . . . . . . . . . . . .
48 52 54 62 64 67 69
70 76 82 83 86 87 90 93 94 96 96
103 105 107 109 111
List of figures
xvii
4.6
Normalised final collapse height for columns with different initial aspect ratios.112
4.7
Velocity profile of a granular column collapse (a = 0.4, t = τc ). . . . . . . . 114
4.8
Velocity profile of a granular column collapse (a = 0.4, t = τc ). . . . . . . . 115
4.9
Velocity profile of a granular column collapse (a = 6, t = τc ). . . . . . . . . 117
4.10 Velocity profile of a granular column collapse (a = 6, t = 3 × τc ). . . . . . . 118 4.11 Flow evolution of granular column collapse (a = 0.4 and 6). . . . . . . . . . 120 4.12 Scheme of collapse for small aspect ratio columns. . . . . . . . . . . . . . 121 4.13 Energy evolution of granular column collapse (a=0.4 and 6). . . . . . . . . 124 4.14 Flow evolution of granular column collapse using µ(I) rheology (a=0.4 and 6).126 4.15 MPM simulation of evolution of inertial number with time for columns with a = 0.4 and a = 6. . . . . . . . . . . . . . . . . . . . . . . . . . . . . . . . 127 4.16 Effect of density on the run-out evolution a = 0.8. . . . . . . . . . . . . . . 129 4.17 Evolution of local packing density with time a = 0.8. . . . . . . . . . . . . 129 4.18 Effect of density on the energy evolution a = 0.8. . . . . . . . . . . . . . . 131 4.19 Effect of density on the run-out evolution a = 0.8 (poly-dispersity r = 6). . . 132 4.20 Snapshots of granular column collapse at t = 6τc (a = 0.8). . . . . . . . . . 132 4.21 Effect of density on the evolution of energy and packing fraction a = 0.8 (poly-dispersity ‘r’ = 6). . . . . . . . . . . . . . . . . . . . . . . . . . . . . 133 4.22 Effect of density on the run-out behaviour and energy evolution a = 0.6. . . 135 4.23 Initial geometry and dimensions of the pile subjected to a horizontal excitation.136 4.24 Initial configuration for the MPM simulation of a pile subjected to horizontal velocities. . . . . . . . . . . . . . . . . . . . . . . . . . . . . . . . . . . . 138 4.25 Periodic shear test using CD (Mutabaruka, 2013). . . . . . . . . . . . . . . 139 4.26 Evolution of run-out with time for varying material points per cell for a slope subjected to a horizontal velocity. . . . . . . . . . . . . . . . . . . . . . . . 140 4.27 Effect of number of material points on cell on the run-out behaviour E0 = 12.7mgd. Velocity profile (m/s) of granular pile subjected to gradient horizontal loading. . . . . . . . . . . . . . . . . . . . . . . . . . . . . . . . . . 141 4.28 Effect of number of material points on cell on the run-out behaviour E0 = 152mgd. Velocity profile (m/s) of granular pile subjected to gradient horizontal loading. . . . . . . . . . . . . . . . . . . . . . . . . . . . . . . . . . 142 4.29 Evolution of kinetic with time for varying material points per cell for a slope subjected to a horizontal excitation. . . . . . . . . . . . . . . . . . . . . . 143 4.30 Evolution of run-out and duration of flow for varying material points per cell for a slope subjected to a horizontal excitation. . . . . . . . . . . . . . . . 145
xviii
List of figures
4.31 MPM simulation of the initial stages of granular pile subjected to a gradient horizontal energy. . . . . . . . . . . . . . . . . . . . . . . . . . . . . . . . 146 4.32 CD simulation of the initial stages of granular pile subjected to a gradient horizontal energy. (Mutabaruka, 2013). . . . . . . . . . . . . . . . . . . . . 147 4.33 Evolution of run-out and time as a function of the normalised input energy for a pile subjected a gradient horizontal energy. . . . . . . . . . . . . . . . 149 4.34 Evolution of kinetic energy with time (MPM) for a pile subjected to gradient input velocities. . . . . . . . . . . . . . . . . . . . . . . . . . . . . . . . . 151 4.35 Evolution of normalised kinetic energy with normalised time for a pile subjected to gradient input velocities. . . . . . . . . . . . . . . . . . . . . 152 4.36 Evolution of packing density with time E0 = 152mgd (DEM). . . . . . . . 152 4.37 Evolution of vertical and horizontal kinetic energy with time (MPM) for a pile subjected to gradient input velocities. . . . . . . . . . . . . . . . . . . 153 4.38 Evolution of the normalised horizontal kinetic energy as function of time since the transient phase. . . . . . . . . . . . . . . . . . . . . . . . . . . . 154 4.39 Evolution of the normalised horizontal kinetic energy as function of the normalised time since the transient phase. . . . . . . . . . . . . . . . . . . 155 4.40 Decay time and run-out time as a function of the normalised kinetic energy Ekx0 . . . . . . . . . . . . . . . . . . . . . . . . . . . . . . . . . . . . . . . 157 4.41 MPM simulations of effect of friction on the run-out behaviour of slopes subjected to horizontal excitation. . . . . . . . . . . . . . . . . . . . . . . 158 4.42 Snapshots of MPM simulations of the evolution of granular pile subjected to a gradient horizontal energy E0 = 61 mgd. . . . . . . . . . . . . . . . . . . 160 4.43 Snapshots of DEM simulations of the evolution of granular pile subjected to a gradient horizontal energy E0 = 61 mgd. . . . . . . . . . . . . . . . . . . 161 4.44 Effect of input velocity distribution on the run-out behaviour of slopes subjected to horizontal velocities. . . . . . . . . . . . . . . . . . . . . . . . . 162 4.45 Comparison of the normalised run-out between the collapse of granular columns and granular slope subjected to horizontal loading. . . . . . . . . . 163 5.1
The lattice Boltzmann discretisation and the D2Q9 scheme. . . . . . . . . . 169
5.2
Illustration of the streaming process on a D2Q9 lattice. . . . . . . . . . . . 172
5.3
Illustration of the collision process on a D2Q9 lattice. . . . . . . . . . . . . 172
5.4
Half-way bounce back algorithm for the D2Q9 model. . . . . . . . . . . . 178
5.5
Velocity profile obtained from a LBM Simulation of a laminar flow through a channel. . . . . . . . . . . . . . . . . . . . . . . . . . . . . . . . . . . . 181
List of figures 5.6 5.7 5.8 5.9 5.10 5.11 5.12 5.13 5.14 5.15 5.16 5.17
6.1 6.2 6.3 6.4 6.5 6.6 6.7 6.8 6.9
Finite Volume mesh used in the CFD analysis of laminar flow through a channel. . . . . . . . . . . . . . . . . . . . . . . . . . . . . . . . . . . . . Velocity profile obtained from a CFD analysis of laminar flow through a channel. . . . . . . . . . . . . . . . . . . . . . . . . . . . . . . . . . . . . Comparison between LBM and CFD on the development of the Poiseuille velocity profile in time. . . . . . . . . . . . . . . . . . . . . . . . . . . . . LBM simulation of velocity profile for a laminar flow through a pipe with an obstacle at L/4. . . . . . . . . . . . . . . . . . . . . . . . . . . . . . . . . CFD simulation of velocity contour for a laminar flow through a pipe with an obstacle at L/4. . . . . . . . . . . . . . . . . . . . . . . . . . . . . . . . LBM and CFD simulation of the velocity contour at L/2 for a flow around an obstacle at L/4. . . . . . . . . . . . . . . . . . . . . . . . . . . . . . . . . Development of Kármán vortex street around a circular obstacle, for different Reynolds number. . . . . . . . . . . . . . . . . . . . . . . . . . . . . . . . LBM bounce back boundaries for different values of δ . . . . . . . . . . . . Time series of draft, kiss and tumble of two grains during sedimentation in a viscous fluid. . . . . . . . . . . . . . . . . . . . . . . . . . . . . . . . . . Time history of sedimentation of two circular grains. . . . . . . . . . . . . Schematics of a heterogeneous CPU/GPU system. . . . . . . . . . . . . . . Test of scalability of the GPU parallelised code with increase in the number of LBM nodes. . . . . . . . . . . . . . . . . . . . . . . . . . . . . . . . .
xix
181 181 182 183 184 185 187 192 195 196 198 202
Schematic representation of the hydrodynamic radius in LBM-DEM computation. . . . . . . . . . . . . . . . . . . . . . . . . . . . . . . . . . . . . . 206 Evaluation of the horizontal permeability for a hydrodynamic radius of 0.7 R. 207 Variation of the mean flow velocity with pressure gradient for different hydrodynamic radius. . . . . . . . . . . . . . . . . . . . . . . . . . . . . . 208 Relation between permeability and porosity for different hydrodynamic radius and comparison with the analytical solution. . . . . . . . . . . . . . 210 Underwater granular collapse set-up. . . . . . . . . . . . . . . . . . . . . . 211 Discretisation of solid grains in LBM grid. Shows the step-wise representation of circular disks in the lattice. . . . . . . . . . . . . . . . . . . . . . . 213 Flow evolution of a granular column collapse in fluid (a = 0.4) . . . . . . . 214 Evolution of height and run-out with time for a column collapse in fluid (a = 0.4). . . . . . . . . . . . . . . . . . . . . . . . . . . . . . . . . . . . . . . 216 Evolution of kinetic energies with time for a granular column collapse in fluid (a = 0.4). . . . . . . . . . . . . . . . . . . . . . . . . . . . . . . . . . 217
xx
List of figures 6.10 Evolution of the potential energy with time for a granular column collapse in fluid (a = 0.4). . . . . . . . . . . . . . . . . . . . . . . . . . . . . . . . . . 218 6.11 Flow evolution of a granular column collapse in fluid (a = 4) . . . . . . . . 220 6.12 Evolution of run-out and height with time for a column collapse in fluid (a = 4).221 6.13 Evolution of the potential energy with time for a granular column collapse in fluid (a = 4). . . . . . . . . . . . . . . . . . . . . . . . . . . . . . . . . . . 222 6.14 Evolution of kinetic energies with time for a granular column collapse in fluid (a = 4). . . . . . . . . . . . . . . . . . . . . . . . . . . . . . . . . . . 223 6.15 Comparison of run-out and height between dry and submerged collapse for columns with different initial aspect ratios . . . . . . . . . . . . . . . . . . 224 6.16 Effect of permeability on the evolution of run-out for a column collapse in fluid (a = 0.8). . . . . . . . . . . . . . . . . . . . . . . . . . . . . . . . . . 225 6.17 Effect of permeability on the excess pore water pressure distribution for a granular column collapse in fluid (a = 0.8 & dense packing) at t = τc along the horizontal direction at a height of 10d from the base. . . . . . . . . . . 228 6.18 Effect of permeability on the evolution of the potential energy with time for a granular column collapse in fluid (a = 0.8). . . . . . . . . . . . . . . . . . 229 6.19 Effect of permeability on the evolution of kinetic energies with time for a granular column collapse in fluid (a = 0.8). . . . . . . . . . . . . . . . . . . 230 6.20 Effect of permeability on the excess pore water pressure distribution along the bottom plane for a granular column collapse in fluid (a = 0.8 & dense packing) at t = 2τc . . . . . . . . . . . . . . . . . . . . . . . . . . . . . . . 232 6.21 Effect of permeability on the evolution of packing density and Froude’s number for a granular column collapse in fluid (a = 0.8 & dense initial packing). . . . . . . . . . . . . . . . . . . . . . . . . . . . . . . . . . . . 233 6.22 Effect of permeability on the deposit morphology of a granular column collapse in fluid (a = 0.8). . . . . . . . . . . . . . . . . . . . . . . . . . . . 234 6.23 Normalised final run-out distance for columns with different initial aspect ratios. Comparison of dry and submerged granular column collapse for different hydrodynamic radius (0.7 R, 0.8 R and 0.9 R). . . . . . . . . . . . 235 6.24 Normalised final run-out distance for columns as a function of peak kinetic energy in dry and submerged conditions. . . . . . . . . . . . . . . . . . . . 236 6.25 Effect of permeability on the evolution of run-out for a column collapse in fluid (a = 0.8 & loose packing). . . . . . . . . . . . . . . . . . . . . . . . . 238
List of figures
xxi
6.26 Effect of permeability on the excess pore water pressure distribution along the base of a granular column collapse in fluid (a = 0.8 & loose packing) at t = τc . . . . . . . . . . . . . . . . . . . . . . . . . . . . . . . . . . . . . . 240 6.27 Effect of permeability on the excess pore water pressure distribution for a granular column collapse in fluid (a = 0.8 & loose packing) at t = 2τc . . . . 242 6.28 Effect of permeability on the evolution of the potential energy with time for a granular column collapse in fluid (a = 0.8 & loose packing). . . . . . . . . 243 6.29 Effect of permeability on the evolution of kinetic energies with time for a granular column collapse in fluid (a = 0.8 & loose packing). . . . . . . . . 244 6.30 Effect of permeability on the evolution of packing density and Froude’s number for a granular column collapse in fluid (a = 0.8 & loose initial packing).245 6.31 Particle tracking of the deposit morphology for a granular column collapse in fluid (a = 0.8 & loose packing), influence of permeability. . . . . . . . . 246 6.32 Effect of permeability on the normalised effective stress for loose initial packing at t = 2τc . . . . . . . . . . . . . . . . . . . . . . . . . . . . . . . 247 6.33 Evolution of packing fraction at t = τc for dense and loose initial packing fraction. Black means dense packing, while white colour denotes loose packing in the Voronoi cell. . . . . . . . . . . . . . . . . . . . . . . . . . . 248 6.34 Effect of initial density on the deposit morphology for a granular column collapse in fluid (a = 0.8). . . . . . . . . . . . . . . . . . . . . . . . . . . . 249 6.35 Evolution of run-out and kinetic energy with time (dense condition). . . . . 252 6.36 Flow morphology at t = 3τc for different slope angles (dense). . . . . . . . 253 6.37 Evolution of run-out and kinetic energy with time for different slope angles(loose condition). . . . . . . . . . . . . . . . . . . . . . . . . . . . . . 255 6.38 Flow morphology at time t = 3τc for different slope angles (loose condition). 256 6.39 Evolution of packing density and Froude’s number with time for different slope angles. . . . . . . . . . . . . . . . . . . . . . . . . . . . . . . . . . . 257 6.40 Comparison between dry and submerged granular column on the effect of slope angle on the run-out distance (Dense and Loose). . . . . . . . . . . . 259 6.41 Effect of slope angle on the run-out behaviour for different initial packing density. . . . . . . . . . . . . . . . . . . . . . . . . . . . . . . . . . . . . 260 6.42 Evolution of run-out and height with time for different permeability (loose slope 5°). . . . . . . . . . . . . . . . . . . . . . . . . . . . . . . . . . . . 261 6.43 Evolution of kinetic energy and packing density with time for different permeability (loose slope 5°). . . . . . . . . . . . . . . . . . . . . . . . . . 262
xxii
List of figures
6.44 Evolution of the flow front at t = 3τc for different permeabilities (loose slope 5°). . . . . . . . . . . . . . . . . . . . . . . . . . . . . . . . . . . . . . . 263 6.45 Comparison between dry and submerged granular column for a slope angle of 0° and 5° on the effect of permeability on the run-out distance (Dense and Loose). . . . . . . . . . . . . . . . . . . . . . . . . . . . . . . . . . . . . 265 6.46 Effect of permeability on the run-out behaviour for different slope angle and the initial packing density. . . . . . . . . . . . . . . . . . . . . . . . . . . 266 6.47 Flow evolution of a granular column collapse in fluid (a = 6) on a horizontal surface. . . . . . . . . . . . . . . . . . . . . . . . . . . . . . . . . . . . . 268 6.48 Flow evolution of a granular column collapse in fluid (a = 6) on a slope of 5° 270 6.49 Packing density of a granular column collapse in fluid (a = 6) on a slope of 5°.270 6.50 Evolution of run-out and height for a column collapse in fluid (a = 6). . . . 271 6.51 Evolution of the kinetic and the potential energy with time for a granular column collapse in fluid (a = 6). . . . . . . . . . . . . . . . . . . . . . . . 272 6.52 Evolution of the kinetic energies with time for a granular column collapse in fluid (a = 6). . . . . . . . . . . . . . . . . . . . . . . . . . . . . . . . . . . 273
List of tables 3.1
Comparison of theoretical and DEM results for a disk on an inclined plane of 45°. . . . . . . . . . . . . . . . . . . . . . . . . . . . . . . . . . . . . .
89
4.3
Material properties of glass ballotini used in granular column collapse (Lajeunesse et al., 2004). . . . . . . . . . . . . . . . . . . . . . . . . . . . . . . 102 Micro-mechanical parameters used in DEM simulations of granular column collapse. . . . . . . . . . . . . . . . . . . . . . . . . . . . . . . . . . . . . 106 Parameters used in continuum simulations of granular column collapse. . . 108
5.1 5.2 5.3
LBM parameters used in simulating laminar flow through a circular pipe. . 180 Computed Strouhal number for fluid flows with different Reynolds number. 188 GPU vs. CPU parallelisation. . . . . . . . . . . . . . . . . . . . . . . . . . 201
6.1
Configurations for LBM-DEM simulations of granular collapse in fluid. . . 205
4.1 4.2
Nomenclature Roman Symbols a
Acceleration of a grain or a material point
a
Initial aspect ratio of a granular column
av
Specific surface area
b
Body force
C
Concentration in Kinetic theory
c
Pressure wave velocity (or) Lattice speed in LBM
D
Diameter of a pipe
d
Grain diameter
Dh
Hydraulic diameter
Dr
Relative density
E
Young’s modulus of the material
e
Void ratio of the sample (or) LBM fluid particle velocity
ED
Energy lost through drag
Ef
Energy lost through friction
Ek
Kinetic energy
Ep
Potential energy
Er
Energy lost due to remolding and transformation
Nomenclature
xxvi Ev
Energy lost through viscous dissipation
f/F
Applied force (or) Vector of fluxes in the Navier-Stokes equation
f
Fluid density distribution function in LBM
G
Gradient of the function (or) Shear modulus
g
Acceleration due to gravity
K
Bulk modulus
H
Height of a granular column
h
Vertical length scale in shallow water approximation (or) Length of a LBM cell
I
Inertial number (or) Moment of Inertia
k
Stiffness of a grain (or) time step (or) Permeability
kf
Dimensionless parameter defined as the ratio of normal stiffness kn to the applied normal pressure σn′
k∗
Dimensionless parameter defined as the ratio of elastic to inertial effects
L
Length of a granular column (or) background cell size
l
Horizontal length scale in shallow water approximation (or) particle spacing in the Material Point Method
M
Transformation matrix mapping a vector
m
Mass
Ma
Mach number - a dimensionless quantity representing the ratio of speed of an object moving through a fluid and the local speed of sound
N
Shape function or Number of grains/material points
ns
Number of DEM subcycles in a LBM time step
p
Pressure
Pr
Prandtl number - a dimensionless number defined as the ratio of momentum diffusivity to thermal diffusivity
Nomenclature
xxvii
Q
Vector of conserved variables in CFD
R
Radius of a grain in DEM
r
Radius or hydrodynamic radius of a grain in LBM
Re
Reynolds number - a dimensionless quantity that is used to help predict similar flow patterns in different fluid flow situations
S
Collision matrix in LBM
Sc
Smargonisky constant
St
Strouhal number - a dimensionless number describing oscillating unsteady flow dynamics
Sv
Total wetted surface
T
Temperature
t
Time
u
Velocity component along x-direction
V
Volume of a material point
v
Velocity component along y-direction
W
Width of the channel
w
Weight function / test function
p
Position of a material point / node
Greek Symbols α
Conductivity
χ
Characteristic function
δ
Overlap between grains (or) Dirac function
ε
Strain component (or) Coefficient of restitution
ηh
Packing density, defined as the ratio of volume of solids to the total volume (Vs /V )
Nomenclature
xxviii Γ
Dissipation through inelastic collision
γ
Viscous damping of a grain
γ˙
Shear rate
λ
Constant of proportionality in the power-law relationship (or) The time step factor in DEM
µ
Coefficient of friction (or) Dynamic viscosity in fluid
ν
Poisson’s ratio (or) Fluid viscosity
Ω
Domain under consideration
ω
Angular velocity of a grain (or) Local contact natural frequency
Φ
Dilatancy angle
φ
Friction angle in degrees
ϕ
Angular orientation of a grain
φ¯
Weighting function
ψCK
Empirically measured Carman – Kozeny factor
ρ
Density
σ
Stress or confining pressure
τ
Shear stress (or) Surface traction (or ) Relaxation time in LBM
τc
Critical time
τ∗
Total relaxation time
θ
Slope angle
θ¨
Angular acceleration
Superscripts ·
Rate of change of a variable
′
Effective component of the normal stress
Nomenclature Subscripts 0
Initial state
crit
Critical state
ext
External
f
Final state
i
Property of the computational node (MPM) or grain (DEM)
int
Internal
max
Maximum
min
Minimum
n
Normal component
p
Property of the material point
t
Tangential component
y
Yield or failure
Acronyms / Abbreviations ALU
Arithmetic Logic Unit
BEM
Boundary Element Method
CD
Contact Dynamics
CFD
Computational Fluid Dynamics
CK
Carman - Kozeny
DEM
Discrete Element Method
DKT
Draft Kiss Tumble
DNS
Direct Numerical Simulation
EFG
Element-Free Galerkin
FEM
Finite Element Method
xxix
Nomenclature
xxx FLOP
Floating Point Operations
FPU
Floating Point Unit
FVM
Finite Volume Method
GPU
Graphics Processing Unit
LBM
Lattice Boltzmann Method
LES
Large Eddy Simulation
MPM
Material Point Method
MRT
Multi-Relaxation Time
PCI
Peripheral Component Interconnect
PFEM
Particle Finite Element Method
PIC
Particle-in-cell
PPC
Particles per cell
RVE
Representative Elemental Volume
SH
Savage Hutter
SM
Streaming Multiprocessors
USF
Update Stress First
USL
Update Stress Last
Chapter 1 Introduction Avalanches, debris flows, and landslides are geophysical hazards which usually involve the rapid mass movement of granular solids, water and air as a multiphase system. The presence of water in a granular flow distinguishes ‘mud and debris flow’ from ‘granular avalanches’. Debris flow is a rapid mass movement of liquefied, unconsolidated, saturated soil. The speed of the debris flow varies from 50 km/h to 80 km/h in extreme cases, transporting 100 to 100,000 cubic meters of unconsolidated sediments down very steep slopes. Figure 1.1 shows the catastrophic effect of a debris flow that occurred during an earthquake-triggered landslide in Las Colinas, El Salvador. On the other hand, submarine landslides transport sediments across continental shelves even on slopes as flat as 1° and can reach speeds of 80 km/h. Figure 1.2 shows the Storegga Landslide, the largest recorded continental slope failure, which struck off the coast of central Norway transporting materials over 500 km (Ward and Day, 2002). Granular avalanches, debris flow and submarine landslides cause significant damage to life and property. Globally, landslides cost billions of pounds in damage, and thousands of deaths and injuries each year. On 2 May 2014, a pair of mudslides killed at least 2000 people, burying 3000 houses and affecting over 14,000 people after a landslide hit the north-east Afghan province of Badakhshan. Rescuers responding to the initial mudslide were struck by a second mudslide which trapped or killed a large proportion of potential rescuers (Source: BBC, 2014). The consecutive slides levelled the village, and left the area under 10 to 30 metres of mud. A week of torrential rain might be a plausible reason for the mud flows. Understanding the triggering mechanism and the granular flow process provides an insight into the force and velocity distribution in a granular flow, enabling us to design appropriate defensive measures.
2
Introduction
Figure 1.1 Initiation, channelling, spreading and deposition of debris slide in Las Colinas, El Salvador, January 2001. The debris flow buried as many as 500 homes (Source: USGS report on ‘Landslides in Central America’, 2001).
3
Figure 1.2 The extent of the Storegga landslide (Source: School of geoscience, University of Sydney).
Introduction
4
1.1
Modelling granular flow
The dynamics of a homogeneous granular flow involves at least three distinct scales: the microscopic scale which is characterised by the contact between grains, the meso-scale which represents micro-structural effects such as grain rearrangement, and the macroscopic scale. The flow of submarine landslides, which can be as much as 100,000 km3 in volume, is influenced by the grain-grain interactions and the dynamics happening at the scale of a few micrometers to millimetres. This poses a question of how to effectively model the various scales of behaviour observed in a granular flow? Typically, continuum laws are only used when there is a strong separation of scales between the micro-scale and the macro-scale sizes of the flow geometry. Although granular materials are composed of discrete grains which interact only at contacts, the deformations of individual grains are negligible in comparison with the deformation of the granular assembly as a whole. Hence, the deformation is primarily due to the movements of grains as rigid bodies. Therefore, continuum models are still widely used to solve engineering problems associated with granular materials and flows. Conventional mesh-based approaches, such as Finite Element (FE) and Finite Difference (FD) methods, involve complex re-meshing and remapping of variables, which cause additional errors in simulating large deformation problems. Mesh-free methods, such as the Material Point Method (MPM) and Smooth Particle Hydrodynamics (SPH), are not constrained by the mesh size and its distortion, and are effective in simulating large deformation problems such as debris flow and submarine landslides. The analytical and finite-element-like techniques which consider granular materials as a continuum cannot take into account the local geometrical processes that govern the mechanical behaviour of non-homogeneous soils, and pose subtle problems for statistical analysis (Mehta and Barker, 1994). The grain level description of the granular material enriches the macro-scale variables that happen to poorly account for the local rheology of the materials. Numerical tools such as the Discrete Element Method (DEM) allow us to evaluate quantities which are not accessible experimentally, thus providing useful insight into the flow dynamics. Grain-fluid interactions can be simulated by interfacing discrete-element methods with a lattice Boltzmann solver or a computational fluid dynamics solver, however these methods have their inherent limitations. Even though millions of grains can be simulated, the possible size of such a grain system is generally too small to regard it as ‘macroscopic’. Therefore, methods to perform a micromacro transition are important and these ‘microscopic’ simulations of a small sample, i.e. the ‘representative volume element’, can be used to derive macroscopic theories which describes the material within the continuum framework.
1.1 Modelling granular flow
5
Granular flows have been extensively studied during the past two decades through experimental and numerical simulations (Andersen and Andersen, 2010; Denlinger and Iverson, 2001; Iverson et al., 1997; Jaeger et al., 1996; Tang et al., 2013). In most cases, granular flows exhibit three distinct regimes: the slow quasi-static regime, a dilute collisional regime and an intermediate regime. Many theories and phenomenological models have been developed to model the behaviour of different flow regimes. One approach is to use Kinetic theory (Jenkins and Savage, 1983; Savage and Jeffrey, 1981), which assumes binary collision between particles. Kinetic theory is able to capture the rapid-collisional regime, however is incapable of predicting the dense quasi-static behaviour. Under certain conditions, granular flows exhibit some fluid-like behaviour and using a simple analogy from fluid dynamics one can model granular flows as non-Newtonian fluids using a variant of the Navier-Stokes equation (Savage and Hutter, 1991). The depth-averaged shallow water equation has been applied to solve granular flow dynamics with a reasonable amount of success. However, the basic assumption of neglecting the effect of vertical acceleration restricts the approach from describing the triggering mechanism, such as the collapse of a vertical cliff. In certain cases, classical theories are incapable of describing the flow kinematics. Hence, rheologies have been used to describe the mechanical behaviour of granular flows through an empirical relation between deformations and stresses. Midi (2004) proposed a new rheology for granular flows based on extensive experimental and numerical investigation on gravitydriven flows. The µ(I) rheology describes the granular behaviour using a dimensionless number, called the inertial number I, which is the ratio of inertia to the pressure forces. Small values of I correspond to the quasi-static regime, and large values of I correspond to the fully collisional regime of the kinetic theory. The spreading dynamics are found to be similar for the continuum and grain-scale approaches, however the rheology falls short in predicting the run-out distance for steeper slopes and in the transition regime where the shear-rate effect diminishes. The use of rheologies to describe the flow of granular materials in fluids remains largely unexplored. In addition to the scale-effects, most geophysical hazards usually involve multi-phase interactions. The momentum transfer between the discrete and continuous phases significantly affects the dynamics of the flow. In order to describe the mechanism of multi-phase granular flows, it is important to consider both the dynamics of the solid phase and the role of the ambient fluid. Most models which simulate submarine landslides assume a single homogeneous grain-fluid mixture governed by a non-Newtonian fluid behaviour (Denlinger and Iverson, 2001; Iverson, 2000). Although successful in accounting for the general phenomenology on analytical grounds, such models fail to capture certain phenomena such as porosity gradient and fluid-induced size-segregation. Moreover, application of these
Introduction
6
models involves additional assumptions about the boundary/interface between the grains and the fluid, and the transition between high and low shear stresses. The simple µ(I) rheology is found to capture the dense submarine granular flows if the inertial time scale in the rheology is replaced with a viscous time scale (Pouliquen et al., 2005). However, the transition from a rapid granular flow down a slope to the quasi-static regime when the granular mass ceases to flow, where the shear rate decreases rapidly, is not captured by the simple model. The flow threshold or the hysteresis characterising the flow or no-flow condition is also not correctly captured by this model. When the scale of the system is larger than the size of the structure, a simple rheology is expected to capture the overall flow behaviour, however in granular flows, the size of the correlated motion has the same size as the system, causing difficulties in modelling the flow behaviour. Hence, it is essential to study the behaviour of granular flows at various scales, i.e. microscopic, meso-scale and continuum-scale levels, in order to describe the entire granular flow process.
1.2
Objectives
This study is motivated by a simple question: If a granular column collapses and flows in a dry condition and within a fluid, in which case would the run-out be the farthest? The collapse in a fluid experiences drag forces which tend to retard the flow, this might result in a longer run-out distance in the case of dry condition. However, the collapse in fluid might experience lubrication effects due to hydroplaning and this reduces the effective frictional resistance, which might result in a longer run-out distance in the case of fluid than the dry condition. Would the effect of lubrication overcome the drag forces and result in the farthest run-out in fluid? Or would the drag forces predominate resulting in dry case having the farthest run-out distance? Although, a simple problem by description, the influence of various properties such as slope angle, initial packing density, and permeability on the run-out behaviour makes it a complex phenomenon. The other important question is how to model the granular flow behaviour, which exhibits complex fluid-like and/or solid-like behaviour depending on the initial state and the ambient conditions. This research aims to provide an insight into the mechanics of granular flows in dry and submerged conditions, using a multi-scale approach, so as to describe the behaviour of geophysical hazards such as avalanches, debris flows and sub-marine landslides.
1.3 Overview of this work
1.3
7
Overview of this work
This PhD makes advances in the field of numerical modelling of granular flows. Granular materials exhibit complex flow behaviour that often involves multiphase interactions. Development of sophisticated numerical tools that are capable of modelling the different scales of description in a granular flow and the multiphase interaction between the soil grains and the fluid is thereby the focus of this PhD. This study addresses the following areas of granular flow modelling and behaviour: Development of numerical tools for modelling dry granular flow (Chapter 3) The Material Point Method, a continuum based Eulerian - Lagrangian approach, is developed to describe the dynamics of the various granular flow behaviours (described in Chapter 2). The grain-scale response of the granular flow kinematics is captured using Discrete Element Method (DEM). The implementation of DEM and development of tessellations tools for extracting macro-scale properties are also discussed. Dry granular flows (Chapter 4) Multi-scale analyses using MPM and DEM are performed to understand the suitability of MPM as a continuum approach in modelling the collapse of a granular column. Energy evolution studies are carried out to examine the difference in the dissipation mechanism between both approaches. The influence of various initial material properties on the run-out behaviour is investigated. The run-out behaviour of a granular slope subjected to a horizontal excitation is analysed using MPM and DEM. The effect of distribution of kinetic energy on the run-out behaviour of granular slopes is also discussed. Numerical modelling of fluid - grain coupling (Chapter 5) A coupled lattice Boltzmann - DEM approach is implemented in this work to understand the micro-scale interactions between the soil grains and the ambient fluid. Due to the computational demand of this approach, the LBM - DEM technique is implemented on GPUs. A turbulent model is incorporated to capture the interaction of vortices with the granular surface. The validation of the developed LBM-DEM model under different flow conditions is also discussed. Granular flows in fluid (Chapter 6) The fundamental question of the difference in the mechanism of collapse and flow between the dry and the submerged granular columns is addressed. The role of initial granular properties such as packing density, permeability and slope angle on the run-out behaviour of the dry and the submerged granular flows is investigated. This chapter provides an insight into the flow dynamics of submerged granular flows under different initial conditions.
8
Introduction
The videos of simulations performed in this study can be viewed at http://vimeo.com/ kks32/videos.
Chapter 2 Granular flows 2.1
Introduction
A granular material is a conglomeration of a large number of discrete solid grains of sizes greater than 1µm whose behaviour is governed by frictional contacts and inelastic collisions. Figure 2.1 provides a schematic representation of the size range of granular materials. Characterised by the interaction between individual grains, granular materials lie between two extremes scales: the molecular-scale range predominated by the electrostatic force, i.e. Van der Waals forces, and the continuum scale which is described by the bulk property of the material. In various soil classification systems, sand is classified as a granular material with grain sizes greater than 75µm. A grain size of 75µm demarcates an important transition: the point at which the frictional effect begins to dominate the material behaviour and the effect of the electrostatic Van de Waals forces diminishes. The wide range of grain size for granular materials, from the molecular size to the continuum scale, indicates the complexity of granular material behaviour. Such complexity encompasses both grain-like and continuum-like behaviour. The physics of non-cohesive granular assemblies is intriguing. Despite being ubiquitous in nature and having a wide range of applications, including geo-hazard predictions, granular materials are the most poorly understood materials from a theoretical standpoint. For years, granular materials have resisted theoretical development, demonstrating non-trivial behaviour that resembles solid and/or fluid-like behaviour under different circumstances. Even in very simplistic situations, granular materials exhibit surprisingly complex behaviour at the macroscopic level. For instance, walking along the beach and bending over to scoop up a handful of sand demonstrates both its solid-like behaviour, from the firm support of one’s weight as one walks, and its fluid-like behaviour, from the handful of sand running through one’s fingers.
Granular flows
10
The range of grain size gives rise to complex interactions between grains which constitute the particular granular media. Unlike other micro-scale particles, soil grains are insensitive to thermal energy dissipation (Mehta, 2011), because the thermal energy dissipation in a granular material is several orders of magnitude smaller in comparison to the energy dissipation due to the interaction between the grains. Consequently, the thermal energy scales are small when compared to the energy required to move the grains. The granular material reaches the static equilibrium quickly due to its dissipative nature, unless an external source of energy is constantly applied (Choi, 2005). Knowledge of the behaviour of granular assemblies is restricted to two extremes: the solid-like behaviour of dense granular assemblies that resist the shearing force by undergoing plastic deformations and the fluid-like flow behaviour characterised by high shear rates. Granular media are a priori simple systems made of solid grains interacting through their contacts. However, they still resist our understanding and no theoretical framework is available to describe their behaviour (Pouliquen et al., 2006). Because the behaviour of the granular material is highly dependent on its surrounding environment, it is difficult to establish a unified theoretical framework. When strongly agitated, the granular material behaves like a dissipative gas, and kinetic theories have been developed to describe this regime (Popken and Cleary, 1999; Xu et al., 2003). During slow deformations, on the other hand, the quasi-static regime is dominated by steric hindrance, and friction forces are often described using plasticity theories. In between the two regimes, the material flows like a fluid, and the grains experience enduring contacts, a behaviour which is incompatible with the assumptions of the kinetic theory (Pouliquen et al., 2006) that describes the dilute regime of a granular flow. Typical granular flows are dense and hence a fundamental statistical theory is not appropriate to describe their properties. Moreover, during the process of granular flow, the material can exist in all the above-mentioned states, further complicating our understanding of granular flows.
Molecule
Granular material
Colloids
Powder 1 m
1 nm Thermal agitation Van der Waals forces
100 m
Interaction with air Van der Waals forces humidity
Frictional contact
Figure 2.1 Particle size range and characteristics.
Continuum
2.2 Modelling granular flow
2.2
11
Modelling granular flow
Different approaches have been used to model granular flows at different scales of description. The dynamics of a homogeneous granular flow involve at least three distinct scales: (1) the microscopic scale characterised by small time and length scales representing contact/grain interactions, (2) the mesoscopic scale, where grain rearrangements, developments of microstructures and shear rates have a dominant influence on the granular flow behaviour, and (3) the macroscopic scale which involves large length scales that are related to geometric correlations at even larger scales. With such distinct scales, an immediate issue arises with modelling granular flow dynamics: whether one should consider or neglect a particular scale (Radjai and Richefeu, 2009). The difficulty in modelling the granular flows originates from the fundamental characteristics of the granular matter such as negligible thermal fluctuations, highly-dissipative interactions, and a lack of separation between the microscopic grain scale and the macroscopic scale of the flow (Goldhirsch, 2003). Granular flows display a large span of grain concentrations, and therefore exhibit different behaviour at different concentrations (figure 2.2). Granular flows can be classified into three different regimes (Jaeger et al., 1996): (a) kinetic regime, (b) collisional regime, and (c) frictional regime. In the dilute part of the flow, grains randomly fluctuate and translate, this form of viscous dissipation and stress is named the kinetic regime. This regime is characterised by grains moving freely between successive collisions (Goldhirsch, 2003). At higher concentrations, in addition to the previous dissipation form, grains can collide quickly, this gives rise to further dissipation and stress, called the collisional regime. This intermediate fluid-like regime is dense but still flows like a fluid, and the grains interact interact through both collision and friction (Midi, 2004; Pouliquen and Forterre, 2002). Transfer of grain kinetic energy and momentum within a rapidly flowing granular medium occurs during these collisions (Popken and Cleary, 1999). At very high concentrations (more than 50% in volume), grains start to endure long, sliding and rubbing contacts, giving rise to a different from of dissipation and stress, frictional regime. This dense slow quasi-static regime is characterised by long duration between contacts and grain interaction via frictional contact (Roux and Combe, 2002). The momentum and energy transfer are different in accordance with differing granular regimes. For the granular phase, it is imperative that any mathematical model attempting to model the granular flow must account for the above mechanisms, at any time and anywhere within the flow. The mathematical models require a comprehensive unified stress tensor able to adequately describe stress within the flow for any of these regimes, and this must be achieved without imposing which regime will dominate over the others. Several theoretical frameworks have been used to describe the granular flow behaviour. The predominant
Granular flows
12
behaviour in most granular flows is friction. Hence, continuum models based on frictional properties of the granular mass have been widely adopted to discuss granular flow behaviour. Alternatively, dilute granular flow behaviour is conventionally modelled using the kinetic theory, while the dense granular flows are described using the µ(I) rheology. In certain conditions, where the lateral extent of the flow is significantly larger than the vertical component, shallow-water approximation is used. The capability and limitation of the various frameworks are discussed below.
kinetic
collision & kinetic
Frictional
Figure 2.2 The modes of viscous dissipation in a granular flow.
2.2 Modelling granular flow
2.2.1
13
Continuum models
In the frictional regime, grains experience long and permanent contacts when they rub and roll against each other. Hence, a stress tensor based on the mechanical law of friction must be developed. Granular flow modelling began as early as 1776 with Coulomb’s seminal paper describing the yielding of granular material as a frictional process. Although it was not about granular flows per se, the prediction of soil failure for civil engineering applications describes the onset of structural collapse leading to catastrophe (Campbell, 2006). Mohr-Coulomb’s yield criterion, along with a flow rule from metal plasticity, is sufficient to describe the behaviour of granular flow as a continuum process, without considering the interaction of individual grains. Advanced models based on the critical state concept (Schofield and Wroth, 1968) provide further insight into continuum description of granular flows. According to critical state theory, the ‘under consolidated’, or loose, soil tends to increase in density upon shearing, while the dense ‘over consolidated’ soil dilates when sheared, until reaching the critical state. Since dense granular flow involves large shear stresses, it is reasonable to assume that the shearing occurs at the critical state. Large applied stress can cause the granular solids to deform at the grain scale and squeeze them into the inter-grain pores. Granular flows experience rapid shearing, and therefore, it is also reasonable to assume that the flow is incompressible and occurs at the critical state (Campbell, 2006). The main limitation of the continuum approach is the assumption that the friction angle, φ , is a constant material parameter (Potapov and Campbell, 1996). Although the mechanism of dense granular flow is attributed to bulk friction, it is the formation of force chains and the rearrangement of internal structure of the granular assembly that causes friction-like behaviour. Experiments (Savage and Sayed, 1984; Savage, 1984) and computer simulations (Campbell and Brennan, 1985) indicate a weak relation between the bulk friction and the packing density, due to the micro-structural rearrangement of grains (Campbell, 1986). As the packing density increases, the grains tend to arrange themselves in a regular order when sheared. In order to understand the development of micro-structure, it is important to examine the grain-level interactions. Bagnold (1954) was the first to attempt to model granular materials as individual grains. Bagnold’s theory of motion of individual grains in a shear flow and inter-grain friction inducing random velocities is reminiscent of the thermal motion of molecules in the kinetic theory of gases.
Granular flows
14
2.2.2
Kinetic theory
The kinetic theory of gases assumes that the particles interact by instantaneous collisions, which implies only binary (two-particle) collisions. The interactions are modelled using a single coefficient of restitution, representing the energy dissipated by the impact normal to the point of contact between the interactions. For the most part, the surface friction or any other particle interactions tangential to the point of contact are ignored (Campbell, 1990). Jenkins and Savage (1983) extended kinetic theory from thermal fluids to idealised granular mixtures to predict the rapid deformation of granular material by including energy dissipation during collision for nearly inelastic particles. Savage and Jeffrey (1981) extended the kinetic theory to predict simple shear flow behaviour for a wide range of coefficients of restitution. While, the kinetic theory is capable of predicting the shear flow behaviour of particles with identical density and size (Iddir and Arastoopour, 2005), real systems are composed of particles that vary in size, and segregation of particles can occur. The formulation of gas kinetic theory can be used to derive a set of equations for granular flow if the particles are assumed to be rigid. In turn, the rigid particle assumption implies that all contacts occur instantaneously. This assumption creates a vanishing probability of multiple simultaneous contacts and only binary contacts are considered. Kinetic theory formulation yields a set of Navier–Stokes-like equations. Conservation of mass is written as dρc + ρc▽ · u = 0 . dt
(2.1)
Conservation of momentum ρc
du = ▽p(ρ, c, T, ε) + ▽ · (η(p, ρ, c, T, ε)▽u) . dt
(2.2)
Conservation of granular energy (granular temperature) ρc
dT = ▽ · (α(p, ρ, c, T, ε)▽T ) + τ : ▽u − Γ(p, ρ, c, T, ε) . dt
(2.3)
where α is the conductivity, τ : ▽u is the temperature production by shear work, p is the pressure, c is the concentration, ρ is the density, ε is the coefficient of restitution, T is the granular temperature and Γ is the dissipation through inelastic collisions. There are several problems that are immediately apparent with this formulation. The most obvious is that the range of applicability of rapid flow theory is limited. The solid phase stresses are viscous in nature (eq. 2.2), which results in a no-force condition when the granular mass is static (Campbell, 2006).
2.2 Modelling granular flow
15
Kinetic theory is valid for dispersed granular flows (Ng et al., 2008). Van Wachem et al. (2001) observed that numerical simulations of dense granular flow based on kinetic theory did not accurately capture experimental data on fluidised bed expansion. Because of their mechanism of energy dissipation and their tendency to form clusters, confined granular flows are usually dense. Dense granular flows lie in an intermediate regime, where both the grain inertia and the contact network have significant influence on the flow behaviour (Pouliquen and Forterre, 2002). Thus, a part of the force is transmitted through the force network, which contradicts the two basic assumptions in the kinetic theory: binary collision and the molecular chaos. For dense granular flow conditions, the total stress transmission in the flow regime is the sum of the rate-dependent (collision-transition) and the rate-independent (friction) components (Ng et al., 2008). The addition of a frictional stress component (Schaeffer, 1987) to kinetic theory improves the ability of the model to predict the dense granular flows. The main advantage of kinetic theories is that they can be used to derive deterministic constitutive laws to describe the behaviour of granular flows in a theoretical framework (Jenkins and Savage, 1983). Kinetic theories formulated on the assumption that the solid phase stress has a viscous response have limitations when applied to granular flows. A viscous material produces no force unless it is in motion; hence, kinetic theory based on viscous solid phase cannot explain the static force exerted by the granular materials on the walls, as observed in experiments. The frictional component that is based on long-duration contact is added to the instantaneous collision contacts term, which is self-contradictory. Also, the rapid-flow models based on gas kinetic theory assume that the molecular collisions are elastic, which entails that they do not dissipate energy (Campbell, 2006), an assumption which does not match reality. Finally, the important assumption of gas kinetic theory is molecular chaos, which assumes no correlation between the velocities or positions of the colliding particles. This assumption is in direct contrast to dense granular flow where the particles interact many times with their neighbours and a strong correlation between their velocities is inevitable.
2.2.3
Rheology
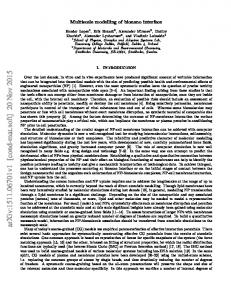
Rheology is the science of flow of materials with solid and fluid characteristics. In practice, rheology is principally concerned with describing the mechanical behaviour of those materials that cannot be described by the classical theories. Rheology seeks to establish an empirical relation between deformation and stresses. Consider a granular assembly of grains having diameter d and density ρd under a confining pressure σn′ (see figure 2.3). Assume the material is sheared at a constant shear rate, γ˙ = vw /L, imposed by the relative movement of the top plate with a velocity vw . In the absence of gravity, force balance implies that the shear stress,
Granular flows
16
τ = σxy , and the normal stress, σn′ = σxy , are homogeneous across the cell. This configuration is the simplest configuration to study the rheology of granular flow, i.e. to study the effect of ˙ and pressure, σn′ on the volume and shear stress, τ. strain rate, γ, Even though the granular materials have been extensively researched at the microscopic level, the continuum representation of granular materials in terms of conservation of mass and momentum is still an area of concern (Daniel et al., 2007; Midi, 2004). The prediction of rheology of granular materials, even in the simplest case is complicated, because they exhibit rate-dependent behaviour, and no single constitutive equation is able to describe the behaviour over a range of shear stress rates. Da Cruz et al. (2005) developed a well known rheology for granular flows that is based on a simple two-dimensional shear in the absence of gravity and that establishes the flow regime and rheological parameters scale with a dimensionless number representing the relative strength of inertia forces with respect to the confining pressure (Daniel et al., 2007), along the lines of Savage and Hutter (1991). The shear stress, τ, is proportional to the confining pressure, σn′ , and is written as τ = σn′ µ(I) .
(2.4)
The friction coefficient µ depends on the single non-dimensional parameter I, expressed as ˙ γd I= p ′ . σn ρ p
(2.5)
The parameter I can be interpreted in terms of different time scales controlling the grain flow. If the grains are rigid, i.e. neglecting the elastic properties of the grains, then I is the only non-dimensional parameter in the problem. Hence, the shear stress, τ, must to be proportional to the pressure, σn′ , multiplied by a function of I. Comparing the shape of the function µ(I) with the experimental results of flow down an inclined plane, Jop et al. (2006) observed that the frictional coefficient increases from a minimal value of µs to an asymptotic value of µ2 , as the value of I increases. The variation of friction coefficient with I is shown in figure 2.4. The friction coefficient can be related to the inertial number I as µ(I) = µs +
µ2 − µs , Io /I + 1
(2.6)
where Io is constant, typically in the range of 0.25 - 0.3. To formulate a complete constitutive model, it is essential to describe the volumetric behaviour. Based on dimensional analysis, it can be argued that the volume change is also a function of dimensionless parameter I and that it also depends on the maximum and the minimum possible void ratios as well as the time for microscopic rearrangement of grains.
2.2 Modelling granular flow
17
Consider two rows of mono-dispersed grains. When a grain is located in the gap formed by two adjacent grains, it is assumed to have a maximum packing fraction. As the grain is sheared along the bottom row of grains, it moves out of the gap, resulting in a minimum packing fraction. The duration required for this rearrangement is directly proportional to the volume fraction. The dimensionless shear rate, expressed as the ratio between the duration of re-arrangement to the mean duration (see figure 2.18), has a linear relationship to the volume fraction.
Figure 2.3 Plane shear stress distribution under a constant pressure and shear rate for a granular assembly.
In general, the flow regimes can be classified based on the dimensionless number I (Da Cruz et al., 2005). Figure 2.5 shows the variation of frictional coefficient µ and packing fraction with dimensionless number I for different flow regimes under simple shearing. Dilute, or “collisional” flow occurs for I > 10−1 , and the grain collision is chiefly binary, accompanied by additional “bounce-back” akin to gases (Kamrin, 2008). In the dilute flow regime, the grains are rarely in long-duration contacts and can be described by dissipative Boltzmann kinetics. The “quasi-static” regime occurs at the other extreme of the spectrum, I < 10−3 , where the intermittent motion is prevalent. The inertial time is always small enough for the grains to align to a dense compaction, without significant collisional dissipation. The frictional sliding and stick-slip dynamics dominate the dissipation mechanism. The
Granular flows
18
kinetic regime
quasi-static regime 0
I
Figure 2.4 Sketch of dependence of frictional coefficient µ with dimensionless shear rate I, reproduced from Pouliquen et al. (2006).
2.2 Modelling granular flow
19
stress/strain-rate relationship becomes singular, driving the system with a range of quasistatic normalised shear rates to all give the same time-average value for µ. In this regime, the dissipation is primarily frictional and rate-independent. The packing fraction appears to be independent of I and grain-level interactions control to flow dynamics. The moderate-flow regime is observed for I between 10−3 and 10−1 and is characterised by faster flows, with a high rate of contact formation and more energy dissipation per impact. In this regime, I has a one-to-one relationship with µ and is large enough for rate dependence, yet small enough for the flow to remain dense. Moderate flows also exhibit the property of shear rate dilation, by which an increase in the normalised flow rate causes the steady-state packing fraction to decrease, which is different from shear dilation, which refers to a decrease in the packing density as a function of total shear. Flows which are too slow to be moderate still undergo shear dilation due to geometric packing constraints, but shearing dilation occurs only in faster flows due to rate effects (Kamrin, 2008). In moderate flows, the dissipation is primarily rate-sensitive due to energy loss during contact formation, yet packing remains dense.
Campbell (2002) described the “Moderate regime” as an elastic granular flow regime, in which the inter-grain stiffness governs the overall flow behaviour of the granular assembly. At high concentrations, the stresses are proportional to the contact stiffness, and the streaming stiffness (that represents the momentum carried by the unsteady motions of particles as they move through the system) is negligible. When a dense granular assembly is sheared, the force chains that transmit the forces continue to rotate until they become unstable and collapse. As the force-chains rotate, the granular material tends to dilate. However, it is restricted due to the constant volume constraint; instead, the rotation compresses the chain, generating an elastic response (Campbell, 2006). Campbell (2002) divided the flow into elastic and inertial regimes. In the elastic regime, the force is transmitted principally through the deformation of force chains with a natural stress scaling of τd/kf . The dimensionless parameter, kf , is defined as the ratio of normal stiffness kn to the applied normal pressure σn′ . The force ˙ and as a result of the rate of chain chains form when the grains are sheared at the rate of γ, ˙ This transitional regime can be explained using formation is proportional to the shear rate γ. the force-chain concept. The lifetime of a force chain is proportional to 1/γ˙ and consequently ˙ the product of the rate of formation and the lifetime of the force chain is independent of γ, and the stresses generated are quasi-static. However, at higher shear rates, the elastic forces in the chain must absorb the additional inertial force of the grains, requiring extra force to rotate the chain proportional to the shear rate. Even though the grains are locked in force chains, the forces generated must represent the grain inertia. The ratio of elastic to inertial
Granular flows
20
Moderate Quasi-static
Collisional
packing fraction
Figure 2.5 Variation of dimensionless parameter I for different flow regimes under simple shearing. (a) Quasi-static (I < 10−3 ): Dissipation is primarily frictional and rate-independent. Packing fraction appears independent of I, and grain-level specifics are more important to flow dynamics; (b) Moderate (10−3 < I < 10−1 ): The dissipation is primarily rate-sensitive due to energy loss during contact formation, yet packing remains dense; (c) Collisional (I > 10−1 ): Flow becomes dilute and gas-like. Dynamics modelled best by dissipative Boltzmann kinetics. Redrawn from Kamrin (2008).
2.2 Modelling granular flow
21
effects is governed by a dimensionless parameter k∗ =
kf , ρd3 γ˙2
(2.7)
where k f /ρd3 γ˙2 = (τ/ρd2 γ 2 )/(τd/k_f) is the ratio of Bagnold’s inertial to the elastic stress scaling. The important dimensionless parameter is k∗ , which is a measure of inertiallyinduced deformation represents the relative effects of elastic to inertial forces, i.e. at large k∗ , the elastic forces dominate and at small k∗ , inertial forces dominate (Campbell, 2006). Constitutive laws, which describe dilatancy and friction, allow to deduce the dependency of pressure and shear stress on shear rate and solid fraction. In contrast to the observation of Campbell (2002), Da Cruz et al. (2005) found that the normalised elastic stiffness kf has little effect on the constitutive law (for values greater than 104 ) however, it does affect the coordination number. Da Cruz et al. (2005) also observed that the microscopic friction coefficient, µ, has a significant influence on the dilatancy, and the solid fraction remains a linearly-decreasing function of I. The frictional properties of the material are found to control the solid fraction, from the critical state to the collisional regime (Da Cruz et al., 2005). Although rheology tends to describe the behaviour of granular flows, the mechanism of granular flows is found to vary with duration, position of granular material in the flow and the pore-pressure feedback mechanism (Iverson, 2003). Rheology summarises the mechanical behaviour at scales that are smaller than the Representative Elemental Volume (REV) for a substance modelled as a continuum. Rheology-based descriptions are generally restricted to homogeneous materials that exhibit time-independent behaviour, and hence are unsuitable for describing granular flows where the stress history has a significant effect on the flow dynamics. The estimation of debris flow yield strength highlights the limitation of rheologies which do not consider the development of strength with evolution of time and space. Johnson (1965) emphasised that debris yield strength is predominantly a frictional phenomenon analogous to the Coulomb strength of granular soils, and that strength consequently varies with effective normal stress. Treatment of yield strength as an adjustable rheological property contradicts the basic understanding that the strength evolves as the debris-flow motion progresses. Frictional behaviour implies no explicit dependence of shear resistance on shear rate, whereas rheological formulas commonly used to model debris flows generally include a viscous component that specifies a fixed functional relationship between shear resistances and shear rate. Although rate-dependent shear resistance is observed in debris flows, its magnitude and origin indicate that it is ancillary rather than essential (Iverson, 2003).
Granular flows
22
2.2.4
Shallow-water approximation
Developing constitutive laws valid from the quasi-static to dilute regimes remains a serious challenge. A simple elasto-plastic approach fails to model the collisional regimes in a granular flow. On the other hand, the original kinetic theory based on binary collisions does not capture the correct behaviour in the dense regime. In configurations where the flowing layer is thin, a different theoretical framework is adopted. One such approach is the depth-averaged shallow-water equation, which has been applied to solve granular flow dynamics with a reasonable amount of success. The Savage-Hutter model (Savage and Hutter, 1991), is a depth-average continuum-mechanics-based approach which consists of hyperbolic partial differential equations to describe the distribution of the depth and the topography of an avalanching mass of cohesion-less granular media (Hutter et al., 2005). This approach is based on the assumption that the horizontal length scale is very large in comparison with the vertical length scale, which allows to neglect the horizontal partial derivatives relative to the vertical partial derivatives. Field observations of natural avalanches indicate an aspect ratio of 10−3 to 10−4 (Cawthor, 2006). By neglecting the vertical length scale, the continuum equation for conservation of mass and momentum can be written as ∂x u + ∂y v = 0 , ∂t u + u∂x u + v∂y u = (▽ · σ )x + Fx .
Figure 2.6 Illustration of the Savage-Hutter model.
(2.8) (2.9)
2.2 Modelling granular flow
23
The continuum equation requires determining the components of the stress tensor and a suitable constitutive law. The Savage-Hutter (SH) model uses the Mohr-Coulomb law to describe the constitutive relation. The conservation of mass and momentum in the SH model is based on the assumption of granular flow as an incompressible fluid flow, which entails that the density of the avalanche, remains constant. Although Hutter et al. (1995) observed the density of the granular flow to remain almost constant in a flow down a curved chute, the destructive nature of landslides and avalanches restricts us from inferring a conclusive result. The SH model involves the following assumptions: (1) Coulomb-type sliding takes place with a bed friction angle δ , (2) Mohr-Coulomb frictional behaviour occurs inside the material with internal angle of friction, φ ≥ δ , and (3) the velocity profile is assumed to be uniform throughout the avalanche depth. The granular flow over a rigid plane inclined at an angle, θ , is shown in figure 2.6. The mass and momentum balance in the SH model is written as ∂h ∂ + (hu) = 0 , ∂t ∂x ∂u ∂u ∂h +u = (sin θ − tan δ sgn(u) cos θ ) − β , ∂t ∂x ∂x
(2.10) (2.11)
where capital letters denote non-dimensional quantities with respect to the typical horizontal p and vertical length scales (l∗ , h∗ ) and the time scale ( l∗ /g). The key feature in the shallow water approximation is the Mohr-Coulomb constitutive law, applied at the free surface and at the base, to describe the granular flow. Comparison of the model with the post-calculation of the Madlein avalanche in Austria indicates that the Coulomb basal friction is insufficient and requires an additional viscous component. The SH model’s predictions were not satisfactory for granular flows down gentle slopes of inclination angle ≤ 30o , where granular materials exhibit premature stops (Hutter et al., 2005). The SH model has not yet been tested in cases where the granular flow interacts with obstacles.
The two main modelling techniques that are commonly employed to describe granular flow are the continuum approach and the discrete element approach. The continuum approach involves treating granular assembly as a continuum and describing its response using constitutive laws, while the discrete approach involves considering the individual grains of the granular material and applying Newton’s laws of motion to describe the deformation of the material. These approaches are adopted in the present study and detailed discussions are provided in chapter 3.
Granular flows
24
2.3
Studies on granular flows
The flow of dense granular material is a common phenomenon in engineering predictions, such as avalanches, landslides, and debris-flow modelling. Despite the huge amount of research that has gone into describing the behaviour of granular flow, a constitutive equation that describes the overall behaviour of a flowing granular material is still lacking. To model geo-physical scale problems, the depth-averaged constitutive equations have been employed along with an empirical friction coefficient and a velocity profile deduced from experiments (Iverson, 2003; Midi, 2004; Pouliquen, 1999). Although this approach has been successful to a certain extent in predicting geophysical flows (Hutter et al., 1995; Pouliquen and Chevoir, 2002), it presents two important shortcomings (Lajeunesse et al., 2005): firstly, the depth-average method is true only if the thickness of the flowing layer is thin in comparison with the lateral dimension, and secondly, the empirical laws are deduced from experiments performed under steady-flow conditions. The shortcomings cast doubt on the validity of the depth-averaged approach. Two simple granular flow studies, granular column collapse and granular flow down an inclined plane, carried out by various researchers to understand the flow behaviour are discussed in the following subsections.
2.3.1
Granular column collapse
Lube et al. (2005) and Lajeunesse et al. (2004) have carried out experimental investigations on the collapse behaviour of granular columns on a horizontal plane. Both experiments involved filling a column of height H0 and length L0 with granular material of mass m. Figure 2.7 shows the schematic view of the experimental configuration of a quasi-two-dimensional granular column collapse in a rectangular channel. The granular column is then released en masse by quickly removing the gate, thus allowing the granular material to collapse onto the horizontal surface, forming a deposit with final height Hf and radius Lf . Although the experiment is simple and attractive allowing us to explore the limitations of depth-average modelling techniques, a constitutive law that could describe the entire flow behaviour is still lacking. The primary aim of these experiments was to determine the scaling laws for the run-out distance. Deposit morphology Experimental findings Lajeunesse et al. (2005) observed that the flow dynamics and the final run-out distance remain independent of the volume of granular material that is released, but depend only on
2.3 Studies on granular flows
25
Figure 2.7 Schematic view of the experimental configuration of a quasi-two-dimensional granular column collapse in a rectangular channel (Lajeunesse et al., 2004).
the initial aspect ratio a of the granular column. The experiment was conducted in order to understand the effect of the geometrical configuration on the run-out, the mechanism of initiation of the flow, the evolution of flow with time, and how such complex flow dynamics could produce deposits obeying simple power laws. Lube et al. (2005) explored the effect of density and shape of grains on flow dynamics, whereas Lajeunesse et al. (2004) worked with glass beads to study the influence of bead size and substrate properties on the deposit morphology. Surprisingly, both drew the striking conclusion that the flow duration, the spreading velocity, the final extent of the deposit, and the fraction of energy which is dissipated during the flow can be scaled in a quantitative way independent of substrate properties, bead size, density, and the shape of the granular material and released mass, m (Lajeunesse et al., 2005). The normalised final run-out distance as a function of the initial aspect ratios of the granular column under plane-strain and axisymmetric conditions is displayed in figure 2.8a. Lube et al. (2005) scaled the run-out distance as Lf − L0 1.24a, a ≲ 1.7 ≈ (2.12) 1.6a1.2 , a ≳ 1.7 L0 while Lajeunesse et al. (2005) scaled the run-out distance as Lf − L0 1.35a, a ≲ 0.74 ≈ 2.0a1.2 , a ≳ 0.74 L0
(2.13)
Granular flows
26
The final run-out distance is found to have a linear relationship for short columns and exhibit a power-law relation with the initial aspect ratio of tall columns. The normalised final height as a function of the initial aspect ratios of the granular column under plane-strain and axisymmetric conditions is shown in figure 2.8b. The evolution of the final scaled deposit height Hf /L0 , with the initial aspect ratio a for the axisymmetric collapse (Lajeunesse et al., 2005) is given as a, a ≲ 0.74 Hf /L0 ≈ (2.14) 0.74, a ≳ 0.74 and for two-dimensional collapse a, a ≲ 0.7 Hf /L0 ≈ a1/3 , a ≳ 0.7
(2.15)
The final height of collapse is unaffected in both 2D collapse and axisymmetric collapse for short columns. In the case of tall columns, axisymmetric collapse exhibits a constant final height, whereas a power-law relation with the initial aspect ratio is observed in 2D collapse. Axisymmetric versus two-dimensional collapse Quasi-two-dimensional collapse of a granular column on a horizontal surface reveals that the geometric configuration influences the scaling of the run-out distance (Lajeunesse et al., 2005). The run-out in a quasi-two-dimensional collapse of a granular column in a rectangular channel scales as a ≲ 2.3 Lf − L0 1.2a, ≈ (2.16) 1.9a2/3 , a ≳ 2.3 L0 Balmforth and Kerswell (2005) studied the collapse of granular columns in rectangular channels with a narrow (width W of the slot = 10 * diameter d) and a wide slot (W = 200 * d), and focused on the deposit shape. Lacaze et al. (2008) observed that slots with width W ≥ 1.2 × d do not crystallise and wider slots W ≥ 2 × d overcome the effect of jamming. As in the axisymmetric case, Balmforth and Kerswell (2005) observed that the run-out is well-represented at large aspect ratios by a simple power-law expression, which depends on the width of the channel. The run-out distance can be scaled as ∆L/L0 ≈ λ a0.65 for narrow channels and as ∆L/L0 ≈ λ a0.9 for wide channels. The scaling found for quasitwo-dimensional experiments in the narrow gap configuration gives similar results to those
2.3 Studies on granular flows
27
(a) Normalised final run-out distance vs. aspect ratio.
(b) Normalised height vs. aspect ratio. Figure 2.8 The normalised final run-out distance and final height as a function of the initial aspect ratios of the granular column under plane-strain and axisymmetric conditions (Lajeunesse et al., 2004).
28
Granular flows
reported by Lube et al. (2005) and approximately a scaling of (Lf − L0 )/L0 ∝ a2/3 . However, these laws are influenced by the presence of sidewalls and depend, albeit only in the numerical coefficient of proportionality, on the frictional properties of the granular material. Balmforth and Kerswell (2005) observed that the constant of proportionality, λ , in the power-law relation is found to vary with the internal friction angle of the granular material. This observation contradicts the findings of previous authors, especially Lube et al. (2005) who found that the scaling of run-out is independent of the granular material. Such a contradiction may perhaps be due to a narrow range of experimental materials and grain size distributions considered in the previous studies. Balmforth and Kerswell (2005) found that the material properties have almost no influence on the exponent of the normalised run-out as a function of the initial aspect ratio. The numerical constant of proportionality, however, showed clear material dependence. There by corroborating the conclusions of Lajeunesse et al. (2004). Daerr and Douady (1999) also observed a strong influence of initial packing density and the internal structure on the behaviour of granular flows. By comparing the initial and final cross-section areas of the pile, Balmforth and Kerswell (2005) observed that the granular material experienced dilation (by about 10%) as the flow progressed to form the final deposit (Balmforth and Kerswell, 2005). Although internal packing structure and density change is found to have an influence on the run-out behaviour, a proper understanding of the effect of density on the run-out and evolution of packing fraction is still lacking. Numerical modelling Numerical simulations of granular column collapse by Zenit (2005) and Staron and Hinch (2007) yielded similar scaling of run-out with aspect ratio a. Unlike other researchers, Zenit (2005) did not observe any transition in the run-out behaviour of a granular column collapse with the aspect ratio a. The origin of the exponents is still under discussion. No model has yet achieved a comprehensive explanation of the complex-collapse dynamics. For higher aspect ratios, the free fall of the column controls the dynamics of the collapse, and the energy dissipation at the base is attributed to the coefficient of restitution. Thus, the initial potential energy stored in the system is dissipated by sideways flow of material, and the mass ejected sideways is found to play a significant role in the spreading process, i.e. as a increases, the same fraction of initial potential energy drives an increasing proportion of initial mass against friction. Thus explaining the power-law dependence of the run-out distance on a. Taking advantage of the similarity between granular slumping and the classical “dam break” problem in fluid mechanics, Kerswell (2005) solved both the axisymmetric and twodimensional granular-collapse problem using the shallow-water approximation. Although the results of the shallow-water approximation have good agreement with experimental
2.3 Studies on granular flows
29
Figure 2.9 Collapse of granular column simulation using DEM (Staron and Hinch, 2007) and Shallowwater approximation (Kerswell, 2005).
results, the shallow-water approximation overestimates the run-out distance for columns with aspect ratio a greater than unity. The shallow-water equation does not take into account the effect of vertical acceleration (Lajeunesse et al., 2005), which has been found to play a significant role in controlling the collapse dynamics (Staron and Hinch, 2007), thus resulting in overestimation of the run-out distance. The evolution of run-out predicted from shallow-water approximation and DEM are shown in figure 2.9. Tall columns demonstrated significantly longer run-out distances when using continuum approaches like the material point method (Bandara, 2013; Mast et al., 2014a). It was observed that a simple friction model cannot effectively describe the collapse dynamics (Staron and Hinch, 2007). However, the reason for difference in the run-out behaviour is currently not known.
30
Granular flows
The final collapse height observed in the numerical simulations of granular collapse is similar to that of the experimental results (Balmforth and Kerswell, 2005; Lube et al., 2005). Numerical simulation of granular column collapse (Lacaze et al., 2008; Staron and Hinch, 2007) displayed a transition in the flow behaviour at a≥ 10, which was not observed in granular collapse experiments (Balmforth and Kerswell, 2005; Lajeunesse et al., 2004; Lube et al., 2005). In the depth-averaged shallow-water model the emphasis is on capturing the scaling of the final deposit, rather than trying to reproduce the internal structure of the flow. The shallow-water model succeeds in capturing the final deposit scaling for lower aspect ratios, yet it fails to capture the flow dynamics for granular columns with higher aspect ratios, where the flow is governed mainly by the vertical collapse of the granular column as a whole. The run-out distance predicted is clearly erroneous in the collapse regime where there is a sudden drop in efficiency by which the initial potential energy of the system is converted into the kinetic energy for spreading. According to Kerswell (2005), even a more sophisticated basal drag law would not be sufficient to model the mechanism of granular column collapse realistically using the shallow-water approximation. Given the large spectrum of theoretical frameworks, no consensus exists on the origin of the power-law, and finding constitutive laws that maintain validity from the quasi-static to the dilute regimes remains a serious challenge. Flow dynamics Experimental findings The final scaled run-out distance shows a transition from a linear to a power-law relationship with the initial aspect ratio of the column at a of 1.7, indicating either a transformation in the spreading process or the collapse mechanism. To understand the collapse mechanism, it is insufficient to study only the final scaled profile, and hence the entire flow process should be analysed. Lajeunesse et al. (2005) observed the flow regime and deposit morphology for a quasi-two-dimensional granular collapse in a rectangular channel. The flow phenomenology of a granular column collapse in a rectangular channel was surprisingly similar to that observed in the axisymmetric collapse (Lajeunesse et al., 2004; Lube et al., 2005), dependent mainly on the initial aspect ratio a (section 2.3.1). The flow dynamics involve the spreading of granular mass by avalanching of flanks, producing a truncated cone for a ≲ 0.74 and a cone for a ≳ 0.74. As the aspect ratio is increased, the transition of flow dynamics occurs (figure 2.10). The evolution of the deposit height remains independent of the flow for a ≲ 0.7, however it exhibits significant dependence on the geometrical configuration for a ≳ 0.7. In rectangular channels, the effect of side-wall on the run-out behaviour was observed; the surface velocity profile between the side walls
2.3 Studies on granular flows
31
Figure 2.10 Final deposit profiles for granular column collapse experiments with different initial aspect ratios (Lube et al., 2005).
is that of a plug flow with a high slip velocity at the wall and low shear along the direction transverse to the flow. Systematic measurements indicate that the ratio of the maximum surface velocity to the surface velocity at the wall is between 1.2 and 1.4. Lajeunesse et al. (2005) observed that the difference between the evolution of Hf in the axisymmetric geometry and in the rectangular channel is not an experimental artefact due to the side wall friction, rather is a geometrical effect. Understanding the internal flow structure will provide an important insight into the complex collapse dynamics. The failure surface observed at t = 0.4τc , where τc is the critical time at which the flow is fully mobilised, for granular columns with initial aspect ratio of 0.4 and 3 are shown in figure 2.11. For smaller values of aspect ratio a ≤ 0.7, the flow is initiated by a failure at the edge of the pile along a well-defined shear band above which material slides down and below which the grains remain static. The grains located above the shear-failure surface move en masse and most of the shear is concentrated along this surface, forming a truncated-cone-like deposit with a central motionless plateau in figure 2.11. For columns with larger aspect ratios, the flow is still initiated by failure along a well-defined surface, an inclined plane in two-dimensional geometry or a cone in the axisymmetric case. However, the initial height of the column is much higher than the top of the failure surface, causing a vertical fall of grains until they reach the summit where they diverge along the horizontal direction, dissipating a lot of kinetic energy, resulting in a final conical deposit. Interestingly, the final deposit height coincides with the summit of the failure surface in the axisymmetric geometry, whereas in the rectangular channel, the deposit summit always lies above the top of the failure surface (Lajeunesse et al., 2005). Shallow-water approximations show a truncated cone-like deposit, while DEM simulations show a cone-like deposit for a ∼ 1.0 (figure 2.9). This shows the inability of the shallow-water approximation to model tall columns.
32
Granular flows
Figure 2.11 The extent of the failure surface for granular columns with initial aspect ratio of 0.4 and 3 at time t = 0.4τc (Lajeunesse et al., 2004). Short columns show truncated conical deposit at the end of the flow, while tall columns exhibit conical deposit.
Identification of the static region is an important task, as the static region is a prime component in describing the collapse mechanism. Regardless of the experimental configuration, the flow is initiated by rupture along a well-defined failure surface, and the failure angle remains of the order of 50° to 55° (figure 2.11). The failure angle is consistent with an interpretation of active Coulomb failure, which leads to a failure angle φf = 45° + φ ′ /2, where φ ′ is the internal friction angle of the granular material. The internal friction angle of glass beads is estimated from the angle of repose as 22°, thereby the failure angle is computed as 56°, which is in good agreement with the experimental findings. Contrary to the assumption of Lajeunesse et al. (2004), the shear-failure angle was found to have no direct effect on the transition between truncated cone and conical deposit occurring at aspect ratio a of 0.7 (Lajeunesse et al., 2005). Schaefer (1990) observed the onset of instability in a narrow wedge of 56° to 65°, which corresponding to the angle of shear bands. A rate-dependent constitutive relationship (Jop et al., 2006) for dense granular flows indicate the angle of shear-band orientation depends on the inertial number I. For small to moderate values of I, the orientation of shear bands is found to vary from the Roscoe and the Coulomb solutions to a unique admissible angle (Lemiale et al., 2011). Daerr and Douady (1999) observed active Coulomb-type yielding in transient surface flows for granular materials with a packing density of 0.62 to 0.65.
2.3 Studies on granular flows
33
Numerical findings In order to describe the complex flow dynamics, it is necessary to understand the internal structure and the flow behaviour. (Staron and Hinch, 2007) categorised the flow evolution into three stages. The first stage involves conversion of the initial potential energy of the grains into vertical motion, resulting in downwards acceleration of grains. In the second stage, the grains undergo collision with the base and/or neighbouring grains, and their vertical motion is converted into horizontal motion. The velocity field depends on the position of grains along the pile. In the region above the static core, the flow is locally parallel to the failure surface and has an upper linear part and a lower exponential tail near the static bed (figure 2.11). The velocity flow profile is similar to that of a steady granular flow (Midi, 2004). In the third and final stage, the grains eventually leave the base area of the column and flow sideways. At the front, the flow involves the entire thickness of the pile and corresponds to a plug flow in the horizontal direction. The typical velocity observed at the front of the ejecting mass √ is v = 2gL0 . As the pile spreads, the flow diverges resulting in separation of the interface, and the static region starts to move inwards. This particular effect is predominant in the case of granular flows in a rectangular channel. The typical time required for the flow to cease and form the final deposit, from the instant p of its release, is τc = H0 /g (Staron and Hinch, 2007). While plotting the variation of normalised potential and kinetic energy with normalised time, Staron and Hinch (2007) observed that the flow ceases when the normalised time t/τc is 2.5, i.e. the flow is assumed to have stopped when the total normalised energy is almost zero. This observation is consistent with the experimental results of both Lube et al. (2005) and Lajeunesse et al. (2005). The transition of the flow occurs when the normalised time t/τc is 1.0, which is defined as the critical time at which the flow is fully mobilised.
Comments on modelling In order to have a detailed understanding of the final profile of the collapsed granular column, it is important to solve the collapse problem as an initial-value problem (Balmforth and Kerswell, 2005), beginning from the instant of release and extending to the time when the material finally ceases to flow, forming the final deposit. Since the process of granular collapse involves collective dynamics of collisions and momentum transfer, the prediction of the trajectory of a single grain is difficult. In fact, there are quantitative disagreements between theory and experiments; the final shapes are reproducible, but not perfectly. Some of the disagreement arises because the experiments did not have exactly the same amount of materials. Understandably, it is indeed difficult to fill the pile with exactly the same amount
34
Granular flows
of material, which inevitably results in differences in packing. However, the theoretical errors are due to the inability of the models to capture the physics that governs the flow dynamics (Balmforth and Kerswell, 2005). Shallow-water models fail to account for the vertical acceleration, which is responsible for the momentum transfer and, in turn, the spreading process. This failure restricts the shallow water model from capturing the mechanism of collapse until the critical time τc . Surprisingly, shallow-water models capture certain experimental aspects for columns with lower aspect ratios (Balmforth and Kerswell, 2005; Kerswell, 2005; Mangeney et al., 2010), even though the contrast between surface flows and the static region is important in this range of aspect ratios. Thus, the assumption of plug flow in the horizontal direction is not critical in capturing the run-out behaviour, particularly if the basal friction coefficient is used as a fitting parameter (Lajeunesse et al., 2005). Simple mathematical models based on conservation of horizontal momentum capture the scaling laws of the final deposit. However, they fail to describe the initial transition regime, indicating that the initial transition has negligible effect on the run-out, which is incorrect. Models based on the initial potential energy show promise, but the effect of material properties, such as basal friction and coefficient of restitution, on the run-out behaviour is still unclear and produces non-physical run-outs. The µ(I) rheology predicts the normalised run-out behaviour quite well in comparison with the experimental results, at least for lower aspect ratios. The spreading dynamics are found to be similar for the continuum and grain approaches. Yet, the rheology falls short in predicting the run-out distance for higher aspect ratios. Unlike Lube et al. (2005), some researchers (Balmforth and Kerswell, 2005; Kerswell, 2005) observed a strong dependency of material properties on the run-out distance. Moistening the materials or the sides of the channel even by a small amount leads to markedly different results. Staron and Hinch (2007) observed that the friction has little effect on the run-out for granular column collapse for high aspect ratios, which are driven mainly by the free vertical fall of grains. The initial conditions have a significant impact on the overall behaviour of the granular system, indicating the significance of the triggering mechanism in the case of the natural flows (Staron and Hinch, 2007). A theoretical framework that is capable of describing the influence of material properties on the run-out behaviour is still lacking. Numerical investigations, such as Discrete Element Method techniques, allow us to evaluate these quantities which are not accessible experimentally, thus providing useful insight into flow dynamics. Subsequent chapters discuss the methodology and modelling of granular columns by continuum- and discrete-element approaches. The effects of initial packing fraction and the internal structure on the run-out behaviour are also discussed. The
2.3 Studies on granular flows
35
difference in the mechanism of modelling the granular flows in continuum and discrete approaches are presented in chapter 4.
2.3.2
Flow down an inclined plane
Most contemporary research on granular materials focuses on with steady-state flow. Transient and inhomogeneous boundary conditions are much less amenable to observation and analysis and have thus been less extensively studied, despite their primary importance in engineering practice. Studies on the flow of granular materials down inclined planes are important to understand the mechanism of geophysical hazards, such as granular avalanches, debris flows and submarine landslides. Large-scale field tests on dry and saturated granular materials have been carried out to capture the mechanism of granular flows down an inclined plane (Denlinger and Iverson, 2001; Okada and Ochiai, 2008).
Experimental findings Granular material stored in a reservoir at the top of the inclined plane is released by opening a gate (figure 2.12). The flow rate is controlled by the height of the opening. The material flows down and develops into a dense granular flow. An initially static granular layer of uniform thickness, ‘h’, starts to flow when the plane inclination reaches a critical angle, θstart . The material reaches a sustained flow until the inclination is decreased down to a second critical angle, θstop (Midi, 2004). The occurrence of two critical angles indicates the hysteretic nature of granular materials. Reciprocally, the critical angle thresholds can be interpreted in terms of critical layer thickness: hstop (θ ) and hstart (θ ). The measurement of hstop (φ ) is easier as it corresponds to the thickness of the deposit remaining on the plane once the flow has ceased. The two curves hstop (θ ) and hstart (θ ) divide the phase diagram (h, θ ) into three regions: a region where no flow occurs, (h < hstop (θ )); a sub-critical region where both static and flowing layers can exist, (hstop (θ ) < h < hstart (θ )); and a region where flow always occurs, (h > hstart (θ )). In the flow regime, i.e. (h > hstart (θ )), the flow is steady and uniform for moderate inclination, but accelerates along the plane for large inclinations (Midi, 2004). The critical angle controlling the flow behaviour tends to increase when the thickness of the bed decreases (Daerr and Douady, 1999; Pouliquen and Chevoir, 2002). This can be attributed to non-trivial finite-size effects and/or boundary effects that are not well understood (Forterre and Pouliquen, 2008). There exists a value of roughness for which a maximum thickness of deposit is observed, which might correspond to a maximum of effective friction at the bottom (Midi, 2004).
36
Granular flows
Figure 2.12 Rough inclined plane: (a) Set-up and (b) hstop (θ ) (black symbols) and hstart (θ ) (white symbols). Reproduced from (Midi, 2004).
For thick enough piles flowing on a rough inclined plane, h ≥ 20 × d, the velocity profiles and rheology follow Bagnold scaling. As the height of the flowing pile reduces, a continuous transition from Bagnold rheology to linear velocity profiles to avalanche-like dynamics occurs, until finally, one reaches the angle of repose θr , and the flow ceases. This transition behaviour is difficult to model.
Numerical modelling Fast moving granular flows can undergo a motion-induced self-fluidisation process under the combined effects of flow front instabilities setting on at large values of the Froude’s number, which are responsible for extensive entrainment, and longer time between collisions of soil grains. Self-fluidisation results in enhanced mobility of the solids, causing an inviscid flow (Bareschino et al., 2008). It is understood that, for a granular material to flow, it has to exceed a certain critical threshold, i.e. the friction criterion, or the ratio of shear stress to normal stress. Without an internal stress scale for a granular material, granular materials exhibit solid-fluid transition behaviour based on the friction criterion (Forterre and Pouliquen, 2008). The stress ratio in the flowing regime above the static bed indicates that the solid-tofluid transition is a yielding phenomenon and can be described by Mohr-Coulomb-like failure criterion (Zhang and Campbell, 1992). This is in contrast to the mechanism of behaviour of other complex fluids, where there is an internal stress scale linked to the breakage of microscopic structure. From a microscopic standpoint of view, the strength of granular
2.3 Studies on granular flows
37
materials is due to the internal friction between grains, however, packed frictionless materials still exhibit macroscopic friction. Constitutive laws based on plasticity theories, which relate the micro-structure to the macroscopic behaviour (Roux and Combe, 2002) provide useful insight into the mechanism of granular flow. At present, however, they are limited to the initiation of deformation and do not predict quasi-static flow. Continuum approaches, such as the Material Point Method simulation of granular flow down an inclined plane (Abe et al., 2006; Bandara, 2013), capture the flow behaviour in the initial stages, yet the model exhibits inconsistent behaviour when the granular material ceases to flow. This may be due to the application of small deformation theory to a large deformation problem and the use of zero dilation. Alternatively, by using the µ(I) rheology, we can capture the velocity profile and the localization at the free surface. However, the rheology fails to model the transition from a continuous flow to an avalanching regime as the flow rate is decreased (Pouliquen et al., 2006). The rheology predicts no-flow below a critical angle, θs = arctan(µs ), independent of the thickness. Pouliquen (1999) observed that the critical angle increases when the thickness of the flow decreases. Granular flow down rough inclined planes exhibits strong Coulomb shear stresses on a plane normal to the basal flow boundary. The stresses dissipate the energy along the rough surface. Models that lack multi-dimensional momentum transport or Coulomb friction cannot represent this energy dissipation. Comments on modelling Granular flow down inclined planes exhibits a transient behaviour. Various velocity profiles and flow behaviours can be obtained not only through changing the height of the flowing granular mass, but also by varying the inclination of the chute, such that there is an overlap region where one can obtain similar flow properties through either procedure. These features can be used to better predict the evolution of an avalanche surface. The experimental configuration is ideal for studying the effectiveness of various theoretical frameworks in modelling granular flows, especially with regards to the transition from solid-like to fluid-like behaviour. The µ(I) rheology and models that are based on Coulomb friction are able to predict the energy dissipation along the rough surface. However, they fail to capture the transition from static to a flowing behaviour, and when it ceases to flow. In large-scale granular flow down slopes, only those grains that are located on the flow surface will have higher I values, due to lower mean pressures. However, grains located within the main flowing mass experience higher mean pressure, thus resulting in smaller I values. Hence, µ(I) rheology is less effective in large scale problems and a simple Mohr-Coulomb model will yield a similar response. It can be suggested that the flow is governed by its momentum. It
Granular flows
38
is important to carry out DEM simulations to understand the mechanics of the flow transition behaviour. This will enable us to describe the continuum response of phase transition more efficiently.
2.3.3
Saturated and submerged granular flows
Submarine mass movements pose a significant threat to off-shore structures, especially oil and gas platforms. Geophysical hazards, such as debris flows and submarine landslides, usually involve flow of granular solids and water as a single-phase system. Modelling the multi-phase interaction poses a serious challenge. The momentum transfer between the discrete and the continuous phases significantly affects the dynamics of the flow as a whole (Topin et al., 2011). The complex interactions between the soil and the ambient fluid are shown in figure 2.13. For a given granular mass, the energy balance can be written as E p + Es = Ek + E f + ED + Ev + Er ,
(2.17)
where Es is the seismic energy resulting from an earthquake, E f is the friction loss, ED is the friction loss due to drag effects on the upper surface of the flow, Ev is the loss due to viscous effects and Er is the energy used to remold or transform the intact material. During the course of a submarine slide event (and also a sub-aerial slide), there appears to be a process by which there are some changes in the solid to water ratio which provide a sufficiently low strength to allow flow to occur (Locat and Lee, 2002). Whatever the exact nature of the phenomenon, it is embedded in the remoulding energy (Er ). In both sub-aerial and submarine landslides, the triggering energy is the same (initial potential energy). It appears as though the submarine landslides experience more dissipation ED and Ev than sub-aerial landslides, but run-out in submarine landslide will be shorter due to more dissipation. The effects of hydroplaning and fluidisation of the flowing mass result in complex interactions, complicating the ability to predict to the exact mechanism of run-out and the length of run-out in submarine conditions for a given initial state. Experimental findings The collapse of a granular column, which mimics the collapse of a cliff, has been extensively studied in the case of dry granular material, when the interstitial fluid plays no role. The case of the collapse in the presence of an interstitial fluid has not been studied in depth (Topin et al., 2012). Rondon et al. (2011) performed granular column collapse experiments in fluid to understand the role of initial volume fraction. The experimental set-up of granular collapse in fluid performed by Rondon et al. (2011) is shown in figure 2.14.
2.3 Studies on granular flows
39
Figure 2.13 Schematic diagram showing the generation of a turbidity current (suspension flow) for drag forces on the surface, potential lifting of frontal lobe leading to the process of hydroplaning, the basal shear stress causing erosion and deposition (Locat and Lee, 2002).
Figure 2.14 Experimental set-up of granular collapse in fluid (Rondon et al., 2011).
40
Granular flows
Figure 2.15 demonstrates the evolution of run-out and pore-pressure at the bottom of the granular flow. The entire loose column is mobilised immediately, in contrast to the dense case. The loose column in fluid spreads almost twice as long as the dense case. The collapse of a granular column in a viscous fluid is found to be mainly controlled by the initial volume fraction, not by the aspect ratio of the column. The role of the initial volume fraction observed in the viscous collapse can be understood by the pore pressure feedback mechanism proposed by Iverson (2000); Schaeffer and Iverson (2008) in the context of landslides.
Figure 2.15 Evolution of run-out and pore-water pressure at the bottom of the flow for granular column collapse in fluid for dense and loose conditions (Rondon et al., 2011).
Iverson (2000) observed in the large-scale field tests that soil prepared in a loose state on a slope and subjected to a rainfall flows rapidly like a liquid when it breaks, whereas a dense soil only slowly creeps (figure 2.16). The underlying mechanism is related to the dilation or contraction character of the granular material, which the researchers described as the “pore pressure feedback”. The compaction or dilation of grains can cause additional stress in the grains which can stabilise or destabilise the soil. The loose sediment experiences high positive pore-pressure and low shear stresses resulting in a quicker flow, while the large negative pore-pressure in the dense case delays the run-out. The flow is controlled by the
2.3 Studies on granular flows
41
coupling of the dilatancy of the granular layer and the development of pore pressure in the fluid phase (Pailha et al., 2008). The dense column must dilate in order to flow. When it starts to fall, liquid is then sucked into the column, which is stabilised by the additional viscous drag (Rondon et al., 2011; Topin et al., 2012). In the dense condition, large negative-pore pressures are developed in the initial stages of collapse; they collapse has to overcome the large negative pore-pressure before it starts to flow. This results in a slow flow evolution as demonstrated by the flatness of the initial run-out curve in the dense condition in comparison to the steep slope in the loose case (figure 2.15). When the loose column starts flowing, on the other hand, it expands and ejects liquid, leading to a partial fluidisation of the material. The large positive pore-pressure developed at the bottom of the flow in the loose condition indicates water entrainment and hydroplaning. The entrainment of water at the basal flow front lubricates the frictional effect, and in combination with hydroplaning, results in a longer run-out distance. Little research has been carried out to understand the difference in mechanisms of dry and submerged granular flow. Cassar et al. (2005) investigated the flow of dense granular material down an inclined plane fully-immersed in water. The velocities observed in the submarine case were found to be a magnitude smaller than the dry condition. This is in contrast to the idea that the submarine landslides tend to flow longer than their sub-aerial counterpart. In order to compare the dry collapse with the submarine collapse, it is important to use the same initial configuration. As discussed previously, packing soil grains to the same initial density is difficult. Hence, it is important to perform numerical studies and develop a theoretical framework that can explain the submarine granular flow behaviour. Numerical modelling Although certain macroscopic models are able to capture simple mechanical behaviours, the complex physical mechanisms occurring at the grain scale, such as hydrodynamic instabilities, formation of clusters, collapse, and transport (Peker and Helvacı, 2007; Topin et al., 2011), have largely been ignored. In particular, when the solid phase reaches a high volume fraction, the strong heterogeneity arising from the contact forces between the grains and the hydrodynamic forces, is difficult to integrate into the homogenization process involving global averages (Topin et al., 2011). In two-phase models (Pitman and Le, 2005), the momentum transfer between the grains and the suspension fluid depends on the momentum equations of both phases. In the case of mixture theory-based models (Meruane et al., 2010), the shear-induced migration and grains collisions are considered in an average sense. In order to describe the mechanism of saturated and/or immersed granular flows, it is necessary to consider both the dynamics of the solid
42
Granular flows
Figure 2.16 Pore pressure feedback mechanism: the effect of density (Iverson, 2000).
2.3 Studies on granular flows
43
phase and the role of the ambient fluid (Denlinger and Iverson, 2001; Iverson, 1997). The dynamics of the solid phase alone are insufficient to describe the mechanism of granular flow in a fluid; it is important to also consider the effect of hydrodynamic forces that reduce the weight of the solids inducing a transition from dense-compacted to dense-suspended flows, and the drag interactions which counteract the movement of the solids (Meruane et al., 2010). Topin et al. (2011) performed granular collapse in fluid using Non-Smooth Contact Dynamics coupled with the distributed Lagrange multiplier/fictitious domain (DLM/FD) method. The mechanisms for collapse of granular columns in dry and submerged conditions are compared. Topin et al. (2011) observed that for a given initial geometry, the run-out distance in the dry case is significantly higher than the submerged condition, an observation similar to the experimental results of Cassar et al. (2005). In the dry case, inertia is responsible for the enhanced mobility at high aspect ratios. In submerged conditions like the viscous regime, however, the inertial effects remain negligible, a result which could explain why the important parameter controlling the dynamics is the initial volume fraction and not the initial aspect ratio. Topin et al. (2011) observed that the run-out distances exhibit a power-law relation with the peak kinetic energy in all three regimes: fluid inertial, grain inertial and viscous regime (figure 2.17). The viscous regime is where the grain reaches the viscous limit velocity, the Stoke’s number, St > St (Courrech du Pont et al., 2003). However, the role of the volume fraction on dry granular collapse has not been precisely studied, and the preparation of the pile may also play a role (Daerr and Douad, 1999).
Figure 2.17 Normalised run-out distance as a function of the peak value of the horizontal kinetic energy per grain (Topin et al., 2011).
Granular flows
44
The µ(I) rheology relates the non-dimensionless number I to the shear rate through a characteristic time. In the case of dry granular flows, the parameter I is defined as the ratio between the time elapsed for a grain to fall into the hole, tmicro , and the meantime, tmean , which is inversely related to the shear rate. Cassar et al. (2005) observed that the run-out behaviour collapse onto a single friction law, demonstrating that the major role of the fluid is to change the time required for a grain to fall into a void-space. If the inertial time scale in the rheology is replaced with a viscous time scale. the µ(I) rheology for dry dense flows can be modified to capture the behaviour of dense submarine granular flows. Indeed, Pitman and Le (2005) observed that if the fluid inertial effects are small enough, then a simpler model ˙ under a can be adopted. A sketch of the motion of a grain, z(t), during a simple shear, γ, confining pressure (Pg ) is shown in figure 2.18. Hence, assuming that the fluid velocity is low enough for the contact interaction between grains to be significant, the time required for the grain to fall into a hole, tmicro , is then controlled by the viscosity of the ambient fluid. Thus, the dimensionless parameter can thereby be modified to incorporate the viscous time in order to describe granular flow in a fluid (Pouliquen et al., 2005). For short time scales, the grain initially accelerates but as a result of the drag force, the grain eventually reaches a limit viscous velocity, v∞v . The time required to travel a diameter, d, is given as t f all = d/v∞v . This new viscous time is used to define the dimensionless number.
z
˙ under a confining pressure, Figure 2.18 Sketch of the motion of a grain, z(t), during a simple shear, γ, Pg .
2.4 Summary
45
Comments on modelling The µ(I) rheology is found to be valid only for the steady uniform regime; unsteady phenomena, such as the triggering of avalanches, result in the coupling between the granular grains and the ambient fluid, a result that is much more complex to model. Transient regimes, characterised by change in solid fraction, dilation at the onset of flow and development of excess pore pressure, result in altering the balance between the stress carried by the fluid and the stress carried by the grains, thereby changing the overall behaviour of the flow (Denlinger and Iverson, 2001). The µ(I) rheology seems to predict well the flow of granular materials in the dense regime. However, the transition to the quasi-static regime, where the shear rate vanishes, is not captured by the simple model. Furthermore, shear band formation observed under certain flow configurations is not predicted. The flow threshold, or the hysteresis, characterizing the flow or no-flow condition is not correctly captured by the model, either can be due to the discrepancies between the physical mechanism controlling the grain level interactions, clustering, and vortex formations. When the scale of the system is larger than the size of the structure, a simple rheology is expected to capture the overall flow behaviour. Yet, the size of the correlated motion is the same as that of the system, , a similarity which causes difficulties in modelling the flow behaviour (Pouliquen et al., 2005). Hence, it is essential to study the behaviour of granular flows at various scales, i.e. microscopic, meso-scale and continuum level, in order to develop a constitutive model that captures the entire flow process.
2.4
Summary
Granular flow involves three distinct regimes: the dense quasi-static regime, the rapid and dilute flow regime, and an intermediate regime. The dynamics of homogeneous granular flow also involve at least three different scales, making it difficult to describe the mechanics of granular flow by simple theories. It is important to describe the granular dynamics as an initial-value problem. Experimental conditions are too difficult to reproduce precisely, resulting in inherent inconsistencies in the results. Numerical models, such as the shallowwater approximation, kinetic theory approach, and rheologies, have captured the basic flow dynamics but have failed to describe the complete mechanics of the granular flow. The collapse of a granular column is a simple case of granular flow. Experimental results have shown that the run-out distances exhibit a power-law dependence with the initial aspect ratio of the column. Although numerical simulations and theoretical frameworks were able to recover the power-law behaviour, they were unable to explain the origin of the power law or capture the various stages of the flow. The initial conditions have a significant impact on the
46
Granular flows
overall behaviour of the granular system. However, a theoretical framework that is capable of describing the influence of material properties on the run-out behaviour is still lacking. In the present study, the capability of continuum models, such as the Mohr-Coulomb model and µ(I) rheology, in simulating the granular column collapse is investigated by comparing the results with the discrete-element simulations. The role of initial packing fraction on the run-out behaviour is also investigated. Submarine granular flows exhibit complex interactions between the soil grains and the ambient fluid. The presence of fluid causes drag interacts which slows down the run-out, while the entrainment at the flow front causes hydroplaning and longer run-out distance. The run-out distance is found to be controlled by the initial volume rather than the aspect ratio of the column. Loose granular columns flow longer than the dense conditions. However, researchers observed longer run-out in dry conditions compared to the submerged collapse conditions. The difference in the mechanism of dry and submerged granular flows is not well researched. The role of initial volume fraction on the run-out behaviour is not precisely known. This study focuses on the effect of initial packing and permeability on the run-out by performing grain-scale simulations. This study investigates the influence of grain-scale quantities, which are otherwise not accessible experimentally, on the run-out behaviour thus providing useful insight into the flow dynamics, thereby enabling us to develop better constitutive laws.
Chapter 3 Numerical modelling of granular flow 3.1
Introduction
Most geotechnical analyses involve failure prediction and the design of structures that can safely withstand applied loads. However, it is very important to study the post-failure behaviour to mitigate risk posed by geophysical and gravity-driven flows, such as landslides, avalanches, slope failures, and debris flows. Granular flows are complex problems in continuum mechanics for which no closed-form solution exists. Hence, it is essential to develop alternative solution schemes which are capable of simulating failure mechanisms and post-failure dynamics of granular media. The dynamics of a homogeneous granular flow involve at least three distinct scales: the microscopic scale, which is characterised by the contact between grains; the meso-scale that represents micro-structural effects such as grain rearrangement; and the macroscopic scale, where geometric correlations can be observed (figure 3.1). Conventionally, granular flows are modelled as continua because they exhibit many collective phenomena. However, on a grain scale, granular materials exhibit complex solid-like and/or fluid-like behaviours. Recent studies, however, suggest that a continuum law may be unable to capture the effect of inhomogeneities at the grain scale level, such as orientation of force chains. Discrete element methods (DEM) are capable of simulating these micro-structural effects; however, they are computationally expensive.
3.2
Continuum modelling of granular flow
Numerical techniques prove to be the most powerful way for modelling the granular assembly. It is important to argue why it is acceptable to model the granular materials as a continuum.
Numerical modelling of granular flow
48
Scales of description
Multi-scale modelling
Contact
Particle
Composition & Interactions
Packing
Statistical behaviour
Particle scale simulation, DEM
Material RVE
Structure BVP
Constitutive behaviour (rheology)
Continuum simulation RVE: Representative Volume Element BVP: Boundary Value Problem
Figure 3.1 Schematic representation of different scales of description involved in the multi-scale modelling of granular materials.
Even at the outset, it may appear that such a treatment is objectionable. The most blatant reason is the fact that the micro-constituents of granular matter, i.e. the individual grains, are not small enough to warrant a continuum description (Kamrin et al., 2007). Typical continuum laws are only expected to apply when there is a strong separation of scales, i.e. separation of the micro-scale from the macro-scale, in the flow geometry. Continuum mechanics rely on the fundamental notion of a representative volume element, in which properties averaged over discrete grains exhibit deterministic relationships. Recent work on granular materials suggests that a continuum law may be incapable of revealing inhomogeneities at the grainscale level (Rycroft et al., 2009a). Microscopic features of dense granular materials which seem to defy a simple continuum description include (i) complex, fractal networks of force chains, which are inhomogeneous down to the grain level (Goldhirsch, 2003), (ii) buckling of force chains and instabilities in shear band, (iii) anomalous, non-collisional particle dynamics and proximity to the jamming transition, where geometrical packing constraints suppress any dynamics, and (iv) a wide range of dynamic response, from liquid-like to solid-like behaviours (Aranson and Tsimring, 2001, 2002; Jaeger et al., 1996). The first three points cast serious doubt on the prospects of a continuum law. The third point entails that the full stress tensor must be described, and it may depend on strain, deformation rate, and material variables that can evolve during the process (Rycroft et al., 2009a). Granular materials exhibit many collective phenomena (Jaeger et al., 1996). However, no continuum model is yet capable of describing behaviours such as granular fingering on rough slopes, plug flow and the occurrence of localised shear bands in the granular materials. Most constitutive models, even in the simple case of dry granular flows, cannot describe
3.2 Continuum modelling of granular flow
49
the entire range of flow from solid to fluid. In certain cases, granular flow is modelled as a fluid behaviour. Continuum models that are based on averaging techniques applied to representative volume elements are mostly utilised in problems involving quasi-static conditions. The fundamental question is how to meaningfully model granular materials which exhibit complex phenomena. The oldest approach involves modelling the granular material as a rigid solid, which behaves as an ideal Coulomb material and undergoes failure if the ratio of the shear stress to the normal stress in any plane reaches a critical value of the Coulomb internal friction coefficient µ. The stress is determined based on the mechanical equilibrium of the system along with the hypothesis of incipient yield, i.e. the yield criterion is attained everywhere at all times (in a “limit-state”) (Rycroft et al., 2009a). The fundamental assumption of a limit-state stress field at incipient yield everywhere is questionable. Granular flows can contain regions of stress lying within the yield surface. In fact, discrete-element simulations show that the grains in this region essentially remain static (Staron et al., 2005). Some of the limitations of the Mohr-Coulomb plasticity in modelling granular materials include linearisation of the limit-stress envelope and the inability to account for variable volume change characteristics depending on pre-consolidation pressure during shearing, predicting unrealistic negative pore-pressure upon shearing due to constant rate of dilation, and the inability to predict compressive plastic strains in soft-soils. Mohr–Coulomb plasticity has been used extensively in engineering applications (Nedderman, 1992), but the general solution requires sophisticated numerical techniques to capture shock-like discontinuities in stress and velocity, which arise even in relatively simplistic geometries. The coaxiality feature of Mohr-Coulomb plasticity is useful in describing debris flows. The principle of coaxiality claims that material should flow by extending along the minor principal stress direction and contracting along the major principal stress direction; the principal planes of stress are aligned with the principal planes of strain-rate. Granular materials deform solely based on the alignment of the principal planes. Under this assumption, the major principal plane is usually vertical due to gravity, and the coaxiality rule requires the material to expand horizontally, as is the case for granular column collapse. However, the coaxiality can be troubling depending on the circumstances. Consider a flat-bottomed quasi-2D silo with smooth side-walls. Under standard filling procedures, the walls provide only enough pressure to keep the grains from sliding farther out. For example, in a slow dense granular flow through a silo, the principal plane remains vertical and coaxiality requires the granular material to expand horizontally, thus making it geometrically impossible for the granular material to converge and exit through the orifice. Depending on the boundary conditions, Mohr-Coulomb plasticity can result in discontinuities or jumps in the velocity and
50
Numerical modelling of granular flow
stress fields (Rycroft et al., 2006). Coaxiality can also violate principles of thermodynamics. Coaxiality only ensures that there is no shear strain-rate in the principal stress reference frame and actually does not directly enforce that the two principal strain-rate axes and the axis of maximal compression (i.e. the major principal strain-rate direction) must align with the major principal stress direction. Roscoe (1970) showed that the principal axes of strain rate and of stress are generally not coincidental during simple shear tests of sand. Despite the plastic character of the flow, the flow rules obtained by employing the rheological concept of perfect plasticity to granular materials (perfect soil plasticity) are definitely inadequate for a description of fully-developed shear flow. The non-coaxiality of the tensors of stress and strain increment are able to explain the shear flow behaviour. The rotations of the principal stress and the principal plastic strain rate are found to be non-coaxial, particularly at the early stage of loading. However, the axes tend to become coincidental at large shear strains (Yu and Yuan, 2006), which are common in geophysical flows. Advanced elasto-plastic models based on the critical state theory provide a better representation of granular flows in a quasi-static regime, but do not have any rate-dependent effects that are associated with rapid granular flows. At large shear strains, such as geophysical flows, the granular mass is considered to be in a critical state. Another continuum-based model is the partial fluidisation model, which uses a set of equations that describes the flow velocity and the shear stresses along with an auxiliary order parameter to predict granular flow behaviour. The order parameter of the granular media controls the size of the viscous-like contribution to the stress tensor and describes the transition between the flowing and the static components of the granular system (Aranson and Tsimring, 2001). A constitutive model, which considers the solid fraction as the main microscopic parameter for describing dense granular flow, was proposed by Josserand et al. (2004). The stress in the granular material is divided into a rate-dependent part representing the reboundless impact between grains and a rate-independent part associated with longer contacts, i.e. quasi-static regime. Although the model captures shear localization behaviour, it fails to describe granular flow behaviour at rough boundaries. In the basal or frictional layer, grain rotation plays an important role. This rotation causes the grain stress tensor to be non-symmetric and results in a perturbed profile in the solid fraction, phenomena which require specific modelling (Josserand et al., 2004). In the case of saturated/submerged soil conditions, most continuum techniques do not consider fully coupled behaviours. Rather, they consider the soil-fluid mixture as a single phase material. However, modelling of pore pressure dissipation is important to capture accurate flow behaviour, especially in submarine conditions, where they play a crucial role in the flow dynamics. Presence of ambient fluid may retard the flow due to viscous drag
3.2 Continuum modelling of granular flow
51
or accelerate the flow through a lubrication effect. Fully coupled constitutive models are essential to realistically capture the initiation and propagation of rapid granular flows. Granular materials are composed of distinct grains which interact only at the contact points. It is assumed that the deformations of individual grains are negligible in comparison with the deformation of the granular assembly as a whole. The latter deformation is primarily due to the movement of the grains as rigid bodies. Therefore, it can be argued that precise modelling of grain deformation is not necessary to obtain a good approximation of the overall mechanical behaviour. An Eulerian grain-level continuum model describes the response of individual grains to the applied loads. However, continuum mechanics solves over the whole domain using initial and boundary conditions appropriate for the problem. Hence, continuum models are still widely used to solve engineering problems associated with granular materials and flows.
3.2.1
Mesh-based and mesh-free techniques
In continuum mechanics, there are two different descriptions of the deformation of a continuum, namely Lagrangian and Eulerian descriptions. In the Lagrangian description, the movement of the continuum is specified as a function of the material coordinates and time. This particle description is often applied in solid mechanics. The Eulerian description, on the other hand, focuses on the current configuration focusing on a fixed point in space as time progresses, instead of individual particles as they move through space and time. The Eulerian description is commonly used for describing fluid flows where kinematic properties are of particular interest. Conventional mesh-based Lagragian approaches, such as the Finite Element Method or the Finite Difference Method, are capable of modelling history-dependent material behaviour and have well-defined free surfaces. However, they require complex re-meshing and remapping of variables, causing additional errors in simulating large deformation problems (Li and Liu, 2002). Unlike in Lagrangian FEM, the computational mesh in the Eulerian FEM is kept spatially fixed while the material is deforming in time. The Eulerian description produces the capability for handling large deformations without the problem of mesh distortion. As the computational mesh is completely decoupled from the material, convective terms appear in the Eulerian FEM, introducing numerical difficulties because of their non-symmetrical properties (Donea et al., 1982). Additionally, Eulerian FEM is difficult to use with historydependent constitutive models. The Coupled Eulerian–Lagrangian (CEL) method is an arbitrary Lagrangian-Eulerian method that attempts to capture the advantages of both the Lagrangian and the Eulerian method in modelling large deformation problems in geomechanics (Qiu et al., 2011). This approach involves solving the governing equations in a
52
Numerical modelling of granular flow
Lagrangian step, thus obtaining the material displacement, followed by the Eulerian step where a new mesh is generated and and the variables are transferred to the the new mesh. This requires greater computation time.
Figure 3.2 Difference between mesh-based and mesh-free techniques in modelling large deformation flow.
An alternative to the mesh-based approach is the use of mesh-less Lagrangian methods (figure 3.2) where the nodes representing the solids transform as the continuum deforms, avoiding the problem of mesh distortion, i.e. the nodes representing the solids can move freely within the domain. Mesh-free methods, such as Smooth Particle Hydrodynamics and Material Point Method, are not constrained by the mesh size and mesh distortion effects, and hence can be effectively used in simulating large deformation problems, such as debris flow and submarine landslides. The element-free Galerkin (EFG) method is a relatively new mesh-less method, in which the trial functions for the weak form are constructed using moving least squares interpolation (Belytschko et al., 1994). The particle finite element method (PFEM) is another mesh-less method that involves mesh-less finite element interpolation. In PFEM, the nodal points represent the particles and the computational mesh is constructed by connecting these points. The mesh is then used to solve the governing equations in a Lagrangian fashion. In PFEM, large deformation requires frequent re-meshing (Kafaji, 2013). Smooth Particle Hydrodynamics is the oldest mesh-free technique, in which the domain is discretised into particles that have a spatial distance, called the smoothing length over which the material properties are “smoothed” by a kernel function. SPH was developed to solve astrophysical problems (Monaghan, 2005). SPH has been applied in geomechanics for solving large deformation problems (Augarde and Heaney, 2009; Maeda and Sakai, 2010;
3.3 Material Point Method (MPM)
53
Mori, 2008). Although SPH has been successfully used, it has a few drawbacks: SPH exhibits spatial instabilities, as a consequence of the point-wise integration (Bonet and Kulasegaram, 2000), insufficient neighbouring particles causes inconsistencies, and it is computationally expensive as a result of the search for the neighbouring particles (Bandara, 2013).
3.3
Material Point Method (MPM)
The Material Point Method (MPM) (Sulsky et al., 1994, 1995) is a particle based method that represents the material as a collection of material points, and their deformations are determined by Newton’s laws of motion. Sulsky et al. (1994) extended the Particle-in-Cell (PIC) method (Harlow, 1964) to computational solid mechanics by taking advantage of the combined Eulerian-Lagrangian approach. The MPM is a hybrid Eulerian-Lagrangian approach, which uses moving material points and computational nodes on a background mesh. This approach is very effective particularly in the context of large deformations (Andersen and Andersen, 2010; Bandara, 2013; Mackenzie-Helnwein et al., 2010; Mast et al., 2014a; Shin, 2010; Zhang et al., 2009). Although not derived directly from what are classically considered as mesh-free or mesh-less methods, MPM is still considered as a mesh-free approach, primarily because the initial discretisation of the material does not involve a polygonal tessellation, as in the Finite Element Method. However, MPM utilises a background mesh to perform differentiation, integration, and to solve equations of motion (Steffen et al., 2008). The background mesh can be of any form, though for computational efficiency a Cartesian lattice is adopted. A typical 2D discretisation of a solid body is shown in figure 3.3. The grey circles in figure 3.3 are the material points x p , where ‘p’ represents a material point, and the computational nodes are the points of intersection of the grid (denoted as Xi , where i represents a computational node). MPM involves discretising the domain, Ω, with a set of material points. The material points are assigned an initial value of position, velocity, mass, volume, and stress, denoted as x p , v p , m p , V p and σ p , respectively. Depending on the material being simulated, additional parameters, like pressure, temperature, pore-water pressure, etc., are specified at the material points. The material points are assumed to be within the computational grid which for ease of computation, is assumed to be a Cartesian lattice (figure 3.3). At every time step tk , the MPM computation cycle involves projecting the data, such as position, mass, and velocity, from the material points to the computational grid using the standard nodal basis functions, called the shape functions, derived from the position of the particle with respect to the grid. Gradient terms are calculated on the computational grid, and the governing equation, i.e. the equation of motion, is solved with the updated
54
Numerical modelling of granular flow
Figure 3.3 Typical discretisation of a domain in MPM. The dotted line represents the boundary of the simulated object, Ω, and each closed point represents a material point used to discretise Ω. The square mesh represents the background grid. Each square in the background grid is a grid cell, and grid nodes are located at the corners of grid cells.
position and velocity values mapping back to the material points. The mesh is reinitialised to its original state and the computational cycle is repeated.
3.3.1
Discrete formulation of the governing equations
The governing differential equation for a continuum is derived from the conservation of mass and momentum: ∂ρ ρ∆ · v = 0 , dt ρa = ∆ · σ + ρb ,
(3.1) (3.2)
where ρ(x,t) is the mass density, v(x,t) is the velocity, a(x,t) is the acceleration, σ (x,t) is the Cauchy’s stress tensor, and b(x,t) is the body force. The vector x represents the current position of any material point in the continuum at time t. In MPM, the continuum body is discretised into a finite number of material points, N p . Let xtp (p = 1, 2, . . . , N p ) denote the current position of material point p at time t. Each material point, at any given time t, has an associated mass mtp , density ρ pt , velocity vtp , Cauchy stress tensor σ pt , strain ε pt , and other necessary internal state variables based on the adopted constitutive model. These material points provide a Lagrangian description of the continuum body. Since material points have a fixed mass at all times, eq. 3.1 is satisfied. The data from the material points are mapped on to the nodes of the computational grid, where the discrete form of eq. 3.2 is described. The
3.3 Material Point Method (MPM)
55
weak form of eq. 3.2 is obtained by multiplying eq. 3.2 with a test function w(x,t): Z Ω
ρw · adΩ = −
Z Ω
ρσ : ∆wdΩ + s
Z ∂ Ωτ
w · τdS +
Z Ω
ρw · bdΩ ,
(3.3)
where σ s is the specific stress (i.e. stress divided by mass density, σ s = σ /ρ), Ω is the current configuration of the continuum and τ is the surface traction. Eq 3.3 is obtained by applying the divergence theorem, similar to the standard procedure adopted in Finite Element Methods (Chen and Brannon, 2002; Sulsky et al., 1994, 1995). The differential volume and the surface elements are denoted by dΩ and dS, respectively. As the whole continuum is discretised into a finite set of material points, the mass density can be written as Np
ρ(x,t) =
∑ m pδ (x − xtp) ,
(3.4)
p=1
where δ is the Dirac delta function. Substituting eq. 3.4 in eq. 3.3, the sum of quantities of material points can be evaluated as Np
∑
p=1
Np
m p [w(xtp ,t) · a(xtp ,t)] =
∑ m p[−σ s(xtp,t) : ∆w|xtp
p=1
+ w(xtp ,t) · τ s (xtp ,t)h−1 + w(xtp ,t) · b(xtp ,t)] ,
(3.5)
where h is the thickness of the boundary layer upon which the traction boundary conditions are enforced. Since the continuum body is moving in an arbitrary computational mesh, all the boundary conditions are carried by the boundary particles. If only one boundary particle is located in a cell, the cell boundary becomes a part of the continuum boundary, and the cell size represents the thickness of boundary layer. If both boundary and interior particles of the continuum are located in a cell, this cell becomes a mixed one. However, the mixed cell is still treated as a boundary cell. In other words, the interior particles temporarily become boundary ones. To avoid numerical errors, therefore, small cells must be used to contain only boundary particles if possible, and the boundary conditions are enforced in each time step. It can be noted from eq. 3.5 that the interactions between different material points are reflected only through the gradient terms. In MPM, a background computational mesh is used to calculate the gradient terms. The computational mesh is constructed using 2-node cells for 1-D, 4-node cells for 2-D, and 8-node cells for 3-D problems. These elements are used to define the standard nodal basis functions, Ni (x), associated with the spatial nodes xi (t), i = 1, 2, . . . , Nn , where Nn represents the total number of mesh nodes. The nodal basis functions are assembled by using the conventional finite-element shape functions (Chen and
Numerical modelling of granular flow
56
Brannon, 2002). The coordinates of any material point in a cell can be represented by Nn
xtp = ∑ xti Ni (xtp ) .
(3.6)
i=1
Similarly the nodal displacements, velocity and acceleration of any material point in a cell are represented using the basis functions. Thus, the test function must be of the form Nn
wtp = ∑ wti Ni (wtp ) .
(3.7)
i=1
Equations (3.6) and (3.7) ensure that the associated vectors are continuous across the cell boundary. However, the gradient of these functions is not continuous, due to the use of linear shape functions. Substituting eq. 3.6 and eq. 3.7 into eq. 3.5, the weak form of the equation of motion reduces to Nn
+ fext,t , ∑ mtijatj = fint,t i i
(3.8)
j=1
where the nodal mass, mtij , is represented as Np
mtij
=
∑ m pNi(xt )Nj(xt ) .
(3.9)
p=1
The nodal internal force, fint,t and the nodal external force, fext,t are defined as i i Np
fint,t = − ∑ m p Gtip · σ ps,t , i p=1
fext,t i
Np
Np
=−∑
m p btp Ni (xtp ) +
p=1
∑ m pNi(xtp)τ ps,t h−1 ,
(3.10)
p=1
where Gtip = ∆Ni (x)|x=X tp . The nodal accelerations are obtained by explicit time integration of eq. 3.8. To obtain stable solutions, the time step used in the analysis should be less than the critical time step, which is defined as the ratio of the smallest cell size to the wave speed (Chen and Brannon, 2002). The critical time increment is obtained as ∆tcrit = L/c , c=
4 3G
K+ ρs
,
(3.11) (3.12)
3.3 Material Point Method (MPM)
57
where L is the background cell size, c is the pressure wave velocity, K and G are the bulk modulus and the shear modulus of the solid and ρs is the density of the soil skeleton. The boundary conditions are enforced on the cell nodes, and the nodal velocities are obtained by solving the equation of motion at each node. The strain increment for each material point is determined using the gradients of the nodal basis functions. The corresponding stress increments are computed using the adopted constitutive law. After updating all the material points, the computational mesh is discarded, and a new mesh is defined for the next time step.
3.3.2
Boundary conditions
The Material Point Method uses standard shape functions, similar to those used in the Finite Element Methods. Therefore the essential and the natural boundary conditions can be applied to the background grid nodes in the same way as in the traditional FEM. The free surface boundary conditions are satisfied, as the MPM is formulated in the weak form. Implementation of traction boundary conditions requires a set of material points to represent the boundary layer. Bandara (2013) proposed a friction interaction for the planar boundary condition using Coulomb’s friction criterion. The friction boundary algorithm for the solid phase adopted in the present study is shown in algorithm 1. The friction boundary conditions are applied on the mesh nodes by controlling the nodal acceleration tangential to the boundary. The nodal accelerations are considered to include the frictional effects instead of the forces, as the forces are proportional to the corresponding accelerations. Both static and kinetic friction are considered, and applied only when the particles are in contact with the boundary. The static and kinematic frictions are applied in the direction tangential to the nodal boundary. Friction forces are applied only if the particles are in contact. The normal velocity and acceleration on the boundary plane is zero. Displacement boundary conditions are applied as velocity constraints on the nodes in the background mesh.
3.3.3
Integration scheme
Love and Sulsky (2006) investigated the energy consistency of MPM and observed that the MPM algorithm is better suited to flow calculations than the Lagrangian finite element method. The energy-consistent MPM formulation is effective in simulating materials that exhibit localised dissipative mechanisms. In dynamic MPM, an explicit time integration scheme is adopted to advance the solution. Bardenhagen (2002) studied the energy consistency of MPM using two different explicit integration schemes. The update stress first (USF) scheme involves updating the strain and the stress at the beginning of the time step from the velocities
Numerical modelling of granular flow
58
Algorithm 1 Friction boundary algorithm for solid phase in MPM (Bandara, 2013). if ak+1 sI,t < 0.0 then = vksI + ∆ak+1 vk+1,tmp sI,t sI,t k+1,tmp if vsI,t = 0 then k+1 k+1 if asI,t ≤ µs asI,n then
▷ static friction condition
ak+1 sI,t = 0. else
▷ friction acts in the direction opposite to the tangential force k+1 k+1 asI,t k+1 ak+1 = a − µ a s sI,n ak+1 sI,t sI,t | sI,n | end if else ▷ kinetic friction condition k+1 if vk+1 ≤ µ a ∆t then k sI,n sI,t ak+1 sI,t = − else
vksI,t ∆t
k+1 k+1 a = a − µ ak+1 k sI,n sI,t sI,t
▷ friction acts in the direction opposite to movement vk+1 sI,t
|vk+1 sI,n |
end if end if end if of the previous time step. In the update stress last (USL) approach, the updated particle momentums are used to calculate the nodal velocities, which are then used to update the particle strain and stress. Bardenhagen (2002) observed that the USL approach performed better than the USF. The USL approach dissipates the energy slowly, while the USF approach is found to gain energy (Kafaji, 2013). The USL approach yields almost the same result as using the central difference scheme that is second order in time (Wallstedt and Guilkey, 2008). The update stress last approach is used in the present study due to its dissipative nature, which is useful in modelling granular flow problems and numerical stability. In problems involving a slow rate of loading, i.e. quasi-static problems, the flow of the material is much slower than the speed of wave propagation in the material. Hence, employing an implicit time integration scheme reduces the computational time considerably (Kafaji, 2013). Guilkey and Weiss (2003) proposed an implicit time integration method for MPM using quasi-static governing equations and the Newmark integration scheme. Love and Sulsky (2006) showed that implicit time integration in MPM is unconditionally stable. Although, MPM does not suffer from the limitations of FEM in simulating large deformations, more research is required for applying implicit time integration for large deformation problems. The present study focuses on large deformation problems, hence an explicit time integration scheme with the USL approach is adopted.
3.3 Material Point Method (MPM)
3.3.4
59
Solution scheme
In the present study a template-based three-dimensional C++11 Material Point Method code, developed at the University of Cambridge (Bandara, 2013), is modified and extended to study granular flow problems. The three-dimensional MPM code is parallelised to run on multi-core systems, thus improving the computational efficiency. The algorithm of the MPM code is improved to handle multi-body dynamics and interactions. A step-by-step solution scheme for the Material Point Method implemented in the present study is described below: • A continuum body is discretised into a finite set of material points corresponding to the original configuration of the body. The number of material points corresponds to the resolution of the mesh size adopted in the Finite Element Method. The material points are followed throughout the deformation of the material, which is a Lagrangian description of the motion. • An arbitrary computational grid is initialised to describe the natural coordinates of the material points. For the purpose of simplicity, a Cartesian grid is usually adopted. • The state variables (mass/density, velocity, strain, stress, other material parameters corresponding to the adopted constitutive relation) are initialised at every material point. t (x ) and the gradient of the shape function Gt for each material • The shape function Nip p ip point are computed.
• The information and properties carried by each material point are projected onto the background mesh using the shape functions computed from the particle position. • The nodal mass matrix is obtained as Np
mti
=
∑ mpNipt (xtp) ,
(3.13)
p=1
where mti is the mass at node i at time t, mp is the particle mass, Ni is the shape function associated with node i, and xpt is the location of the particle at time t. • The nodal velocity is obtained by mapping the particle velocity onto the nodes using the shape functions. If necessary, the boundary conditions for the nodal velocities are applied. Np
vti =
∑ mpvtpNipt (xtp)/mti .
p=1
(3.14)
Numerical modelling of granular flow
60
• The momentum balance equation for the solid phase is solved, and the nodal acceleration is computed as ati =
1 mti
Np
− ∑ Gtip σ pt Ωtp + p=1
Np
!
∑ mtpbtpNipt (xtp)
.
(3.15)
p=1
If necessary, the boundary conditions for the nodal accelerations are applied. • The nodal velocity at the end of the Lagrangian time step (L) is obtained from the computed nodal acceleration as vLi = vti + ati ∆t .
(3.16)
where ∆t = (t + 1) − t. • The particle position and its velocity are updated according to Nn
t L t xt+1 p = xp + ∆t ∑ vi Nip , i=1 Nn
t t t vt+1 p = vp + ∆t ∑ ai Nip .
(3.17)
i=1
• The strain increment ∆ε pt+1 for the particle is then computed as ∆ε pt+1
∆t Nn t t = Gip vi + (Gtip vti )T . ∑ 2 i=1
(3.18)
• The stress increment for the particle ∆σpt+1 is computed from the strain increment using the constitutive model adopted in the simulation ∆σpt+1 = D : ∆ε pt+1 .
(3.19)
In large deformation problems, the Jaumann rate is used to update the effective stress of the solid particles � σ pt+1 = ∆t σ pt − Wtp − Wtp σ pt x + D : ∆ε pt+1 , Nn h �T i . Wtp = ∑ Gtip vti − Gtip vti i=1
(3.20) (3.21)
3.3 Material Point Method (MPM)
61
• The stress and the strain of the material points are updated based on σpt+1 = σpt + ∆σpt+1 , ε pt+1 = ε pt + ∆ε pt+1 .
(3.22)
• In large deformations, the volume of the solid material points Ω p is updated using the determinant J of the deformation gradient Ft+1 p t0 Ωt+1 p = JΩ p .
(3.23)
• The material point density is then updated as ρ pt+1 =
ρ pt {1 + tr(∆ε pt+1 )}
.
(3.24)
• At the end of every time step, all the variables on the grid nodes are initialised to zero. The material points carry all the information about the solution, and the computational grid is re-initialised for the next step. Figure 3.4 illustrates the steps involved in a MPM analysis. Post-processing The post-processing stage, as in most analysis, involves visualization and extraction of the data from the analysis. In mesh-less methods, like MPM, structures are generally represented as points which describe a discrete region of the body. MPM facilitates representation of arbitrarily complex geometries and has advantages over strictly grid-based methods, especially in simulations involving large deformations (Bardenhagen et al., 2000). However, MPM poses a whole new set of visualization problems. It is essential to visualise the general configuration of the body as well as observe the finer details like the development of cracks or separation of chunks of material from the body. The body is discretised into conceptual material points, which carry all the relevant information of the corresponding segment. The unique qualities of MPM necessitate the need to visualise the particle data in a way that is informative and appropriate. In MPM, the particle data represent the finite portion of a larger continuum, and the ability to see and interpret the macroscopic structure created by these particles is vital (Bigler et al., 2006). There are two main aspects in visualizing MPM data: (1) visualization of
Numerical modelling of granular flow
62
particle to node
nodal solution
update particles
node to particle
Figure 3.4 Illustration of the MPM algorithm (1) A representation of material points overlaid on a computational grid. Arrows represent material point state vectors (mass, volume, velocity, etc.) being projected to the nodes of the computational grid. (2) The equations of motion are solved onto the nodes, resulting in updated nodal velocities and positions. (3) The updated nodal kinematics are interpolated back to the material points. (4) The state of the material points is updated, and the computational grid is reset.
3.3 Material Point Method (MPM)
63
the structure represented by the material points and (2) understanding the qualitative trends associated with the material points like mass, velocity or stress. The MPM output data contain both the material point and the grid data, and one approach in visualizing MPM data is to render the interpolated particle values on grid nodes using the iso-surfacing (Lorensen and Cline, 1987) or volume rendering (Levoy, 1988). In regions where the material points are sparse, it is necessary that the grid resolution is sufficiently fine to compensate for the missing features. This results in storing a large amount of unnecessary data in regions where sufficient material points are present. Thus, it is advantageous to visualise MPM data of the material points as particles (Bigler et al., 2006). Particle visualization involves rendering the particles as a spheres or an ellipsoids representing the size and location of the fraction of the continuum (Gumhold, 2003; Krogh et al., 1997; Kuester et al., 2001). In the present study, MPM data points are represented as spheres. Colour mapping of scalar quantities, such as mass, velocity, or stress, of a material point are applied to provide additional qualitative understanding of the data.
3.3.5
GIMP method
The shape functions used in MPM are continuous, and hence penetrations between bodies are handled automatically without the need for any supplemental contact algorithm (Chen and Brannon, 2002). In MPM, the continuum body deforms and moves in an arbitrary computation grid. All boundary conditions are carried by the boundary particles. If a boundary particle is present in a cell, then the cell boundary becomes a part of the continuum body, and the cell size represents the thickness of the boundary. In certain cases, however, both the boundary particle and an interior particle can be found in a cell. In such cases, the cell is still treated as a boundary cell, and the interior particle temporarily acts as a boundary particle. To avoid numerical errors, it is essential to use a smaller cell size along the boundary (Chen and Brannon, 2002). In MPM simulations, numerical noise is observed when material points cross the cell boundaries as the body deforms. The noise is termed cell crossing noise. If a material point is located very close to the cell boundary. Then the results is a discontinuous gradient of the weighing function causing a force imbalance on the grid (Bardenhagen and Kober, 2004). This results in large, non-physical acceleration values causing separation of material points from the continuum (Sulsky et al., 1995). Figure 3.5 illustrates the problem of cell crossing noise. The main reason for the occurrence of cell crossing noise is the use of piecewise linear shape functions. However, this problem, which is predominant when using fine mesh size, can be overcome by changing the order of arithmetic operation, as proposed by Sulsky et al. (1995).
64
Numerical modelling of granular flow
Figure 3.5 Schematic description of the occurrence of cell crossing noise in MPM.
3.3 Material Point Method (MPM)
65
To overcome the problem of cell crossing noise, Bardenhagen and Kober (2004) proposed an alternate method called the Generalised Interpolation Material Point Method that uses smoother shape functions and a larger influence region for each grid node. This approach minimises the cell crossing noise. The piecewise-linear grid basis functions used are written as 1 − |x| /h : |x| < h ¯ φ (x) = (3.25) 0 : otherwise , where h is the grid spacing. The basis function associated with grid node i at position xi is then φ¯i = φ¯ (x − xi ). The basis functions in 3-D are separable functions constructed as φ¯i (x) = φ¯ix (x)φ¯iy (y)φ¯iz (z). GIMP is often implemented using the standard piecewise-linear grid basis functions and piecewise-constant particle characteristic functions: 1 : |x| < 21 l p (3.26) χp = 0 : otherwise , in which case the 1-D MPM and GIMP weighting functions can be grouped together in the general form 1 − (4x2 + l 2p )/(4hl p ) 1 − |x| /h ¯ �2 φ= � lp h + 2 − |x| /(2hl p ) 0
lp 2
:
|x|
0, the two grains are not in contact, and there is no interaction. When δn < 0, the two grains overlap, and there is a repulsive normal force that pushes the two grains apart. As a simple model, consider the contact as a linear spring with damping. The repulsive force depends linearly on δn and is controlled by the stiffness of the grain. The energy dissipation due to the interaction between grains is an intrinsic characteristic of the granular material and is incorporated by adding a damping force that opposes the relative velocity for the duration of the contact. The interaction force at the contact is idealised as a simple spring-dashpot system, with elastic and dissipative constants (Luding et al., 1994). 0, δn > 0 (3.35) Fn = −kn δn − γn dδn , δn < 0 dt
The constant kn characterises the stiffness of the grain and must be chosen to be sufficiently large so that the overlap between the grains remains small. Nevertheless, the solution has an undesirable property of generating an attractive force (Poschel and Schwager, 2005). It arises just before the two grains separate. In this case, we have dδn /dt > 0 while δn approaches zero. To avoid the attractive force, the force is computed in two stages: a candidate force Fˆn is calculated and verified as to whether it is non-negative 0, Fˆ ≤ 0 dδn Fˆn = −kn δn − γn , Fn = Fˆn , Fˆ > 0 dt
(3.36)
For pairwise collisions, the normal force (Fn ), represented as, kn δn + γn causes a decrease in the relative normal velocity of the grains by a factor ε. This factor is the coefficient of
78
Numerical modelling of granular flow
restitution and is defined as ε ≈ u′ /u, where u is the absolute normal relative velocity before the collision and u′ corresponds to the post-collision value. The relative velocity, dδn /dt > 0, can be obtained by differentiating eq. 3.34. Thus, we obtain dδn = (vi − vi ).n , dt
(3.37)
where vi = dxi /dt is the velocity of the grain i and vj = dxi /dt is the velocity of the grain j. The numerical integration of eq. 3.37 yields the separation δn and permits us to generalise the model so as to incorporate the tangential forces. By integrating Newton’s equation of motion, it is found that the linear force corresponds to the co-efficient of restitution, which is defined as r γn 2 πγn Y ). (3.38) ε = exp(− e f f / − 2m me f f 2me f f
Tangential force Grains are not perfect spheres, they have a complicated surface texture. Therefore, at oblique collisions, there is a tangential force in addition to a normal force. Even perfectly smooth spheres exert a tangential force due to their bulk viscosity (Poschel and Schwager, 2005). To build a heap of spheres on a flat surface, the grains as well as the surface have to be sufficiently rough, indicating the dependency of the tangential force on the surface properties of the granular materials. For realistic simulations of granular materials, it is important to consider the tangential force in DEM. The tangential force is considered in a similar fashion to the normal force, arising from a spring stretched by the relative motion of the grain. Tangential forces are modelled by considering the relevant relative tangential velocity of the grain surfaces at the point of contact. The point of contact is an approximation, as the description of the normal force assumes a compression δn , which implies a contact surface in 3-D or a contact line in 2-D. Assuming a tangential spring of length δt that exerts an opposing force to the relative tangential displacements (ignoring the effect of relative rolling between the grains), the tangential force can be postulated similar to the normal force (eq. 3.37) as dδt = (vi − vi ) × t . dt
(3.39)
As with eq. 3.28, this equation must also be numerically integrated. The grains are in contact when δt < 0, whereas when δt = 0, the grains no longer exert a force on each other. With these assumptions, δt can be calculated similar to the normal force. The tangential force is
3.5 Discrete Element Method
79
assumed to be governed by Coulomb’s friction law: |Ft | ≤ µFn ,
(3.40)
where Ft is the tangential force and µ is the friction coefficient. It is therefore necessary to constrain the tangential force to remain less than or equal to µFN . To impose the condition in eq. 3.40, two stages similar to the normal force computation are adopted. The first step is to evaluate the candidate force, and the force is then accepted if it obeys the condition in eq. 3.40. sgn(F ), Fˆ ≥ µF dδ t n t Fˆt = −kt δt − γt , Ft = (3.41) Fˆt , dt Fˆ < µFn where kt is the stiffness of the tangential spring and γt is the damping constant. If |Ft |= µFn , the contact is sliding; otherwise, it is non-sliding. It can be noted that the normal force (eq. 3.36) and the tangential force (eq. 3.41) are handled in the same way in DEM. When the grains slide against each other, they do not retain any memory of their initial position, and hence do not return to their original position. In order to model this behaviour, a limiting value of δt is imposed. When the contact slides, δt = ±µFn /kt is imposed. In addition to sliding, the grains can roll relative to one another around their centre of mass due to the tangential force acting at their contact surfaces. In which case, dδt /dt = 0. It is important to assume that the grains touch at a single point instead of overlapping, i.e. δn = 0. This point is located at xi − ri n = xj + rj n. If we consider that this point belongs to grain i, its velocity is vi + ri (ω × n). If it belongs to grain j, its velocity is vj + rj (ω × n). The relative velocity is the difference between these two velocities. dδt = (vi − vj ) · t − (ri ω i + rj ω j ) × n . dt
(3.42)
It should be noted that eq. 3.42 is only an approximation, as the grains in DEM do not touch at points, but overlap. It is therefore an approximation that produces an error of order O(δn /r) (Radjai and Dubois, 2011). It is assumed that the contact forces are exerted at the point of contact, which implies that the tangential force is accompanied by torque acting on two grains. If the overlap is zero, these torques are τij = −(ai n) × (Ft t) ,
(3.43)
τji = −(aj n) × (Ft t) .
(3.44)
Numerical modelling of granular flow
80
The torques modify the angular velocities of the grains. It is therefore necessary to incorporate the equation for the angular coordinates of the grains in eq. 3.28 Ij
dωi = ∑ τi j , dt j̸=i
(3.45)
where I j is the moment of inertia of grain j. Eq 3.44 is only valid when δn = 0. The torque is a vector product of the force and its lever arm. It is assumed that the lever arms have lengths equal to ri and rj , which is true only when the grains do not overlap. Hence in this case they produce an error of order O(δn /r). It is nevertheless desirable to damp this type of motion (Radjai and Dubois, 2011). A rolling resistance can be adopted in order to model the shape effect of non-spherical grains, which accounts for moments arising from the fact that the line of action of the normal contact force in the case of non-spherical particles no longer passes through the centre of mass of the particles and hence generates rotational moments. The interaction between two solid bodies is much more complex than that described by the simple linear model. Nevertheless, the linear force law has several advantages. It is simple to implement, and its harmonic behaviour is well-understood, which makes it easier to interpret the results. The most common non-linear interaction law is the Hertz law (Hertz, 1882). In certain situations, such as a quasi-static packing, a non-linear law can have significant influence on the acoustic properties and on the global stiffness (Agnolin and Roux, 2007). However, in the case of rapid granular flows, the interaction force between the grains has almost no effect on the phenomenon, and a linear law can be used to describe this kind of behaviour (Radjai and Dubois, 2011).
3.5.2
Numerical algorithm and integration scheme
The efficiency of a DEM algorithm is mainly determined by its efficiency for computing the interaction forces between grains. If we consider a model system with pairwise interactions, then we have to consider the contribution of the force on grain i due to all of its neighbours. If we consider only the interaction between a grain and the nearest image of another grain, then for a system of N grains, we must evaluate N × (N − 1)/2 pair distances. Consider a system of 1000 grains. At every time step, all possible pairs of grains have to be considered to compute the interaction forces, and hence, N(N − 1)/2 ≈ 500, 000 force computations are required. For short-range grain interactions, the majority of these force evaluations is unnecessary as the corresponding grains are located far apart and do not necessarily touch each other. For a dense system of equally sized grains, the grains can have contacts with not more than 6 grains, thereby reducing the number of force computations required to
3.5 Discrete Element Method
81
3N ≈ 3000. In the preliminary force computation scheme, at least 166 times more pair interactions are considered than necessary. Therefore, the numerical methods employed in the DEM should try to minimise the computation of interaction forces (Poschel and Schwager, 2005). There are three different methods for the efficient computation of the forces the Verlet algorithm, the link-cell algorithm, and a lattice algorithm. The Verlet algorithm described in Grubmuller et al. (1991) is implemented in the present study.
Verlet list algorithm The Verlet list algorithm assumes a cut-off value, so that only neighbouring grains that contribute to the energy of grain i are considered. It is advantageous to exclude the grains that do not interact in the memory-expensive energy computation. Verlet (1967) developed a book-keeping technique, commonly referred to as the Verlet list or neighbour list, which is illustrated in figure 3.10. In this method, a second cut-off radius rv > rc is introduced, and before the interactions are calculated, a list is made (the Verlet list) of all grains within a radius rv of the grain i. In the subsequent calculations of the interactions, only those grains in this list will be considered. The idea of the Verlet algorithm is based on a simple property of grain dynamics: the neighbourhood relation between grains can only change slowly, i.e. two grains which are close to each other at a given time step will remain as neighbours, at least in the following few time steps. During initialization, the neighbourhood relations between the grains, i.e. the distance of all close pairs of grains, are computed. Two grains are considered to be neighbours if the distance of their surfaces is smaller than a predefined distance, termed the Verlet distance → − ( − ri − → rj − Ri − Rj ) < Verlet distance . (3.46) For each grain, there is a Verlet list in which the close neighbours are saved. To initialise the Verlet lists efficiently, a grid that covers the simulation area is defined. Its mesh size is larger than the largest grain. For construction of the lists, only pairs whose grains reside in the same or adjacent grids are considered. This procedure guarantees the detection of all close pairs of grains (Poschel and Schwager, 2005). Redundancy in Verlet lists, i.e. if grain i is a neighbour of j, then grain j is a neighbour of i, is avoided by imposing a restriction on the list of grain i, such that it contains only neighbours with index j < i. For the computation of interaction forces, the Verlet list of grain i is scanned, and only pairs which are recorded in one of the Verlet lists are considered. Hence, the Verlet list of each grain i is scanned, and the interaction force of i with each entry j in its list is computed. Initially, to build the Verlet list, the grains are sorted into a grid of mesh size dx × dy. For each grid, there is a list of grains residing in the cell. During the simulation, the
82
Numerical modelling of granular flow
Figure 3.10 The Verlet list: a grain i interacts with those grains with the cut-off radius rc . The Verlet list contains all the grains within a sphere with radius rv>rc .
neighbourhood relation among the grains change; therefore, the Verlet lists have to be updated. The decision to update a Verlet list depends on how far the grains have travelled since the time when the present list was built. The Verlet list of a grain i must contain at any time all neighbours j with j < i. This assures that two grains i and j never touch and are not considered as neighbours, i.e. j is not in the list of i, and i is not in the list of j. Hence, − → → ri − − rj − Ri − Rj > 0 .
(3.47)
The above condition is required for all pairs (i, j) of grains which are not known as neighbours. This condition is a criterion to update the Verlet lists (Poschel and Schwager, 2005). Assume at the instant when the Verlet lists are constructed that the surfaces of the → → grains have the distance |− ri − − ri | − Ri − Rj > Verlet distance, i.e. they are not classified as neighbours. If the Verlet lists are updated before one of these grains has travelled the distance verletdistance/2 since the lists were constructed then they can never collide without being recognised as neighbours first. This is explained in figure 3.11. The impact of optimisation of the Verlet list algorithm has negligible effect on the computation time, as the algorithm is quite efficient already and only consumes a small percentage of the total computation time in construction of the Verlet lists. The implementation of the Verlet list algorithm in force computation drastically reduces the computation time in comparison to the linear algorithm. The performance of the Verlet list algorithm is controlled by two crucial parameters: the
3.5 Discrete Element Method
83
number of cells Nc , for the construction of the Verlet lists and the Verlet distance rv (Poschel and Schwager, 2005).
Figure 3.11 Checking the validity of Verlet lists. Left: the grains i and j are not recognised as neighbours since the distance of their surfaces is larger than the Verlet distance. The radius of the dashed circle is Ri + Rmax + Verlet distance. Right: in the most critical case the grains approach each other directly, travelling at the same velocity. As soon as one of the grains has travelled the distance Verlet distance/2 (arrows), the Verlet lists have to be rebuilt. The grains i and j are now recognised as neighbours. Redrawn from Poschel and Schwager (2005).
Leap frog, or Verlet integration algorithm The Discrete Element Method involves numerically solving Newton’s equation of motion eq. 3.28, which is an ordinary differential equation. Choosing an integration algorithm is important, as the forces are not always differentiable in time, and the temporary derivative of the force is discontinuous when the contact splits. It is also essential to numerically integrate eq. 3.42 with the same precision as eq. 3.28. At first, computational speed seems important. However, it is usually not very relevant because the fraction of time spent on integrating the equation of motions (as opposed to computing the interactions) is negligible. Accuracy for large time steps is more important because the larger the time step used, the fewer evaluations of the forces needed per unit of simulation time. Hence, it is advantageous to use a sophisticated algorithm that allows use of larger time step. Algorithms that allow the use of large time steps achieve efficiency by storing information on increasingly higher-order derivatives of the grain coordinates. Consequently, they tend to require more memory storage. However, the most important aspect to consider is the energy conservation. It is important to distinguish between two kinds of energy conservation: the
Numerical modelling of granular flow
84
short- term and the long-term. The sophisticated higher-order algorithms tend to have very good energy conservation for short times. However, they often have undesirable features that result in drifting of the overall energy for longer times. In contrast, the Verlet-style algorithms tend to have only moderate short-term energy conservation, but little long-term drift (Frenkel and Smit, 1996). In this case, such algorithms are not useful. They are more complicated to program, and they do not yield a more precise solution (Radjai and Dubois, 2011). It might be important to have an algorithm that accurately predicts the trajectories of all grains for both short and long durations, however no such algorithm exists. In certain cases, two trajectories that are initially very close may diverge exponentially as time progresses. Any integration error, however small it may be, will always diverge the predicted trajectory exponentially from the true trajectory. This phenomenon is called the Lyapunov instability, and it poses a serious threat to the fundamental basis of DEM simulations. However, this problem might not be serious (Frenkel and Smit, 1996). The aim of DEM is not to predict precisely what will happen to a system, but to predict the average behaviour of the system that is prepared in an initial state about which we know something (initial position, velocity and energy), but not everything. Hence, DEM differs from other methods, which are used to predict the trajectories. However, considerable numerical evidence suggests that the shadow orbits exists, which is a true trajectory of a multi-body system that closely follows the numerical trajectory for a time that is longer in comparison with the time that is required for the Lyapunov instability to develop (Frenkel and Smit, 1996). Because Newtons’s equations of motions are time-reversible, so too should the integration algorithms be time-reversible. The “leapfrog” algorithm, or the Verlet integration algorithm, is a numerical scheme used to integrate the Newton’s equation of motion to calculate the trajectories of grains and is implemented in DEM by Verlet (1967). The Verlet algorithm is fast and requires less storage memory. It is not particularly accurate for long time steps, and hence, we should expect to compute the forces on all grains rather frequently. Its short-term energy conservation is satisfied (in versions that use more accurate expression for velocity), but most importantly, it exhibits little long-term energy drifts. This is related to the fact that the Verlet algorithm is time-reversible and area preserving. However, it does not conserve the total energy of the system exactly (Frenkel and Smit, 1996). The Verlet algorithm is simply based on a truncated Taylor expansion of grain coordinates. t(t + ∆t) = rt + v(t)∆t +
f (t) 2 ∆t + . . . 2m
(3.48)
3.5 Discrete Element Method
85
If we truncate this expansion beyond the term ∆t 2 , we obtain Euler’s algorithm, which looks similar to the Verlet Algorithm, but it does not preserve energy and it has significant energy drifts. The simplest among the Verlet schemes is the Leap frog algorithm, which evaluates the velocities at half-integer time steps and uses these velocities to compute the new positions. The position of each grain is calculated at time t = 0, ∆t, 2∆t,. . . , where ∆t is the time step. On the other hand, their velocities are calculated at intermediate times, that is, at t = ∆t/2, 3∆t/2, . . . ,. Let the position of a grain at time t = k∆t be written as xk , and its velocity at time t = ∆t(k + 1/2) be written vk+1/2 , and its acceleration at t = k∆t be ak . Then the following equation is used to advance systematically vk+1/2 = vk−1/2 + ak ∆t,
(3.49)
xk+1 = xk + vk+1/2 ∆t
(3.50)
This algorithm determines the new grain position with an error of order O(∆t 4 ). But eq. 3.49 hides a difficulty in the application of this algorithm to granular materials (Radjai and Dubois, 2011). This difficulty is the calculation of acceleration at time t = k∆t. The velocities are known at t = (k − 1/2)∆t, but not at t = k∆t. One option for resolving this problem is to write vk = vk−1/2 + ak−1 ∆t/2 . (3.51) The equation uses the acceleration of the preceding time step to estimate the velocity. This approximation does not diminish the order of the algorithm. Eq 3.51 estimates vk with an error of order O(∆t 2 ), producing an error of the same order in the calculation of the force in eq. 3.49. But this causes only an error of order O(∆t 3 ) in the velocity and an error of order O(∆t 4 ) in the position. However, this problem does not exist in energy conservation systems, because the computed forces do not depend on the velocities of the grains. The heaviest computational task is the evaluation of forces, not the integration of equations. The Verlet integration scheme is summarised in eq. 3.52 and figure 3.12. To calculate the forces and acceleration, it requires the positions and velocities at time t: v(t + ∆t/2) = v(t − ∆t/2) + a(t)∆t , x(t + ∆t) = x(t) + v(t + ∆/2)∆t , v(t) = v(t − ∆t/2) + a(t − ∆t)∆t/2 .
(3.52)
The analysis of the DEM formulation reveals that the linear force law gives the model a harmonic character, showing that it is very closely related to simple models widely applied in physics and mechanics. The shortest time scales often arise from the oscillations of one or
Numerical modelling of granular flow
86
Figure 3.12 Illustration of the Verlet integration scheme.
two grains. The integration algorithm must resolve these movements with sufficient precision. Thus, the time steps used must be smaller than these time scales; the most rapid frequency is usually ωN , the characteristic oscillation frequency of very short waves. This frequency is proportional to ωo , which is easier to estimate. Therefore, it is essential to choose a time step ∆t ≈ ε/ω0 , where ε is a constant that depends on the integration algorithm. Values such as ε ≈ 0.01 are often a reasonable choice (Radjai and Dubois, 2011). In the case of rapid granular flows, the time step must be small enough so that the fastest grains move only by a small fraction of their size during one time step. The grains must be stiff enough so that violent collisions do not lead to large overlaps between grains.
3.5.3
Boundary conditions
In many cases, the dynamic and static properties of a granular system are substantially affected by the interaction of the granular material within the system boundaries, i.e. by the properties of the container or the surface on which the material is present. The effect of boundary conditions on the response of the granular assembly can be noticed in the convective motion of granular material in vibrating containers, the formation of density waves in pipes, the motion of granular material on conveyors, and the clogging of hoppers. In these and many other cases, careful definition of the interaction between the granular material and the contact surface is essential. Of particular importance is the realistic modelling of the wall surface roughness. Unfortunately, the mechanical interaction of granular materials with a rough wall is poorly understood (Poschel and Schwager, 2005). A simple way to define the wall property is to build up the wall from grains which obey the same rules of interaction as the grains of granular material. By varying the size and position of the wall grains, system boundaries of adjustable roughness can be described. However, the surface roughness that characterises the frictional properties of the wall has to be derived iteratively and may not represent the real conditions. In the present case, a solid wall with corresponding stiffness, damping and frictional characteristics is introduced to model the interaction between grains and the wall. The interaction force is computed in a similar fashion to that of a pair of grains in contact and is divided into the normal and tangential components. The compression of the grain upon collision with the wall is calculated along the normal direction to the wall and the grain contact.
3.5 Discrete Element Method
87
Periodic boundary The effect of a wall on the response of grains is very critical, especially in numerical simulations where the number of grains is relatively fewer in comparison to the number of grains in experimental conditions. The undesired effect of a wall can be eliminated using periodic boundary conditions, i.e. a periodic extension of the simulation area in one or more dimensions. Any grain leaving the system at one side is reintroduced at the opposite side, and correspondingly, the interaction forces between grains at opposite sides of the simulation area are taken into account. In this framework, the simulation domain becomes a unit area containing grains with periodic copies paving the whole system. The periodic boundary conditions extend the system boundaries to infinity, so that the simulation cell simply plays the role of a coordinate system for locating grain positions (see figure 3.13). The external stresses or displacements are applied on the simulation box by constraining the degrees of freedom of the wall, which are alternatively kept free or fixed depending on whether a stress or a displacement is monitored in a system. With periodic boundary conditions, this role is played by the collective degrees of freedom carried by the coordinate system, whose basis vectors become dynamic variables. Their conjugate stresses are expressed as a state function of the granular configuration (Parrinello and Rahman, 1980). In the case of granular systems, there is dissipation of energy during grain interactions. The kinematics, equation of dynamics, and the time-stepping schemes for DEM are discussed in detail by Radjai et al. (2011). The periodicity in position implemented in the present study is discussed below.
Figure 3.13 A 2D simulation cell ω with its basis vectors in an absolute frame. A grain located at the right boundary interacts with the image of another grain located at the left boundary.
Consider a collection of N p grains with their centres contained in a cell of volume V. The cell can have any shape allowing for a periodic tessellation of space. The simplest shape is a parallelepiped, i.e. parallelogram in 2D. The cell and its replicas define a regular
Numerical modelling of granular flow
88
→ → lattice characterised by its basis vectors (− a1 , − a2 ). In the case of a parallelogram, the basis vectors may simply be the two sides of the parallelogram: figure 3.13. The origin O of the simulation cell is a vertex of the cell of coordinates (0, 0) and its replicas are defined by two → → indices (i1 , i2 ) corresponding to a translation of the origin by the vector i1 − a1 + i1 − a2 . Then, − → − → the coordinates r (i) of the image i′ of a grain i ∈ Ω of coordinates r (i′ ) are given by: 2
− → → → r (i′ ) = − r (i) + ∑ ik − a k.
(3.53)
k=1
The grains belonging to the cell Ω, characterised by i1 = i2 = 0, can interact with the grains of the same cell but also with image grains in the neighbouring cells characterised by ik ∈ 1, 1. There are 3D − 1 cells surrounding the simulation cell, and they are involved in the search of contact partners for each grain. The distance between two grains i and j ∈ Ω is the shortest distance separating i from j or from one of its images j′ . As the system evolves in time, a grain i may leave, but one of its images i′ enters at the same moment. In order to keep all original grains in the cell, the status “original” should be reserved to the grains whose centres belong to Ω. Hence, whenever a grain i leaves the simulation cell, it becomes an image of i′ , which then becomes the original. This means that a grain crossing a border of the simulation cell returns to the cell by crossing another border.
3.5.4
Validation of DEM
It is essential to validate the developed DEM code. In the present study, a preliminary validation of the DEM code is performed by studying a ball rolling down an inclined plane. O’Sullivan et al. (2003) showed that the validation of DEM code using the above problem confirms the appropriate implementation of the shear contact model in DEM. The theoretical solution for a ball rolling down an inclined plane is derived by Ke and Bray (1995). A disk is resting on a rigid inclined plane oriented at an angle β = 45° to the horizontal plane (figure 3.14a). The disk has a radius r of 1m and a density of 2650 kg/m3 . The friction angle φ between the disk and the rigid plane is varied. The disk rolls/slides down the plane due to gravity. The DEM solution for the sliding case (φ = 0°) is compared with the theoretical solution by Ke and Bray (1995). The normal force, shear force, angular rotation, accelerations a¨ and angular acceleration θ¨ are compared with the theoretical solution (table 3.1). The accumulation of disk rotation at time t = 0.2 s versus the friction angle is presented in figure 3.14b. The angular rotation observed in the DEM matches the theoretical solution, which validates the shear contact model. The DEM model implemented
3.5 Discrete Element Method
89
in the present study is further validated by comparing it with the granular column collapse simulations performed by Zenit (2005) and using PFC2D (Itasca PFC2D, 1998). Table 3.1 Comparison of theoretical and DEM results for a disk on an inclined plane of 45°.
φ = 0° (sliding) N = N/(mg cos β ) S = S/(mg) a/g ¨ Theoretical (Ke and Bray, 1995) 1.000 0.000 0.7071 DEM 1.000 0.000 0.7071
3.5.5
θ¨ /g 0.000 0.000
Cumulative β distribution
For a DEM analysis, the sample must be representative of the grain properties, including the particle size distribution (PSD) both in volume (mainly for the smallest particles) and in number (for the largest particles). This representativeness of PSD is a condition for a sample to be a representative volume element. However, this condition cannot be satisfied in the DEM for a poly-disperse sample, due to the upper limit on the computation capacity. It is important to extract a discrete ensemble of grain sizes such that a statistical representation of the size classes is obtained (Radjai and Dubois, 2011). The β distribution in its cumulative form is able to satisfactorily model the size span (ratio of the largest to the smallest grain) and the shape descriptor (relative weights of the maximum and the minimum grain sizes). The cumulative β distribution (Voivret et al., 2007) is defined as Zx 1 t a−1 (1 − t)b−1 dt , (3.54) β (x, a, b) = B(a, b) 0
where a > 0 and b > 0 are the two parameters of the distribution. The B(a,b) function is given by Γ(a)Γ(b) B(a, b) = , (3.55) Γ(a + b) where Γ is the gamma function defined by Γ(x) =
Z∞
t x−1 e−t dt .
(3.56)
0
The cumulative β (CB) distribution is defined and normalised in the interval [0,1] with β (0) = 0 and β (1) = 1. To represent the grading curve of grain size range [dmin , dmax ] with
Numerical modelling of granular flow
90
mg
a N
(a) Layout
Accumulated rotation (radians)
1
0.8
0.6 Theoretical Solution (Ke & Bray, 1995) DEM
0.4
0.2
0
0
20
40 60 Angle of friciton (degree)
80
(b) Accumulated disk rotation at t = 0.2 s versus friction angle (β =45°). Figure 3.14 Validation of DEM using a disk rolling down an inclined plane.
100
3.5 Discrete Element Method
91
CB, the argument x is replaced by the reduced diameter dr dr (d) =
d − dmin , dmax − dmin
(3.57)
which varies in the range of [0,1]. The model grading curve h(d) is given by the CD distribution in terms of the reduced diameters as h(d, a, b) = β (dr (d); a, b) .
(3.58)
The parameters a and b of the CB model allow the shape descriptor h(d) to vary easily. The size span is characterised by the ratio r = dmax /dmin . The size span can also be defined as dmax − dmin s= . (3.59) dmax + dmin A value of s = 0 indicates a strictly mono-disperse grain size, and a value of s = 1 indicates an infinitely poly-disperse grain size distribution. Voivret et al. (2007) observed a well-graded particle size distribution for a > 1 and b > 1. In the present study, a value of a = 4 and b = 4 is adopted to obtain a well graded curve. In the present study, samples with different poly-dispersity r = 1.5, 1.8, 2 and 6 are used. Figure 4.1 shows a poly-disperse sample r = 1.5 generated by the CB method, for a = 4 and b = 4. The PSD curve of the generated sample is also presented.
3.5.6
Particle assembling methods
In order to simulate a granular assembly, it is essential to assign an initial position and velocity to all the grains in the system. Particle positions should be chosen to be compatible with the structure (granular fabric) one is attempting to simulate. In any event, the grains should not be positioned such that there is an appreciable overlap between grains. In order to achieve the initial position of the grains, various grain-assembling methods can be adopted. The grain-assembling methods can be classified into two broad categories: dynamic methods and geometrical approaches. The dynamic approach involves the packing of grains using laws of mechanics and contacts, while the geometrical method involves the packing of grains in accordance with grain size, shape and position. In general, the packing of grains can be categorised into two types: crystal/lattice packing, like hexagonal or square patterns of mono-disperse grains, and random packing with varying density employing mono-disperse or poly-disperse grains. The crystalline packing arrangements, such as hexagon and square lattices, are easier to generate, but they have non-trivial effects on the response of the
92
Numerical modelling of granular flow
granular system (Staron et al., 2005). Hexagonal packing is the densest possible arrangement for mono-dispersed spherical grains. In 2D, the packing of mono-dispersed circles on a hexagonal lattice yields a packing density, defined as the ratio of volume of solids to the total √ volume (Vs /V ), of ηh = 16 π 3 ≈ 0.9068 The rheology of a granular material is controlled by the geometry of the assembly, which includes the grain shape, size distribution, and arrangement. This prevailing role of geometry sometimes permits the simplification of the dynamics in favour of a better description of the geometry and/or higher numerical efficiency (Radjai and Dubois, 2011). For example, dense granular packing may be efficiently constructed by replacing the equations of dynamics by simple displacement rules satisfying the geometrical constraints. Purely geometrical procedures can be much simpler and numerically faster than dynamic or quasistatic methods. Contrary to dynamic simulation methods, the geometrical methods allow for quicker assembling of a large number of grains. Such packing may then be used as the initial state for dynamic simulations. The issue of concern with assembling methods is to construct configurations of grains as close as possible to a state of mechanical equilibrium with built-in packing properties. This state can be a target packing density for a given grain size distribution. In the same way, the average connectivity of the grains (coordination number) and the anisotropy of the contact network are basic geometrical properties. The coordination number represents the mechanical response of packing. The homogeneity of the grain assembly in terms of packing fraction and connectivity is another important property, which depends on the assembling rules. In the present study, the initial grain packing is obtained using the ballistic deposition technique. Ballistic deposition Initially, a random arrangement of grains which do not touch each other is generated. The radii of the grains are chosen from the interval of (Rmin , Rmax ) in such a way that the total mass of all grains from a certain size interval is the same for all sizes, thus ensuring that neither larger nor smaller grains dominate the system. The grains are arranged randomly on a regular lattice. In the second step, the grains arranged in a regular lattice are allowed to fall down, maintaining a constant potential head between layers of grains (figure 3.15). The construction of the packing proceeds layer by layer from the substrate. For this reason, the deposition model is also known as bottom-to-top restructuring model. In 2D, two contacts are sufficient to balance a grain if its centre of gravity lies between the two contacts. This configuration corresponds to a position of local stable equilibrium. In this method, the order of deposited grains is generally random and independent of their sizes. The mechanically stable sample obtained from this method is presented in figure 3.16. Dense
3.5 Discrete Element Method
Figure 3.15 Generation of a poly-disperse sample using ballistic deposition technique.
93
Numerical modelling of granular flow
94
granular samples are prepared an initial friction angle of zero. Zero frictional resistance ensures the densest possible packing. The friction angle is used during the analysis. To generate a dense sample, the sample is subjected to vibrations at varying frequencies.
Figure 3.16 A poly-disperse DEM sample generated using ballistic deposition technique.
Although there is no optimum specimen generation technique (O’Sullivan, 2011), there is a need to assess the homogeneity of the packing density generated (Jiang et al., 2003). The homogeneity of the sample is assessed by measuring the void-ratio within sub-volumes. The generated specimen is discretised into horizontal bands of 2.5d50 . The homogeneity of the packing is calculated by the variance S in the void ratio. S=
1 Nlayer − 1
Nlayer
∑ (e − ei)2 ,
(3.60)
i=1
where Nlayer is the number of layers and e is the overall void ratio. A variance S of 2.74% is observed, which is less than 5%, indicating a homogeneous sample (Jiang et al., 2003).
3.5.7
Voronoi tessellation
In order to extract bulk properties, such as packing density, stresses and strains, from a DEM simulation, it is important to quantify the granular texture. A useful geometrical
3.5 Discrete Element Method
95
representation of granular texture consists of dividing the space occupied by the particles into contiguous cells. This procedure is called ‘tessellation’. Voronoi tessellation is one of the mostly commonly used techniques. For a finite set of points p1 , . . . , pn in the Euclidean space, the domain/plane is discretised into convex polygons such that each polygon contains exactly one point, pi and every point in a given polygon is closer to its generating point pi than to any other. The inverse of the Voronoi tessellation is the Delaunay triangulation. In the present study, the Fortune (1992) sweep line algorithm is implemented to tessellate the region surrounding each grain in the geometry. Once each grain has a corresponding area, the macroscopic properties, such as the bulk density and stresses, can be extracted from micro-mechanical properties, such as the local packing density and force chains. The Fortune sweep line algorithm involves a sweep line and a beach line, both of which move through the plane from left to right as the algorithm progresses. The sweep line is a straight line which moves from left to right across the plane. At any time during the algorithm, the points (grains) to the left of the sweep line will be incorporated into a Voronoi cell. The points on the right of the sweep line are yet to be considered. The beach line is a complex curve, composed of pieces of parabolas that divide the plane within which the Voronoi diagram is known. As the sweep line crosses a point, a parabola evolves from the generating point. As the sweep line progresses, the vertices of the beach line, at which two parabolas cross, trace out the edges of the Voronoi diagram. The beach line progresses by keeping each parabola base exactly halfway between the points initially swept over with the sweep line and the new position of the sweep line. Figure 3.17 shows the Fortune sweep line algorithm in progress. A modified version of the sweep-line algorithm is used to construct an additively weighted Voronoi diagram, in which the distance to each site (grain) is offset by the weight of the site, i.e. the radius of the grain. The Voronoi tessellation is used to study the evolution of packing fraction during the collapse of a granular column. Figure 3.18a shows the Voronoi tessellation of the run-out for a granular column with an initial aspect ratio of 6 at time t = 3τc . The distribution of local packing density for the run-out is shown in figure 3.18b. Dark regions represent dense packing, while loose regions are shown in white. The run-out at this stage has a bulk packing density of 81.23%. It is difficult to tessellate the free surface, and the Voronoi cells on the free surface do not represent the actual packing density. Hence, during the evaluation of the macroscopic density, the packing density of surface grains that are larger than a threshold value are ignored. Voronoi Tessellation is a useful tool to extract continuum properties from DEM simulations. In the present study, the Voronoi tessellation is used to understand the evolution of packing density and entrainment of water in the flow front (due to hydroplaning) in granular flows.
96
Numerical modelling of granular flow
Figure 3.17 Fortune sweep line algorithm for generating Voronoi Tessellation. Generated from http://www.diku.dk/hjemmesider/studerende/duff/Fortune/.
(a) Illustration of Voronoi Tessellation.
(b) Local packing density (dark - dense and light - loose). Figure 3.18 Voronoi tessellation of a run-out profile showing the local packing density.
3.6 Summary
3.6
97
Summary
A plane-strain Material Point Method is implemented in the present study to describe the continuum response of granular flows. When a material points moves from one cell to another, it results in numerical oscillations called the cell-crossing noise. The Generalised Interpolation Material Point (GIMP) method is adopted to minimise these oscillations in largedeformation problems. The grain-scale response is captured using a two-dimensional DEM code. The discrete grains are generated using a cumulative β distribution, which mimics the particle size distribution curves. The sample is generated using the ballistic deposition technique, and the homogeneity of the generated sample is verified by investigating the variance in the void-ratio at different layers. A sweep-line Voronoi tessellation approach is adopted to extract macroscopic parameters, such as stresses and packing density, from micro-scale properties, such as the local packing fraction. These multi-scale tools are used to understand the rheophysics of dry granular flows and to evaluate the suitability of MPM as a continuum approach in modelling granular flow behaviour.
Chapter 4 Multi-scale modelling of dry granular flows 4.1
Introduction
In nature, instabilities of slopes or cliffs can manifest themselves in dramatic events involving the sudden release of a large mass of soil. The prediction of these catastrophic events presents several challenges, one difficulty being our incomplete understanding of granular flow dynamics (Rondon et al., 2011). Understanding the mechanics is of particular importance for risk assessment. Small scale laboratory experiments are usually unable to properly capture the dynamics of geophysical events. However, they can be useful to precisely study the physical mechanisms, which may play a crucial role in real flows (Iverson, 1997). Conventionally, granular materials such as soils are modelled as a continuum. On a macroscopic scale, granular materials exhibit many collective phenomena and the use of continuum mechanics to describe the macroscopic behaviour can be justified. However on a grain-scale, granular materials exhibit complex solid-like and/or fluid-like behaviour depending on how the grains interact with each other. Numerical studies at grain-scale allow a precise understanding of the internal flow structure. However, even in simplified geometries such as those investigated in the laboratory-scale experiments, DEM suffers from a serious short-coming in the number of grains that can be simulated in a reasonable time. This is a critical issue for more complex geometries or when granular processes which occur on a long time-scale are considered. For this reason, most numerical studies are performed in 2D or simple particles shapes and size distributions are considered. Classical modelling strategies based on the finite element method (FEM) cannot be used for the simulation of very large deformations due to mesh distortion effects. In various
100
Multi-scale modelling of dry granular flows
applications of FEM, this problem is treated by means of technical tools such as re-meshing. These methods are, however, not robust and lead to round-off errors and are sensitive to the mesh characteristics. Recent works on granular materials suggest that a continuum law may be incapable of revealing in-homogeneities at the grain-scale level, such as orientation of force chains, collapse of local voids and grain rearrangements, which are purely micro-structural effects (Rycroft et al., 2009b). Discrete element approaches are capable of simulating granular materials as discontinuous systems allowing one to probe into local variables such as position, velocities, contact forces, etc. The fundamental question is how to model granular materials which exhibit complex phenomena. It is important to understand the mechanics of granular flows and the ability and limitations of continuum methods in modelling the granular flow dynamics.
4.2
Granular column collapse
The collapse of a granular column, which mimics the collapse of a cliff, has been extensively studied in the case of dry granular material (Hogg, 2007; Kerswell, 2005; Lajeunesse et al., 2004; Lo et al., 2009; Lube et al., 2005; Staron and Hinch, 2007; Zenit, 2005). The granular column collapse experiment involves filling a rectangular channel of height H0 and width L0 with a granular material of mass m (figure 2.7). The granular column is then released en masse by quickly removing the gate, thus allowing the granular material to collapse onto a horizontal surface, forming a deposit having a final height H f and length L f . Despite the complexity of the intermediate flow dynamics, experimental investigations have shown that the flow evolution, the spreading velocity, the final extent of the deposit, and the energy dissipation can be scaled in a quantitative way independent of the substrate properties, grain size, density, the shape of the granular material and the released mass (Lajeunesse et al., 2005; Lube et al., 2005; Staron and Hinch, 2007). Granular collapse has also been studied using DEM, which allows precise measurement of the internal flow structure (Lo et al., 2009; Staron and Hinch, 2007; Staron et al., 2005; Utili et al., 2014). Power laws relating the final run-out and height to the initial aspect ratio (a = H0 /L0 ) of the column were observed. These findings immediately pose a question: are these simple scaling laws fortuitous, an oversimplification, or in fact indicative of a simple dynamical balance? Granular flows are conventionally modelled as a frictional dissipation process in continuum mechanics but the lack of influence of inter-particle friction on the energy dissipation and spreading dynamics (Lube et al., 2005) is surprising. However, Kerswell (2005) showed the run-out behaviour has a clear material dependence. Although, the collapse of a granular column on a horizontal surface is a simple case of granular flow, a proper model that describes
4.2 Granular column collapse
101
the flow dynamics is still lacking. Simple mathematical models based on conservation of horizontal momentum capture the scaling laws of the final deposit, but fail to describe the initial transition regime. From a theoretical point of view, the spreading has been described using depth averaged equations (Kerswell, 2005; Larrieu et al., 2006). The depth-averaged and Saint-Venant equations, however, struggle to recover the precise dynamic behaviour of the system (Warnett et al., 2013) and only succeed in predicting the scaling observed for an aspect ratio less than one. Describing the behaviour of cases with larger aspect ratios and capturing the initial stage of the collapse, when the grains experience a rapid change of direction from vertical to horizontal, remain open challenges. In the present study, multi-scale numerical modelling, i.e. grain-scale modelling and continuum analyses, of the quasi-two-dimensional collapse of granular columns are performed using two-dimensional the Discrete Element Method (DEM) and the Generalised Interpolation Material Point Method (GIMP method). The GIMP method, a hybrid Eulerian–Lagrangian approach, with a Mohr-Coloumb failure criterion is used to describe the continuum behaviour of the granular column collapse. Whereas, the micro-mechanics of the flow is captured using DEM simulations. In this section, the run-out behaviour of quasi-two-dimensional collapse using both MPM and DEM will be studied for initial aspect ratios varying from 0.2 to 10. The flow kinematics and the run-out behaviour between the grain-scale and the continuum simulations highlights the limitations of the continuum approach in modelling dense granular flows and their ability in capturing the complex flow kinematics which are due to micro-scale rheology.
4.2.1
Numerical set-up
In this study, the numerical set-up of granular column collapse is analogous to the experimental investigation performed by Lajeunesse et al. (2004). The experimental configuration of Lajeunesse et al. (2004) is shown in figure 2.7. A granular material of mass m was poured into a container to form a rectangular heap of length L0 and height H0 . The internal friction angle and the wall friction between the wall and the glass beads measured by Lajeunesse et al. (2004) are listed in table 4.1. The gate was then quickly removed to release the granular mass that spreads in the horizontal channel until it comes to rest. The final run-out distance L f and the collapsed height H f were measured. The run-out distance and collapse height exhibit a power law relation with the initial aspect ratio ‘a’ (= H0 /L0 ) of the column. Granular materials when released suddenly on a horizontal surface exhibit transient flow. In this study, the mechanism of flow initiation, spreading dynamics and energy dissipation are studied for varying initial aspect ratios of the granular column. The particle size distribution (PSD) is one of the most important factors controlling landslide initiation
Multi-scale modelling of dry granular flows
102
Table 4.1 Material properties of glass ballotini used in granular column collapse (Lajeunesse et al., 2004).
Parameter
Value
Mean grain diameter 1.15 mm Repose angle 22±0.5° Avalanche angle 27.4±0.5° Wall friction angle 24.8±0.2°
and soil permeability (Utili et al., 2014). Due to the non-availability of the PSD used in the experiment, a PSD curve was generated that matches the range of grain size used in the experiment. A cumulative β distribution (described in section 3.5.5) was used to generate a graded sample with a mean grain diameter of 1.15mm (figure 4.1b). The DEM sample was composed of ∼ 3000 disks with a uniform distribution of diameters by volume fractions in the range [dmin , dmax ] = 0.92 − 1.38 mm with poly-dispersity r = ddmax = 1.5. min The number of DEM grains used in this study is relatively small due to the practicality of simulating coupled fluid-grain interactions at a large scale. Coupled fluid-grain simulations are computationally very expensive. Nevertheless, this study utilises sophisticated hardware and software technologies, available at this time, to simulate the largest possible REVs that provide reasonable description of granular flow behaviour. Marketos and Bolton (2009) observed that the boundary-grain interface may influence the fabric and voids ratio of the material in contact. The boundary effect is found to extend up to 2 mean grain diameters from a smooth, solid boundary over which the granular material had been placed. Sufficient number of grains are used to avoid any such boundary effects. The granular column was prepared by allowing randomly placed grains to undergo ballistic deposition with a constant potential head between layers of soil grains. A snapshot of the sample generated is shown in figure 4.1a. A DEM sample with soil grains arranged in a regular hexagonal lattice was also used to understand the influence of crystallisation and jamming on the run-out behaviour. The overlap between grains is determined by the stiffness kn of the spring in the normal direction. Typically, an average overlap in the range 0.1 to 1.0% is desirable (Zenit, 2005) and the spring constant is chosen to produce grain overlaps in this range. The stiffness is
4.2 Granular column collapse
103
(a) A snapshot of a DEM sample prepared using ballistic deposition technique.
1
0.8
(dr;a,b)
0.6 Graded a=4, b=4, r=1.5
0.4
0.2
0 0.9
1
1.1 1.2 1.3 1.4 1.5 Particle size (mm) (b) Particle size distribution of the DEM sample generated using the cumulative β distribution approach. Figure 4.1 The DEM sample used for the granular column collapse simulation and its grain size distribution curve.
Multi-scale modelling of dry granular flows
104 determined as
2πG � � (1 − ν) 2 ln( 2r ) − 1 A � �1 2r(1 − ν) fn 2 , A= πG
(4.1)
kn =
(4.2)
where fn is the normal contact force; G is the shear modulus; ν is the Poisson’s ratio and r is the radius of the grain. A simpler form of stiffness for a spherical grain is defined as kn = 4Er ,
(4.3)
where E is the Young’s modulus of the material and r is the radius of the grain. Cambou et al. (2009) observed that the contact model has negligible influence on the run-out behaviour of rapid granular flows. The granular collapse simulations performed using non-linear HertzMindlin contact model and the linear-elastic contact model showed no significant difference in the granular flow behaviour (Utili et al., 2014). A linear-elastic contact model is used in the present study due to its simplicity and lower computation time requirement. The maximum tangential force is limited by the Mohr-Coloumb criterion. Staron and Hinch (2007) observed that the coefficient of restitution ε dramatically changes the behaviour of the system as ε → 1; in particular, this dramatic change is expected to become more important for increasing values of a. On the contrary, for ε ≤ 0.8, the influence of the coefficient of restitution becomes negligible. In the present study, a value of 0.75 is adopted as the coefficient of restitution, similar values were adopted by Girolami et al. (2012) and Zenit (2005). The normal damping coefficient Cn is appropriately chosen to achieve the required coefficient of restitution ε: Cn = 2γ
(4.4)
p mi j kn ,
ln(ε) where γ = − q , π 2 + ln2 (ε)
and mi j =
mi m j . mi + m j
(4.5)
The micro-mechanical parameters used in this study are presented in table 4.2. A rolling resistance was adopted in order to model the shape effect of non-spherical grains (Iwashita and Oda, 1998). Due to the unsteady nature of the flow, the grains get dispersed on the horizontal plane as discrete bodies start to separate from the main mass, hence the run-out distance is calculated as the position of the farthest grain which has at least one contact with the main mass.
4.2 Granular column collapse
105
Frictional boundary Gate Frictional boundary
Figure 4.2 DEM set-up for a granular collapse simulation (a = 0.8). Shows the grains in a stable state under the influence of gravity.
The configuration of the granular column collapse using DEM is show in figure 4.2 for a column with an initial aspect ratio of 0.8. The soil grains were packed using ballistic deposition technique once a stable state was reached, the gate was opened allowing the granular column to collapse and flow. Frictional boundaries were specified on the left and the bottom boundaries. The GIMP method with a Mohr-Coloumb constitutive model was used to simulate plane strain collapse of granular columns. Crosta et al. (2009) observed that the MohrColoumb model with non-associate flow rule is able to capture granular collapse dynamics and models the strong vertical motion. This method does not suffer the limitations of typical shallow water equation techniques. In order to understand the ability and limitations of continuum approaches in capturing the local rheology, it is important to scale the grain-scale material properties, such as the inter-particle friction and stiffness, to the continuum scale (macroscopic friction and Young’s modulus). Crosta et al. (2009) observed that the friction angle plays a significant role on the run-out behaviour. In the MPM simulations, the granular flow was assumed to be in the critical state and the critical state friction angle was used as an input in the Mohr-Coloumb model. In order to obtain the critical state friction angle of the granular sample, a shear test is performed using 1078 DEM grains. A bi-periodic boundary condition was adopted on the sides of the sample (figure 4.3a). Two layers of fixed grains (shown in black) were placed at the top and
Multi-scale modelling of dry granular flows
106
Table 4.2 Micro-mechanical parameters used in DEM simulations of granular column collapse.
Parameter
Value
Young’s modulus of glass bead Poisson’s ratio Diameter of glass beads Normal and shear stiffness of grains Normal and sear stiffness of wall Inter-particle friction coefficient, µ Wall friction coefficient Coefficient of restitution, ε Rolling spring constant Coefficient of rolling damping
70 × 109 N/m2 0.22 - 0.24 0.92 to 1.38 mm 1.6 × 10⁸ N/m 4 × 10⁸ N/m 0.53 0.466 0.75 1.0 × 10³ N m/rad 1.0 × 10⁻¹ N m s/rad
the bottom of the shear sample. A normal stress σn′ and a horizontal velocity v was applied to the fixed grains at the top of the shear sample. As the normal effective stress was varied, the average shear stress in the sample was measured. The stresses were smoothed by averaging across time steps. The sample was sheared until the critical state was reached. The slope of shear stress versus normal effective stress gives the critical state friction angle. A critical state friction angle of 22.2° was obtained. The macroscopic friction angle was in the range observed by Estrada et al. (2008) and Mitchell and Soga (2005). The Young’s modulus of the granular assembly was obtained as the initial slope of the stress-strain plot of a uni-axial compression of a laterally confined granular column using DEM. Guilkey et al. (2003) suggests using at least four material points per cell for large deformation problems. In the present study there were 16 material points per cell. If the mesh is too fine and the number of particles is too large, the particle size 2l p decreases, and the GIMP interpolation function tends to approach the original MPM function, as shown by Bardenhagen and Kober (2004). Hence, GIMP loses the merit that it reduces the numerical noise due to material points crossing the background mesh. In addition, the probability of particles crossing the background mesh increases with decrease in the mesh size, hence, more noise may be produced (Abe et al., 2013). The effect of the number of material points per cell on the run-out behaviour is discussed later in section 4.4.2. The initial set-up of a granular column collapse (a = 1) using MPM is shown in figure 4.4. For all the MPM simulations, a cell size of 2 × 10⁻³ m with 16 material points per cell was adopted (figure 4.4a). The granular columns were discretised into 40,000 to 160,000 material points. Each material point represents one-eigth of a DEM soil grain. Since, the scale of the problem being modelled is small and it is important to precisely define the flow surface, a larger number of material points are used to represent the geometry. The initial vertical
4.2 Granular column collapse
107
(a) Boundary conditions 70 60
σxy [kPa]
50 40 30 20 10 0
0
20
40
60
80 σyy [kPa]
100
120
140
(b) Critical state friction angle from periodic shear test Figure 4.3 Periodic shear test using DEM to obtain macroscopic friction angle.
Multi-scale modelling of dry granular flows
108
Table 4.3 Parameters used in continuum simulations of granular column collapse.
Parameter
Value
Material point spacing Number of material points per cell Mesh length Young’s Modulus, E Poisson’s ratio, ν Friction angle, φ Dilatancy angle, Φ Density, ρ Wall friction Time step increment
0.5 mm 16 2 × 10⁻³ m 1.98 × 10⁶ N/m2 0.22 to 0.24 22.2 ± 0.2° 0° 1925 kg/m3 0.466 1.0 × 10⁻⁶ s
effective stress simulated in MPM, before the collapse stage, is shown in figure 4.4b. The extent of the background mesh in MPM is much larger than the initial column. In MPM, the material points move inside the grid, so it is important to have a sufficiently large domain for the collapse. Frictional boundaries are applied as constrains on the nodal accelerations on the left and the bottom boundaries. The parameters used for the continuum analyses are presented in table 4.3.
4.2.2
Deposit morphology
A series of two-dimensional plane-strain MPM and DEM simulations of granular column collapse were performed by varying the initial aspect ratio of the column from 0.2 to 10. The evolution of run-out and the flow kinematics observed in both approaches were compared to understand the ability and limitations of these approaches. The normalised final run-out distance, ∆L = (L f − L0 )/L0 , as a function of the initial aspect ratio a of the column is presented in figure 4.5. Similar to the experimental behaviour a power law relation between the run-out and the initial aspect ratio of the column is observed. Two distinct flow regimes can be seen: (a) for a < 2.7 a linear relation between the spread and aspect ratio can be observed, and (b) for a > 2.7 a power-law relationship exists. In the present study, the following scaling law for the run-out (using DEM) is observed: a ≲ 2.7 L f − L0 1.67a, ≈ (4.6) 2.7a2/3 , L0 a ≳ 2.7
4.2 Granular column collapse
109
(a) Initial arrangement of material points in the mesh. Closer view of 16 material points per cell for a column with an initial aspect ratio of 1. Cell size of 2 × 10⁻³ m.
(b) Initial vertical effective stress in MPM for a column with an aspect ratio of 1. Figure 4.4 MPM initial mesh and vertical stress for a granular column collapse simulation (a=1).
110
Multi-scale modelling of dry granular flows
Both, MPM and DEM simulations are able to capture the linear relationship for a < 2.7, and the simulation results agree with the experimental investigation (Lajeunesse et al., 2005). This shows that a simple frictional dissipation model is able to capture the flow dynamics for columns with small aspect ratios. For a < 2.7, the normalised run-out distances predicted using DEM simulations are very close to those observed in the experiment. DEM simulations with a hexagonal packing show shorter run-out distances in comparison to the randomly packed sample. This difference in the run-out behaviour might be due to crystallisation and jamming effects in hexagonal packing. The small difference in the final run-out between the DEM and the experimental results can be attributed to the variation in the packing of grains and the three-dimensional grain shape. Also, the experimental data corresponds to granular column collapse in a rectangular channel, where the collapse is not the pure twodimensional collapse that is in the case of numerical simulations. Most aerial and sub-marine landslides have a large lateral extent, i.e., plane-strain condition, hence in the present study two-dimensional simulations are performed. Although two-dimensional simulations don’t capture movement of the grains perpendicular to the plane of the experiment, it simplifies the configuration so as to compare DEM simulations with MPM. Also, Balmforth and Kerswell (2005) observed that the side-walls in quasi-two-dimensional collapse do not influence the power-law behaviour but affect the numerical constant, which depends on the material properties. A significant difference in the final run-out between MPM, which is based on a simple frictional model for dissipation of potential energy, and DEM simulations, indicates a change in the mechanism of energy dissipation for columns with large aspect ratios (a > 2.7). A transition in the run-out behaviour at an aspect ratio of 2.7 indicates a change in the flow kinematics. Similar behaviour in the run-out distance was observed by Bandara (2013) for columns with large aspect ratios (a ≥ 2). Mast et al. (2014a) observed a 40% increase in the final run-out distances, for large aspect ratios, than reported in the literature. Previous studies have failed to describe the mechanism of energy dissipation in continuum approaches and the reason for longer run-out distance. Section 4.2.4 discusses the reason behind the difference in the run-out behaviour between continuum and experimental findings. The longer run-out distance in MPM simulations at large aspect ratios might be influenced by the amount of material mobilised during the collapse. In tall columns, the entire column participates in the flow, in contrast to short columns where the collapse is due to avalanching of the flanks. It is possible that MPM simulations collapse more resulting in longer run-out distances. Figure 4.6 shows the normalised final height as a function of the initial aspect ratio of the column. Similar to the run-out behaviour, the normalised-height also shows two distinct regimes. The scaling of final height of the column with the initial aspect ratio of the
4.2 Granular column collapse
111
column can be written as a ≲ 0.7 H f a, ∝ Li a2/3 , a ≳ 0.7
(4.7)
The final heights predicted by both DEM and MPM simulations match the experimental data for columns with smaller aspect ratios (a ≤ 0.7). A linear relationship between the final height and the aspect ratio indicates that only a part of the granular column is mobilised during the collapse. For tall columns, both approaches predict similar normalised heights. However, the normalised height observed in MPM is higher than in DEM simulations, which is in contrast to the idea of an increase in the amount of material mobilised during the collapse in MPM simulations resulting in longer run-out distance. Hence, the longer run-out observed in MPM simulations is due a change in the flow dynamics at higher aspect ratios, which is not captured in MPM simulations. The final height of a column is controlled by the amount of static region in the granular column collapse, while the run-out distance is essentially a function of the flowing mass. Hence, it is important to compare the evolution of flow and the internal flow structure in DEM and MPM simulations.
normalised runout (Lf - L0)/L0
10
MPM longer run-out distance
1
0.1 0.1
Experimental DEM Random DEM Hexagon MPM
1 aspect ratio a
10
Figure 4.5 Normalised final run-out distance for columns with different initial aspect ratios.
Multi-scale modelling of dry granular flows
112
0
10
H f /L 0
Experiment (Lajeunesse 2005) DEM (Hexagon) DEM (Random) MPM
−1
10 −1 10
0
10
1
10
aspect ratio 'a'
Figure 4.6 Normalised final collapse height for columns with different initial aspect ratios.
4.2.3
Flow evolution and internal flow structure
The normalised run-out and height as a function of the aspect ratio indicate that, for a given granular material and substrate properties, the flow dynamics and the final deposit morphology are independent of the volume of granular material released, but depend only on the geometry of the column. A power law relationship is observed between the run-out distance and the initial aspect ratio of the column. A transition in the run-out behaviour at an aspect ratio of 2.7 indicates a change in the flow dynamics. Dimensional analysis of granular column collapse reveals an intrinsic time defined as p H0 /g. This intrinsic time is a transient time of order τc , at which the flow is fully developed, i.e., the potential energy available at the initial stage of collapse is now fully converted to kinetic energy. Numerical simulation of the velocity profile of a granular column (a=0.4) at the critical time τc is presented in figure 4.7. At the critical time, the velocity field depends only on the position of the grain along the sliding mass. The maximum velocity is observed at the front of the flowing mass corresponding to that of a plug flow in the horizontal direction. Particulate and continuum simulations show similar run-out distances at the critical time. Both approaches show similar quantities of material destabilised above the failure surface. However, the crystalline arrangement of soil grains in a hexagonal packing results in a different flow mechanics, which also shows the effect of jamming at the flow front. The continuum nature of MPM results in a slightly different geometry of the material destabilised above the failure surface in comparison to DEM simulations. The velocity profile is similar to a steady granular surface flow observed by Lajeunesse et al. (2004).
4.2 Granular column collapse
113
For short columns (a < 2.7), the flow is initiated by a failure at the edge of the pile along a well-defined shear-failure surface. The granular mass fails through avalanching of flanks producing a truncated cone-like deposit (‘a’ < 0.7) or conical deposit (‘a’ > 0.7). The grains located above the failure surface move “en masse” leaving a static region underneath the failure surface. For columns with lower initial aspect ratios, the run-out distance is proportional to the mass flowing above the failure surface. The spreading results from a Coulomb-like failure of the edges and implies no free fall of the column. In this case, the effective friction properties of the flow can be simply predicted from the shape of the final deposit. The amount of mass mobilised during the collapse is significantly affected by the angle of the failure surface. Figure 4.7 shows that both numerical techniques predict a distinct failure surface when the flow is fully developed at critical time τc . The angle of the failure surface is found to be about 55°. The failure surface begins from the toe of the column and propagates inwards at an angle of 50 to 55°. The formation of the “truncated conical deposit” or “conical deposit” depends on the initial length of the column, as the angle of the failure surface is found to be independent of the aspect ratio. The failure angle is consistent with the interpretation in terms of active Coulomb failure, which leads to a predicted failure angle φy = 45° + φ /2, where φ is the friction angle of the granular material. In the present study, the macroscopic friction angle is 22°, which leads to φy = 45° + 22°/2 = 56°, which is in good agreement with the numerical simulations and the experimental observations by Lajeunesse et al. (2004). The shear-failure angle has a direct effect on the transition between the truncated cone and the conical deposit occurring at an aspect ratio of 0.7. The final profile of the granular column with an initial aspect ratio of 0.4 obtained from DEM and MPM simulations are shown in figure 4.8. Both MPM and DEM show similar run-out behaviour. The continuum approach is able to capture the flow dynamics of short columns, where the failure mechanism is active Coulomb failure. In dense hexagonal packing, the failure surface is steep due to crystallisation effects. The variation in the angle of the failure surface causes a difference in the amount of material destabilised, and in turn the run-out distance. This crystallisation phenomenon is found to have a significant influence on the final deposit of the granular column. MPM and DEM simulations of the velocity profile of a granular column with an initial aspect ratio of 6 at critical time τc is shown in figure 4.9. For tall columns (a > 2.7), the flow is still initiated by a well defined failure surface as can be seen in figure 4.9. However, in this case the initial granular column is much higher than the top of the failure surface. Due to gravity most of the grains in the column experience free-fall consuming the column along their way. When they reach the vicinity of the failure surface, the flow gets deviated along
Multi-scale modelling of dry granular flows
114
0.1
DEM (Random Packing) 0.5
0.08
0.4
( m)
0.06
0.3 0.04
0.2
0.02 0 0
0.1 0.02
0.04
0.06
0.1
0.08
0.1 (m)
0.12
0.14
0.16
0.18
0.2
0.6
DEM (Hexagonal Packing)
0.5
0.08
(m)
0
0.4
0.06
0.3 0.04
0.2
0.02 0 0
0.1 0.02
0.04
0.06
0.08
0.1
(m)
0.12
0.14
0.16
0.18
0.2
0
(m)
Material Point Method
(m)
Figure 4.7 Velocity profile of a granular column collapse (a = 0.4, t = τc ). Velocity is shown in m/s.
4.2 Granular column collapse
115
0.1
DEM (Random Packing) 0.5
(m)
0.08
0.4
0.06
0.3 0.04
0.2
0.02 0 0
0.1 0.02
0.04
0.06
0.1
0.08
0.1 (m)
0.12
0.14
0.16
0.18
0.2
0.6
DEM(Hexagonal Packing)
0.5
( m)
0.08
0.4
0.06
0.3 0.04
0.2
0.02 0 0
0.1 0.02
0.04
0.06
0.1
0.08
0.1 (m)
0.12
0.14
0.16
0.18
0.2
0
0.6
Material Point Method
0.5
0.08
(m) (m)
0
0.4
0.06
0.3 0.04
0.2
0.02 0 0
0.1 0.02
0.04
0.06
0.08
0.1 (m) (m)
0.12
0.14
0.16
0.18
0.2
0
Figure 4.8 Velocity profile of a granular column collapse (a = 0.4, t = 3 × τc ). Velocity is shown in m/s.
116
Multi-scale modelling of dry granular flows
the horizontal direction releasing a huge amount of kinetic energy gained during the free fall. For larger aspect ratios (a > 0.7), the resulting static region is a cone, the final height of the cone H f lies above the summit of the failure surface. An initial failure surface starting from the toe end of the column at an angle of about 55° can be observed at the critical time τc . As the collapse of the granular column progresses, successive failure planes parallel to the initial failure surface are formed and shear failure occurs along these planes. The presence of several shear bands in the final profile of the collapsed granular column confirms this behaviour. This observation throws light on the mechanics of propagation of shear bands in massive landslides such as the Storegga submarine landslide, where the propagation of shear bands is found to have caused long run-out distances (Dey et al., 2012). After the initial stage of collapse in tall columns, the flow behaviour becomes similar to that of columns with lower initial aspect ratios as the flow starts descending along the failure plane. Hexagonal packing results in crystallisation, which has a significant effect on the run-out distance by forming a series of parallel shear bands, resulting in an unnatural flow kinematics. The final profile of the collapsed granular column with an initial aspect ratio of 6 is presented in figure 4.10. For tall columns, the dissipation process is more complex due to the free-fall dynamics. The vertical acceleration of the grains induces a non-trivial mass distribution in the flow during spreading. Staron and Hinch (2007) observed that the mass distribution plays a dominant role in the power-law scaling observed in the run-out. Regardless of the experimental configuration and the initial aspect ratio of the columns, the flow is initiated by a well-defined rupture surface, above which the material slides down leaving a static region underneath the failure plane. Depending on the aspect ratio of the column, two asymptotic behaviours are observed. For smaller aspect ratios, the flow is dominated by friction where as the large aspect ratio columns are influenced by the pressure gradient. To study the influence of aspect ratio on the flow dynamics of granular columns, the flow front L(t) and the maximum height of column H(t) are tracked. The evolution of scaled height (H f /L0 ) and the run-out distance (L f − L0 )/L0 with time for granular columns with initial aspect ratios of 0.4 and 6 are presented in figure 4.11. Three distinct regions can be observed in the flow evolution of a granular column collapse regardless of the initial aspect ratio of the column. An initial transient acceleration phase is observed for a time 0.8τc . The critical time, τc is evaluated as the time at which the potential energy available for the flow has been converted to kinetic energy. This phase is followed by a heap movement of granular material at the foot of the column with a constant spreading velocity V for about 2τc . When time is longer than the critical time (t > τc ), the velocity varies linearly with depth in the
4.2 Granular column collapse
117
0.2
1
DEM (Random Packing)
(m)
0.15
0.8 0.6
0.1 0.4 0.05 0 0
0.2 0.05
0.1
0.15
(m)
0.2
0.25
0.3
0.35
0.2
1
DEM (Hexagonal Packing)
0.15 (m)
0
0.8 0.6
0.1 0.4 0.05 0 0
0.2 0.05
0.1
0.15
(m)
0.2
0.25
0.3
0.35
0
(m)
Material Point Method
(m)
Figure 4.9 Velocity profile of a granular column collapse (a = 6, t = τc ). Velocity is shown in m/s.
Multi-scale modelling of dry granular flows
118
0.2
1
DEM (Random Packing)
0.8
(m)
0.15
0.6 0.1 0.4 0.05 0 0
0.2 0.05
0.1
0.15
(m)
0.2
0.25
0.3
0.35
0.2
1
DEM (Hexagonal Packing)
0.15 (m)
0
0.8 0.6
0.1 0.4 0.05 0 0
0.2 0.05
0.1
0.15
(m)
0.2
0.25
0.3
0.35
0
(m)
Material Point Method
(m)
Figure 4.10 Velocity profile of a granular column collapse (a = 6, t = 3 × τc ). Velocity is shown in m/s.
4.2 Granular column collapse
119
flowing layer and decreases exponentially with depth near the static layer. This velocity profile is similar to those observed in steady granular surface flows (Lajeunesse et al., 2004). Most of the run-out happens during this phase. The final phase involves deceleration of the flow front and the flow comes to rest after about 0.6τc . The spreading of the granular column ceases after a time on the order of about 3τc , however some motion still persists along the free surface behind the flow front for a much longer time due to internal rearrangement, the duration of which can last up to t ≈ 6τc . In short columns, the critical time observed in both hexagonal and random packing of grains matches the experimental observations. However, the material point method takes longer for the flow to be fully mobilised; this can be attributed to the continuum nature of MPM which takes ∼ 20% longer to destabilise the initial stress conditions. However, the actual run-out duration of the flow is similar to DEM and the granular mass comes to rest at about t = 3τc , this is due to a steeper decline in the potential energy in MPM compared to DEM simulations. For columns with larger aspect ratios, the continuum and particulate approaches simulate similar flow evolution up to 3τc , beyond which particulate simulation decelerates and comes to rest, while the flow continues to evolve in MPM simulation resulting in longer run-out distance. The flow comes to rest at time t = 6τc . The three phases in a granular flow can be distinctly observed in the flow evolution plot for a column with an initial aspect ratio of 6 (figure 4.11b). The flow evolution behaviour observed in the case of DEM simulation matches the experimental observation by Lajeunesse et al. (2004). Hexagonal packing predicts longer time for the flow to evolve, which can be attributed to jamming of grains. In MPM simulations, the failure starts at the toe of the column and slowly propagates up to form the failure surface. This results in slower initiation of the flow. In DEM, however, the initial stage of collapse is characterised by free-fall under gravity. It can be observed that MPM overestimates the critical time by 50%. Although MPM and DEM simulations show the same run-out at time t = 3τc , the flow evolution between both the approaches is different. The MPM simulations show that the granular flow continues to accelerate beyond 3τc and ceases at around 6τc . In order to understand the difference in the flow dynamics in the case of material point method, it is important to study the mechanism of energy dissipation.
4.2.4
Energy dissipation mechanism
The energy dissipation mechanism during collapse provides useful insights into the flow dynamics. In the case of small aspect ratios, the columns undergo no free fall. The spreading mainly results from the failure of the edges, while the top of the column remains essentially undisturbed in the central area. The amount of energy dissipated during the spreading δ E
normalised runout distance (Lf - Li)/Li
0.7
0.4
0.6
0.38
0.5
0.36 DEM Runout (Hexagonal) DEM Runout (Random) MPM Runout DEM Height (Hexagonal) DEM Height (Random) MPM Height
0.4 0.3
0.34 0.32 0.3
0.2
normalised height (Hf)/L
Multi-scale modelling of dry granular flows
120
0.28 0.1 0.26 0
0
0.5
1
1.5 2 2.5 normalised time t/ (H/g)
3
3.5
(a) Flow evolution of a column with a = 0.4
6
DEM Runout (Hexagonal) DEM Runout (Random) MPM Runout DEM Height (Hexagonal) DEM Height (Random) MPM Height
12 10
5 4
8 3 6 2
4
1
2 0
0
1
2 3 4 normalised time t/ (H/g)
5
6
(b) Flow evolution of a column with a = 6 Figure 4.11 Flow evolution of granular column collapse (a = 0.4 and 6).
0
normalised height (Hf)/L
normalised runout distance (Lf - Li)/Li
14
4.2 Granular column collapse
121
Figure 4.12 Scheme of collapse for small aspect ratio columns. The amount of energy δ E lost in the process can be evaluated from the run-out distance L f − L0 (Staron and Hinch, 2007).
can be easily recovered using the simple shape of the final deposit and volume conservation (figure 4.12). The difference in potential energy between the initial and the final states gives 1 δ E = gρ(L f − L0 )H02 , (4.8) 6 where ρ is the density of the packing. It is assumed that this energy is dissipated by the work of frictional forces Wµ over the total run-out distance by the center of mass G of the spreading material. The collapse involves two regions of dissipation: the amount of mass destabilised 14 (L f − L0 )H0 over two thirds of the run-out distance 2(L f − L0 )/3 (considering the triangular shape of the final deposit and the initial and the final positions of the centre of mass). The effective coefficient of friction µe characterises the mean dissipation in the flow. The work of friction forces is 1 Wµ = µe gρ(L f − L0 )2 H0 . 6
(4.9)
Equating δE and Wµ gives µe (L f − L0 ) = H0 . The scaling of the runout leads directly to the relation µe = λ −1 , where λ is the numerical constant in the power-law relation between the run-out and the initial aspect ratio, which depends on the material properties. The amount of energy δ E dissipated during the spreading is compared with W = N p gm p r p , where N p is the total number of grains, m p is their mass, and r p is the total horizontal distance run by each of them. The dissipation energy δ E is proportional to W . Staron and Hinch (2007) observed that the coefficient of proportionality gives a measure of the effective friction and observed a power law dependence between µe and internal friction angle µ: µe = 0.425µ 0.2 . In this study, an effective friction angle µe of 21° is observed, which is very close to the critical state friction angle of 22° used in MPM simulations. The global effective friction angle obtained from the simple macroscopic energy-dissipation analysis matches the critical state friction
Multi-scale modelling of dry granular flows
122
used in MPM simulations. This proves that the energy dissipation mechanism modelled in a continuum sense as a frictional dissipation process captures the flow kinematics observed in DEM and experiments for short columns. Figure 4.13a shows the time evolution of the normalised potential energy (E p /E0 ) and kinetic energy (Ek /E0 ) for granular columns with an initial aspect ratio a = 0.4. The normalised potential and kinetic energy are computed as Np
Ep =
∑ m pgh p ,
(4.10)
p=1
N
Eki =
1 p ∑ m pv2p , 2 p=1
(4.11)
where N p is the total number of grains, m p is the mass of a grain p, h p is the height and v p is the velocity of the grain p. The cumulative dissipation energy is computed as Ed Ek E p = 1− − . E0 E0 E0
(4.12)
It can be observed that both MPM and DEM show similar energy dissipation mechanisms. The DEM simulation shows 3% more potential energy dissipation in comparison with MPM simulations. This small difference in the potential energy is due to grain rearrangements. This shows the ability of the continuum approach to capture the flow kinematics of columns with small aspect ratios (a ≤ 2.7). The evolution of normalised kinetic and potential energy of a tall column collapse (a = 6) are shown in figure 4.13b. It can be observed that the initial potential energy stored in the grains is converted to kinetic energy which is dissipated as the granular material flows down. Three successive stages can be identified in the granular column collapse. In the first stage, similar to short columns, the flow is initiated by a well defined failure surface. However, the centre of gravity of the granular column is much higher than the top of the failure surface, which results in free fall of grains under gravity consuming the column along their way. In this stage which lasts for (t < 0.8τc ), the initial potential energy stored in the grains is converted into vertical motion. In the second stage, when the grains reach the vicinity of the failure surface, they undergo collisions with the bottom plane and the neighbouring grains, thus causing the flow to deviate along the horizontal direction releasing a large amount of kinetic energy gained during the free fall (figure 4.10). In the third stage, the grains eventually leave the base area of the column and flow sideways (Lajeunesse et al., 2004). As the process
4.2 Granular column collapse
123
involves collective dynamics of all the grains, it is difficult to predict the exact trajectory of a grain, however, the overall dynamics can be explained. DEM simulations model both collisional and frictional dissipation processes during the collapse of tall columns. However, MPM simulations assume that the total initial potential energy stored in the system is completely dissipated through friction over the entire runout distance, which results in longer run-out distance. Figure 4.13b shows the evolution of normalised energies with time for MPM and DEM simulations. At the initial stage of collapse, characterised by free fall of grains under gravity, the DEM simulation, due to its particulate nature shows a rapid reduction in the potential energy in comparison with the MPM simulations, where the failure begins from the toe of the column. The continuum nature of the MPM simulations results in slower initiation of the collapse (figure 4.11b). It can be also observed from figure 4.13b that the dissipation of energy in MPM is 25% less than in the DEM simulations. In order to understand the mechanism of energy dissipation, it is important to separate the contribution from the cumulative frictional and collisional parts. The frictional dissipation (basal and internal friction) observed in DEM is almost identical to the frictional dissipation observed in MPM (figure 4.13b). The difference in the dissipation energy is due to the collisional regime, which occurs at 0.8τc . The total dissipation and the frictional dissipation curves diverge around 0.8τc where the grains near the vicinity of the failure surface undergo collisions with the bottom plane and the neighbouring grains resulting in collisional dissipation of the stored potential energy. DEM simulation show drop in the peak kinetic energy at ≈ 0.8τc , which is at the beginning collisional dissipation stage. MPM lacks this collision dissipation mechanism, which results in longer run-out distances for columns with large aspect ratios. The µ(I) rheology, discussed in section 2.2.3, describes the granular behaviour using a dimensionless number, called the inertial number I, which is the ratio of inertia to the pressure forces. Small values of I correspond to the critical state in soil mechanics and large values of I corresponds to the fully collisional regime of kinetic theory. µ(I) rheology is adopted in MPM simulations to understand the characteristics of the flow regime. The Mohr-Coulomb model was used along with µ(I) rheology. The friction angle is changed according to a friction law (Da Cruz et al., 2005) that is dependent on the inertial number I as µ = µmin + bI, where µmin = 0.22 and b = 1. Figure 4.14 shows the flow evolution of granular column collapse for aspect ratios a of 0.4 and 6 using µ(I) rheology. For short columns, the evolution of flow based on µ(I) rheology is identical to the MPM simulation using Mohr-Coloumb model. However, for tall columns, µ(I) rheology evolves at the same rate as the DEM simulations up to t = 0.8τc , after which the MPM simulation continues to
Normalised potential energy
1
0.5
0.8
0.4
DEM Ep/E0 DEM Ek/E0
0.6
0.3
DEM Ed/E0 MPM Ep/E0 0.4
0.2
MPM Ek/E0 MPM Ed/E0
0.2
0
0.1
0
0.5
1
1.5
2
2.5
3
Normalised kinetic & dissipation energy
Multi-scale modelling of dry granular flows
124
0
Normalised time t/ c (a) Energy evolution of a column with a = 0.4. 1
DEM Ep/E0 DEM Ek/E0 DEM Ed/E0 DEM Friction/Eo MPM Ep/E0 MPM Ek/E0 MPM Ed/E0
0.8
0.8
0.6
0.6
0.4
0.4
0.2
0.2
0
0
0.5
1
1.5
2
2.5
3
0
Normalised time t/ c (b) Energy evolution of a column with a = 6. Figure 4.13 Energy evolution of granular column collapse (a=0.4 and 6).
Normalised kinetic & dissipation energy
Normalised potential energy
1
4.3 Role of initial grain properties on the collapse of granular columns
125
accelerate due to lack of collisional dissipation, while the DEM simulation decelerates with time. Figure 4.15 shows that the short column attains a maximum inertial number of 0.012, which is in the dense granular flow regime, inertial number ≈ 10−3 < I < 0.1 (Da Cruz et al., 2005). However for the tall column, the maximum inertial number I ≈ 0.04 is still within the dense granular flow regime. DEM simulations, however, showed a collisional regime that has inertial numbers higher than 0.1. This shows that continuum approach using frictional laws are able to capture the flow kinematics at small aspect ratios, however they are unable to precisely describe the flow dynamics of tall columns, which is characterised by an initial collisional regime. This suggests that triggering mechanisms play a crucial role in the case of modelling the natural flows. This stresses the necessity of accounting for initiation mechanisms while modelling the run-out behaviour using continuum approaches to predict realistic granular flow behaviour. The role of the initiation mechanism on the run-out behaviour and the ability of MPM in modelling transient flows that does not involve collision are investigated in section 4.4. The initial material property has a significant influence on the run-out behaviour. This aspect has attracted less research. In the next section, 2D DEM simulations are performed to understand the influence of initial grain properties on the collapse. This gives us a better understanding of the input parameters required in the continuum modelling.
4.3
Role of initial grain properties on the collapse of granular columns
The role of material properties and the distribution of mass in the system have been shown to have a non-trivial influence on the flow kinematics and the internal flow structure. Hence it is important to understand the role of initial packing density on the run-out behaviour in the case of granular column collapse. Lube et al. (2005) observed that the run-out distance scales with the initial aspect ratio of the column, independent of the material properties. The run-out evolution after the initial transition regime is a frictional dissipation process, and the lack of influence of material properties on the run-out behaviour is inconsistent with frictional dissipation in continuum modelling of granular flow behaviour. Balmforth and Kerswell (2005) observed that the material properties have almost no influence on the exponent of the normalised run-out as a function of the initial aspect ratio. The numerical constant of proportionality, however, showed clear material dependence. This corroborates the conclusions of Lajeunesse et al. (2004) and refutes that of Lube et al. (2005). Daerr and
Multi-scale modelling of dry granular flows
0.7
0.4
0.6
0.38
0.5
0.36 MPM Runout (mu(I)) DEM Runout (Random) MPM Runout MPM Height (mu(I)) DEM Height (Random) MPM Height
0.4 0.3
0.34 0.32 0.3
0.2
normalised height (Hf)/L
normalised runout distance (Lf - Li)/Li
126
0.28
0.1
0.26 0
0
1
1.5 2 2.5 normalised time t/√(H/g)
3
3.5
(a) Flow evolution of a column with a = 0.4 using µ(I) rheology.
14
6
12
5
10
4
8 3 6 2
4
MPM Runout (mu(I)) DEM Runout (Random) MPM Runout MPM Height (mu(I)) DEM Height (Random) MPM Height
2 0
0
1
2 3 4 normalised time t/√(H/g)
5
6
normalised height (Hf)/L
normalised runout distance (Lf - Li)/Li
0.5
1 0
(b) Flow evolution of a column with a = 6 using µ(I) rheology. Figure 4.14 Flow evolution of granular column collapse using µ(I) rheology (a=0.4 and 6).
4.3 Role of initial grain properties on the collapse of granular columns
0.045
127
MPM mu(I) - aspect ratio 0.4 MPM mu(I) - aspect ratio 6
0.04
Inertial number (I)
0.035 0.03 0.025 0.02 0.015 0.01 0.005 0
0
1
2 3 4 normalised time t/ (H/g)
5
6
Figure 4.15 MPM simulation of evolution of inertial number with time for columns with a = 0.4 and a = 6.
128
Multi-scale modelling of dry granular flows
Douady (1999) also observed strong influence of initial packing density and the internal structure on the behaviour of granular flows. It should be noted that the collapse experiment is highly transient and no clear stationary regime is observed. On the contrary, the acceleration and the deceleration phases cover nearly the whole duration of the spreading. This makes it difficult to analyse the flow structure and its relation with other characteristic of the system. The knowledge of the final run-out is not a sufficient characterization of the deposit; one also needs to know how the mass is distributed during the flow to understand the dynamics and the dissipation process. This is expected to be true in natural contexts as well as in experiments. While the inter-grain friction does not affect the early vertical dynamics, nor the power-law dependence, it controls the effective frictional properties of the flow, and its internal structure (Staron and Hinch, 2007). It is interesting to note that the details of the structure of the flow do not influence the final run-out dependence, and thus seem to play a marginal role in the overall behaviour of the spreading. This could explain why a simple continuum model with a frictional dissipation could reproduce the run-out scaling for columns with small aspect ratios. Most research has been focussed on the run-out behaviour of mono-disperse grain sizes. However, the influence of initial packing density and poly-dispersity have attracted less interest. In the present study, DEM simulations of collapse of loose (79% packing density) and dense (83% packing density) granular columns with an initial aspect ratio a of 0.8 are performed to understand the influence of material properties on the run-out behaviour. The evolution of normalised run-out with time for two different initial packing densities are presented in figure 4.16. At the initial stage of collapse t = τc , the flow evolution is identical in both dense and loose conditions. However, the dense column flows for 30% longer than the loose columns. Both the columns come to rest at around t = 4τc . The columns, however, show similar evolution of the normalised height. This shows that only a part of the column is destabilised during the collapse. Figure 4.18 shows the evolution of potential and kinetic energy with time. Similar potential energy evolution in both dense and loose conditions reveals that there is no change in the overall mechanism of collapse. The dense condition has a slightly higher peak kinetic energy than the loose column. In the free-fall phase, the dense column shows a steeper increase in the horizontal kinetic energy in comparison to the loose column. This indicates that the dense granular mass is pushed farther away more quickly than with the loose column. A loose column exhibits higher vertical kinetic energy which may be due to particle rearrangement resulting in densification of the granular mass. Figure 4.17 shows that the loose sample densifies as the flow evolves. Both dense and loose granular columns dilate during the initial stage of collapse, this is due to grains experiencing shear along the
4.3 Role of initial grain properties on the collapse of granular columns
129
2.5
0.8
2
0.6 0.5
1.5
Dense run-out Dense height Loose run-out Loose height
1
0.4 0.3 0.2
0.5
normalised height H/L
normalised runout (Lf - Li)/Li
0.7
0.1 0
0
1
2 3 4 normalised time t/ c
5
6
0
Figure 4.16 Effect of density on the run-out evolution a = 0.8.
84
Dense Loose
packing density (%)
83 82 81 80 79 78 77
0
1
2
3 4 5 normalised time t/ c
6
7
Figure 4.17 Evolution of local packing density with time a = 0.8.
8
130
Multi-scale modelling of dry granular flows
shear-failure surface. In both cases, the granular mass attains similar packing density at the end of the flow. The dense granular column dilates, while the loose column compacts to achieve the same critical density. The dense condition has higher mobilised potential energy during the initial stage of collapse, which yields higher horizontal kinetic energy for the flow. However in loose conditions, a higher proportion of the available energy is lost during compaction. This behaviour in addition to higher mobilised potential energy results in longer run-out distance in dense granular column. Lajeunesse et al. (2004) observed that the flow comes to rest at around 3τc , but the grains continue to re-arrange until 6τc . Similar behaviour is observed in DEM simulations. In order to remove the effect of crystallisation on the run-out behaviour, a highly polydisperse sample (r = dmax /dmin = 6) is used. The flow kinematics of a dense (relative density Dr = 74%) and a loose (Dr = 22%) granular column with aspect ratio of 0.8 is studied. Figure 4.19 shows the evolution of the normalised run-out with time for dense and loose granular columns with an initial aspect ratio of 0.4. Similar to the previous case, the dense granular column exhibits longer run-out distance (figure 4.19). Figure 4.21a show the evolution of energy with time for dense and loose conditions. The peak kinetic energy in the dense condition is ∼ 20% higher than the loose condition. Due to compaction of grains in loose condition, almost 20% of the normalised initial potential energy available for the collapse is lost in densification due to grain rearrangements in comparison to the dense condition (figure 4.21). The compaction of grains in loose column and the dilation in dense column results in significantly different flow structure, especially at the flow front (figure 4.20). As the loose column densifies, more granular mass is pushed to the flow front resulting in higher vertical effective stress. The loose column exhibits a more parabolic final deposit profile in comparison to the dense column, which shows a triangular deposit at the front. In short columns, only a part of the granular column above the failure surface participates in the flow. However, it appears that the collapse for large aspect ratios mixes two very different dynamics: the first stage shows a large vertical acceleration, while the second stage consists of a “conventional” horizontal granular flows. This section investigates the effect of density on the run-out behaviour of tall columns. Similar to short columns, the dense granular column with an aspect ratio of 6 shows higher run-out distance in comparison to the loose condition. The dense granular column flows almost twice as much as that of the loose column. Unlike short columns, the evolution of run-out is different even at the initial stage of the collapse. The dense granular column, which has higher initial potential energy shows a rapid increase in the run-out due to free-fall and higher mobilised potential energy. During this stage of collapse, the dense granular column has 15 % higher normalised kinetic
4.3 Role of initial grain properties on the collapse of granular columns
0.12
Dense PE Dense KE Loose PE Loose KE
0.8
0.1 0.08
0.6 0.06 0.4 0.04 0.2
0
0.02
0
1
2 3 4 normalised time t/ c
5
6
normalised kinetic energy (Ek/Eo)
normalised potential energy (Ep/Eo)
1
131
0
(a) Evolution of potential and kinetic energy 0.045
Dense KEx Dense KEy Loose KEx Loose KEy
0.07
0.04
normalised kinetic energy (Eky/Eo)
normalised kinetic energy (Ekx/Eo)
0.08
0.035
0.06
0.03
0.05
0.025 0.04 0.02 0.03
0.015
0.02
0.01
0.01 0
0.005 0
1
2 3 4 normalised time t/ c
5
6
0
(b) Effect of kinetic energy Figure 4.18 Effect of density on the energy evolution a = 0.8.
Multi-scale modelling of dry granular flows
132
3
0.9
0.7 2
0.6 Dense run-out Dense height Loose run-out Loose height
1.5
0.5 0.4
1
0.3
normalised height H/L
normalised runout (Lf - Li)/Li
0.8 2.5
0.2 0.5 0.1 0
0
1
2 3 4 normalised time t/ c
5
6
0
Figure 4.19 Effect of density on the run-out evolution a = 0.8 (poly-dispersity r = 6).
(a) Dense initial packing
(b) Loose initial packing Figure 4.20 Snapshots of granular column collapse at t = 6τc (a = 0.8).
4.3 Role of initial grain properties on the collapse of granular columns
0.12
Dense PE Dense KE Loose PE Loose KE
0.8
0.1 0.08
0.6 0.06 0.4 0.04 0.2
0
0.02
0
1
2 3 4 normalised time t/ c
5
6
normalised kinetic energy (Ek/Eo)
normalised potential energy (Ep/Eo)
1
133
0
(a) Evolution of potential and kinetic energy 80
Dense Loose
70
relative density (%)
60 50 40 30 20 10 0
0
1
2
3 4 5 normalised time t/ c
6
7
8
(b) Evolution of packing density Figure 4.21 Effect of density on the evolution of energy and packing fraction a = 0.8 (poly-dispersity ‘r’ = 6).
Multi-scale modelling of dry granular flows
134
energy available for the horizontal push. This results in a longer run-out distance for a dense granular column in comparison to an initially loose granular column. The initial packing fraction and the distribution of kinetic energy in the system has a significant influence on the flow kinematics and the run-out behaviour. The next section will discuss the influence of triggering mechanism and the distribution of the kinetic energy in the granular system on the run-out behaviour.
4.4
Slopes subjected to horizontal excitation
Transient granular flows occur very often in nature. Well-known examples are rockfalls, debris flows, and aerial and submarine avalanches. In the geotechnical context, transient movements of large granular slopes is a substantial factor of risk due to their destructive force and the transformations they may produce in the landscape. Natural granular flows may be triggered as a result of different processes such as gradual degradation induced by weathering or chemical reactions, liquefaction and external forces such as earthquakes. Most contemporary research on granular materials deals with steady-state flow. Transients and inhomogeneous boundary conditions are much less amenable to observation and analysis, and have thus been less extensively studied despite their primary importance in engineering practice. In most cases of granular flow, an initially static pile of grains is disturbed by external forces, it then undergoes an abrupt accelerated motion and spreads over long distances before relaxing to a new equilibrium state. The kinetic energy acquired during destabilisation is dissipated by friction and inelastic collisions. This section investigates the ability of MPM, a continuum approach, to reproduce the evolution of a granular pile destabilised by an external energy source. In particular, a central issue is whether the power-law dependence of run-out distance and time observed with respect to the initial geometry or energy can be reproduced by a simple Mohr-Coulomb plastic behaviour for granular slopes subjected an horizontal excitation. The effects of different input parameters, such as the distribution of energy and base friction, on the run-out kinematics are studied by comparing the data obtained from DEM and MPM simulations.
4.4.1
Numerical set-up
The DEM sample was composed of ∼ 13000 disks with a uniform distribution of diameters by volume fractions (dmax = 1.5dmin ). The mean grain diameter and mass are d ≃ 2.455 mm and m ≃ 0.0123 kg, respectively. The grains are first poured uniformly into a rectangular box of given width and then the right-hand side wall is shifted far to the right to allow the
4.4 Slopes subjected to horizontal excitation
135
7
Dense run-out Loose run-out Dense height Loose height
14
6
12
5
10 4 8 3 6 2
4
1
2 0
normalised height (Hf)/L
normalised runout distance (Lf - Li)/Li
16
0
1
2 3 4 normalised time t/ (H/g)
5
6
0
(a) Effect of density on run-out evolution.
0.9
Normalised potential energy Ep/Ep0
0.4
Dense Ep/E0 Dense Ek/E0 Loose Ep/E0 Loose Ek/E0
0.8
0.35
0.3 0.7 0.25
0.6 0.5
0.2
0.4
0.15
0.3 0.1 0.2 0.05
0.1 0
Normalised kinetic energy Ek/Ep0
1
0
1
2
3
4
5
6
0
Normalised time t/ c (b) Effect of density on energy evolution. Figure 4.22 Effect of density on the run-out behaviour and energy evolution a = 0.6.
136
Multi-scale modelling of dry granular flows
~ 80 d
grains to spread. A stable granular slope of 13.2 ° is obtained when all grains come to rest; see figure 4.23. This procedure leads to a mean packing fraction ≃ 0.82. Soil grains with a mean density of 2600 kg/m3 and internal friction coefficient of 0.4 between grains are considered.
~ 350 d Figure 4.23 Initial geometry and dimensions of the pile subjected to a horizontal excitation.
The initial static pile was set into motion by applying a horizontal gradient velocity v0x (y) = k(ymax − y) with k > 0. The evolution of the pile geometry and the total kinetic energy as a function of the initial input energy E0 is studied. The run-out distance L f is the distance of the rightmost grain, which is still in contact with the main mass when the pile comes to rest. The run-out will be normalised by the initial length L0 of the pile, as in the experiments of collapsing columns. The total run-out duration t f is the time taken by the pile to reach its final run-out distance L f . For grain-scale simulations, classical DEM and Contact Dynamics approaches were used. This research was done in collaboration with Patrick Mutabaruka, University of Montpellier, who performed Contact Dynamics (CD) simulations that are presented in this section. A detailed description of the Contact Dynamics method can be found in Jean (1999); Moreau (1993); Radjai and Dubois (2011); Radjai and Richefeu (2009). The CD method is based on implicit time integration of the equations of motion and a non-smooth formulation of mutual exclusion and dry friction between particles. The CD method requires no elastic repulsive potential and no smoothing of the Coulomb friction law for the determination of forces. For this reason, the simulations can be performed with large time steps compared to discrete element simulations. The unknown variables are particle velocities and contact forces, which are calculated at each time step by taking into account the conservation of momenta and the constraints due to mutual exclusion between particles and the Coulomb friction. An iterative algorithm based on a non-linear Gauss-Seidel scheme is used. The only contact parameters within the CD method are the friction coefficient µ, the normal restitution coefficient εn and the tangential restitution coefficient εt between grains. In MPM simulations, the material point spacing is adopted to be the same as the mean grain diameter in DEM. A mesh size of 0.0125m is adopted with 25 material points per
4.4 Slopes subjected to horizontal excitation
137
cell. The effect of mesh size and the number of material points per cell is investigated in section 4.4.2. The initial configuration of the slope in MPM is shown in figure 4.24a. Frictional boundary conditions are applied on the left and the bottom boundaries by applying constraints to the nodal acceleration. The initial vertical stress of the granular pile in equilibrium, before the horizontal excitation, in the MPM simulation is shown in figure 4.24b. The distribution of the initial gradient horizontal excitation energy of 50 J on the granular pile is shown in figure 4.24c. The Mohr-Coulomb model with no dilation is used to simulate the continuum behaviour of the granular pile. Periodic shear tests using CD (figure 4.25a), reveals a macroscopic friction coefficient of 0.22. The evolution of inertial number with friction is presented in figure 4.25b. The natural units of the system are the mean grain diameter d, the mean grain mass m and acceleration due to gravity g. For this reason, the length scales are normalised by d, time by (d/g)1/2 , velocities by (gd)1/2 and energies by mgd.
4.4.2
Effect of mesh size and number of material points per cell
The accuracy of MPM simulations largely depends on the number of material points representing the continuum. MPM utilises a grid to compute the deformation of a continuum, hence the size of the cells affects the accuracy of the results. Generally in MPM, the number of particles per cell controls the accuracy of the simulation. Guilkey et al. (2003) recommends higher particle density, such as 4 particles per cell, for large deformation problems. Very low particle density will result in non-physical opening of cracks in large deformation simulations. However, a higher value of particle density affects the computational time. Abe et al. (2013) observed that for a coarse mesh, the numerical error decreases with an increase in the number of material points per cell. In contrast, they observed an opposite trend for fine meshes. The influence of numerical noise due to particles crossing the background mesh is not observed in coarse meshes. Coetzee et al. (2005) also found that the numerical error decreases with increase in mesh refinement. In the present study, the effect of mesh size and the number of material points per cell on the run-out behaviour of a static slope subjected to a horizontal excitation is investigated. A mesh size of 0.0125 m is adopted. The number of material points per cell (PPC) is varied as 4, 16, 25, 36, 64, 81 and 100. The effect of the number of material points on the run-out behaviour is presented in figure 4.26. At a low input energy of 50 J, 4 and 16 material points per cell result in a longer run-out distance, whereas the run-out distance converges when the number of PPC is more than 25. However, at a high input energy of 500 J, both 4 and 16 PPC predict almost the
138
Multi-scale modelling of dry granular flows
(a) Initial configuration of material points per cell. 25 material points per cell. Cell size of 0.0125m.
(b) Initial stress in MPM
(c) Initial horizontal velocity for a pile subjected to a horizontal velocity of 50J. Figure 4.24 Initial configuration for the MPM simulation of a pile subjected to horizontal velocities.
4.4 Slopes subjected to horizontal excitation
139
30
0.5
20 ∗
0.4 µ
| σxy | [kPa]
daCruz et al Data
10
0
0.3
0
50
σyy [kPa]
100
150
0.2 0.00
0.05
0.10
0.15
0.20
0.25
I
(a) Evaluation of the critical state friction angle. (b) Evolution of Inertial number with friction µ. Figure 4.25 Periodic shear test using CD (Mutabaruka, 2013).
same run-out distance, but the run-out is higher than the run-out predicted with more than 25 material points per cell. The evolution of the granular pile during the initial stage of flow is shown in figure 4.27 for different numbers of material points per cell. At low input energy, fewer material points per cell results in a larger separation of the spreading mass from the left wall. Distinct shear bands can be observed for more than 16 PPC. The flow structure remains unchanged with increase in PPC of more than 25. At a higher input energy (figure 4.28), almost all cases predict similar flow structure, except in the case of 4 PPC. Figure 4.29 shows the evolution of kinetic energy with time for varying number of material points per cell. At low input energy, the horizontal kinetic energy evolution is identical for all cases. A slightly quicker run-out evolution during the spreading phase can be observed for the case of 4 PPC. However, increase in the number of material points per cell significantly affects the evolution of the vertical kinetic energy Eky . At low energy, a large proportion of the input energy is dissipated in the destabilisation process. This results in material points falling behind the spreading mass to the fill the cavity. Fewer material points per cell results in cell-crossing noise as the material points filling the cavity experience free-fall due to gravity. The effect of cell-crossing noise can be seen in the oscillation of vertical kinetic energy for fewer material points per cell. However, at high input energy, most of the input velocity is dissipated during the spreading process. This means that only a small fraction of energy is available in the vertical component resulting in almost identical behaviour for all cases. Four material points per cell predicts a higher peak vertical kinetic energy in comparison with other case and unlike the low energy case, no oscillations are observed for high input energy. The effect of mesh size on the flow kinematics is studied by comparing two mesh sizes: 0.01 m and 0.0125 m (figure 4.30). It can be observed that the run-out distance converges
Multi-scale modelling of dry granular flows
140
Runout evolution with time for input energy of 50J (mesh size 0.0125m) 1 0.9
normalised runout (Lf-L0)/L0
0.8 0.7
4 MPM points per cell
0.6
16 MPM points per cell
0.5
25 MPM points per cell
0.4
36 MPM points per cell 0.3
64 MPM points per cell 0.2
81 MPM points per cell 0.1
100 MPM points per cell 0 0
0.5
1
1.5
2
2.5
3
time t (s)
(a) E0 = 12.7mgd Runout evolution with time for input energy of 500J (mesh size 0.0125m) 6
normalised runout (Lf-L0)/L0
5
4
4 MPM points per cell 16 MPM points per cell
3
25 MPM points per cell 36 MPM points per cell
2
64 MPM points per cell 1
81 MPM points per cell 100 MPM points per cell
0
0
0.5
1
1.5
2
2.5
3
time t (s)
(b) E0 = 152mgd Figure 4.26 Evolution of run-out with time for varying material points per cell for a slope subjected to a horizontal velocity.
4.4 Slopes subjected to horizontal excitation
141
4 PPC
16 PPC
25 PPC
64 PPC
100 PPC
Figure 4.27 Effect of number of material points on cell on the run-out behaviour E0 = 12.7mgd. Velocity profile (m/s) of granular pile subjected to gradient horizontal loading.
142
Multi-scale modelling of dry granular flows
4 PPC
16 PPC
25 PPC
64 PPC
100 PPC
Figure 4.28 Effect of number of material points on cell on the run-out behaviour E0 = 152mgd. Velocity profile (m/s) of granular pile subjected to gradient horizontal loading.
4.4 Slopes subjected to horizontal excitation
143
Kinetic Energy evolution with time for input energy of 50J (mesh size 0.0125m) 1
0.25
4 MPM points per Cell 16 MPM points per Cell 25 MPM points per Cell 36 MPM points per Cell 64 MPM points per Cell 81 MPM points per Cell 100 MPM points per Cell
0.8
0.2
0.4
0.1
0.2
0.05
KEy/KEi
0.15
KEx/KEi
0.6
0
0 0
0.2
0.4
0.6
0.8
1
time t (s)
(a) E0 = 12.7mgd Kinetic Energy evolution with time for input energy of 500J (mesh size 0.0125m) 1
0.05
4 MPM points per Cell 16 MPM points per Cell 25 MPM points per Cell 36 MPM points per Cell 64 MPM points per Cell 81 MPM points per Cell 100 MPM points per Cell
0.8
0.04
0.4
0.02
0.2
0.01
KEy/KEi
0.03
KEx/KEi
0.6
0
0
0.5
1
1.5
2
2.5
3
0
time t (s)
(b) E0 = 152mgd Figure 4.29 Evolution of kinetic with time for varying material points per cell for a slope subjected to a horizontal excitation.
144
Multi-scale modelling of dry granular flows
with an increase in the number of material points per cell in both cases. Less than 1% difference in the run-out distance is observed between a mesh size of 0.0125 m and 0.01 m. The final run-out duration is almost unaffected by the increase in the number of material points per cell. This shows that the run-out distance is affected by the number of material points per cell. However, the duration of the run-out is independent of the number of material points per cell. The computation time increases with increase in the number of material points per cell and decrease in the mesh size. However, the run-out distance converges with increase in number of material points per cell. Hence, an optimum number of 25 material points per cell is adopted in this case. In summary, for conducting a successful MPM analysis, a careful selection of the mesh size and the number of particles is necessary.
4.4.3
Evolution of pile geometry and run-out
Figure 4.31 shows the initial evolution of the granular slope subjected to an initial horizontal energy E0 = 61 (in dimensionless units) using MPM. As the granular slope is sheared along the bottom, the shear propagates to the top leaving a cavity in the vicinity of the left wall. This cavity gets partially filled as the granular mass at the top collapse behind the flowing mass due to inertia. Similar behaviour is observed during the initial stages of the flow evolution using CD technique (figure 4.32). Due to inertia, the grains at the top of the granular heap roll down to fill the cavity, while the pile continues to spread. The flow involves a transient phase with a change in the geometry of the pile followed by continuous spreading. The gradient of input energy applied to the granular slope mimics a horizontal quake. Despite the creation of a cavity behind the flowing mass, the granular heap remains in contact with the left wall irrespective of the input energy. Figure 4.33a shows the normalised run-out distance (L f − L0 )/L0 and total run-out time t f as a function of the input energy E0 . Two regimes characterised by a power-law relation between the run-out distance and time as a function of E0 can be observed. In the first regime, corresponding to the range of low input energies E0 < 40 mgd, the run-out distance observed varies as L f ∝ (E0 )α with α ≃ 0.206 ± 0.012 over nearly one decade. Overall, the run-out distance predicted by the continuum approach matches the DEM simulations. At very low energies, DEM simulations show longer run-out distance due to local fluidisation. The difference in the run-out between DEM and CD arise mainly from the scales of description and the inelastic nature of Contact Dynamics. Similar behaviour between DEM and CD approaches was observed by Radjai et al. (1997). While the run-out exhibits a power-law relation with the initial input energy, the DEM simulations show that the flow duration remains constant at a value t f ≃ 60 (d/g)0.5 irrespec-
4.4 Slopes subjected to horizontal excitation
145
Variation of final run-out distance and duration with number of material points (50J) 1
1.2
normalised runout (mesh size 0.0125m) normalised time (mesh size 0.0125m) normalised runout (mesh size 0.01m) normalised time (mesh size 0.01m)
0.98
1.18 1.16 1.14
0.94
1.12 1.1
0.92
tf (s)
(Lf-Li)/Li
0.96
1.08 0.9
1.06
0.88
1.04 1.02
0.86 0
10
20
30
40
50
60
70
80
90
1 100
# of particles per cell
(a) E0 = 12.7mgd Variation of final run-out distance and duration with number of material points (500J) 5.2
2.25
normalised runout (mesh size 0.0125m) normalised time (mesh size 0.0125m) normalised runout (mesh size 0.01m) normalised time (mesh size 0.01m)
5.15
5.1
2.2
2.15
2.1
tf (s)
(Lf-Li)/Li
5.05
5 2.05 4.95 2 4.9 1.95
4.85
4.8
0
10
20
30
40
50
60
70
80
90
1.9 100
# of particles per cell (b) E0 = 152mgd Figure 4.30 Evolution of run-out and duration of flow for varying material points per cell for a slope subjected to a horizontal excitation.
146
Multi-scale modelling of dry granular flows
Figure 4.31 MPM simulation of the initial stages of granular pile subjected to a gradient horizontal energy.
4.4 Slopes subjected to horizontal excitation
147
t=0s t = 0.03 s
t = 0.06 s
t = 0.09 s Figure 4.32 CD simulation of the initial stages of granular pile subjected to a gradient horizontal energy. (Mutabaruka, 2013).
Multi-scale modelling of dry granular flows
148
tive of the value of E0 . The constant run-out time, in grain-scale simulations, indicates the collapse of grain into the cavity left behind the pile. An average run-out speed can be defined as vs = (L f − L0 )/t f . According to the data, vs ∝ (E0 )0.52±0.012 . The error on the exponent represents the error due to the linear fit on the logarithmic scale. Since the initial average velocity varies as v0 ∝ (E0 )0.5 , this difference between the values of the exponents suggests that the mobilised mass during run-out declines when the input energy is increased. In the second regime, corresponding to the range of high input energies E0 > 40 mgd, ′ the run-out distance varies as L f ∝ (E0 )α over one decade with α ′ ≃ 0.56 ± 0.04 while ′ the duration increases as t f ∝ (E0 )β with β ′ ≃ 0.33 ± 0.02. Hence, in this regime the average run-out speed varies as vs ∝ (E0 )0.498±0.01 . This exponent is close to the value 0.5 in v0 ∝ (E0 )0.5 , and hence, within the confidence interval of the exponents. In the second regime, both DEM and MPM predict almost the same run-out behaviour. However, MPM predicts longer duration with increase in the input energy. It is worth noting that a similar power-law dependence of the run-out distance and time are found in the case of granular column collapse with respect to the initial aspect ratio. In the column geometry, the grains spread away owing to the kinetic energy acquired during gravitational collapse of the column. Topin et al. (2012) found that the run-out distance varies as a power-law of the available peak kinetic energy at the end of the free-fall stage with an exponent ≃ 0.5. This value of exponent is lower than the run-out evolution observed in the second regime. This is, however, physically plausible since the distribution of kinetic energies at the end of the collapse is more chaotic than in this case where the energy is supplied from the very beginning in a well-defined shear mode. As pointed out by Staron et al. (2005), the distribution of kinetic energies is an essential factor for the run-out distance.
4.4.4
Decay of kinetic energy
The non-trivial evolution of the pile geometry in two regimes suggests that the energy supplied to the pile is not simply dissipated by shear and friction along the bottom plane. It is important to split the kinetic energy into vertical and horizontal components (KEx and KEy ) of the velocity field. Although, the input energy is in the x component, a fraction of the energy is transferred to the vertical component of the velocity field and dissipated during the transient phase. The evolution of kinetic energy is studied to understand the behaviour of granular flow that is consistent with the evolution of the pile shape. The evolution of total kinetic energies Ek with time for different values of the input energy Eki based on MPM simulations are shown in figure 4.34. The MPM simulation shows two distinct regimes in the normalised kinetic energy plot as a function of normalised time in figure 4.34b. However, the DEM simulations (figure 4.35) show that the energy evolution
4.4 Slopes subjected to horizontal excitation
149
normalised runout (Lf-Li)/Li
10
1
0.1
MPM DEM Contact Dynamics (Mutabaruka et al, 2014) 1
10
100
1000
normalised energy E0/(mgd)
(a) Run-out distance as a function of normalised input kinetic energy.
normalised time tf/√(d/g)
1000
DEM CD MPM
100
10
1
10
100
normalised energy E0/(mgd)
1000
(b) Duration of run-out as a function of normalised input kinetic energy. Figure 4.33 Evolution of run-out and time as a function of the normalised input energy for a pile subjected a gradient horizontal energy.
150
Multi-scale modelling of dry granular flows
corresponding to the low energy regime nearly collapse on to a single time evolution. This is consistent with the observation of run-out time t f being independent of the input energy. In contrast, MPM simulations predict a power law relation between the run-out duration and input energy. However, the plots corresponding to the high energy regime (figure 4.34), collapse only at the beginning of the run-out i.e. for t < t1 ≃ 7.5 (d/g)0.5 . Although MPM simulations show a longer duration of run-out (figure 4.34), the total kinetic energy is p p completely dissipated at t = 60 d/g. DEM simulations predict t = 80 d/g for the kinetic energy to be completely dissipated. This is due to grain rearrangement at the free surface (figure 4.36). The granular mass densifies as the flow progresses, after the initial dilation p phase for t = 20 d/g. Figure 4.37 displays the evolution of kinetic energy in the translational (Ex and Ey ) degrees of freedom. Ex decays similar to the total energy dissipation, but Ey increases and passes through a peak before decaying rapidly to a negligible level. The transient is best observed for Ey , which has significant values only for t < t1 . This energy represents the proportion of kinetic energy transferred to the y component of the velocity field due to the destabilisation of the pile and collapse of grains in the cavity behind the pile. Higher proportion of vertical acceleration Eky /E0 is observed for lower values of input energy E0 . This means that, at lower input energies a larger fraction of the energy is consumed in the destabilisation process. Whereas at a higher input energies, most of the energy is dissipated in the spreading phase. For this reason, the total duration t1 of this destabilisation phase is nearly the same in both regimes and its value is controlled by gravity rather than the input energy. The height of the pile being of the order of 80 d, the total free-fall time for a particle located at this height is ≃ 12 (d/g)0.5 , which is of the same order as t1 . DEM simulations show that the contribution of the rotational energy during the transient stage and the spreading stage is negligible. ′ at the end To analyse the second phase for higher input energies, the kinetic energy Ekx0 of the transient phase is considered. This energy is responsible for most of the run-out, hence it is expected to control the run-out distance and time. Figure 4.38 shows the evolution of Ekx ′ as a function of time. The plots have seemingly the same aspect but they normalised by Ekx0 show different decay times. A decay time τ can be defined as the time required for Ekx to decline by a factor 1/2. Figure 4.39 shows the same data in which the time t ′ elapsed since t1 , normalised by τ. Interestingly, now all the data nicely collapse on to a single curve. However, this curve can not be fitted by simple functional forms such as variants of exponential decay. This means that the spreading of the pile is not a self-similar process in agreement with the fact that the energy fades away in a finite time t ′f .
4.4 Slopes subjected to horizontal excitation
151
1000
E=10J E=20J E=30J E=40J E=50J E=60J E=70J E=80J E=90J E=100J E=200J E=300J E=400J E=500J E=600J E=700J E=800J E=900J E=1000J
900 800
Kinetic Energy (Ek)
700 600 500 400 300 200 100 0 0.5
1
1.5 Time (s)
2
2.5
3
(a) Evolution of total kinetic energy with time. 1
E=10J E=20J E=30J E=40J E=50J E=60J E=70J E=80J E=90J E=100J E=200J E=300J E=400J E=500J E=600J E=700J E=800J E=900J E=1000J
0.9
Kinetic Energy (Ek) / Initial Input (Eki)
0.8 0.7 0.6 0.5 0.4 0.3 0.2 0.1 0
0
10
20
30
40
50
60
Time t/ (d/g)
(b) Evolution of normalised kinetic energy with normalised time. Figure 4.34 Evolution of kinetic energy with time (MPM) for a pile subjected to gradient input velocities.
Multi-scale modelling of dry granular flows
152
1.2
E = 10 J E = 20 J E = 30 J E = 40 J E = 50 J E = 60 J E = 70 J E = 80 J E = 90 J E = 100 J E = 200 J E = 300 J E = 400 J E = 500 J E = 600 J E = 700 J E = 800 J E = 900 J E = 1000 J
Kinetic Energy (Ek) / Initial Input (Eki)
1
0.8
0.6
0.4
0.2
0 0
10
20
30
40
50 Time t/ (d/g)
60
70
80
90
100
Figure 4.35 Evolution of normalised kinetic energy with normalised time for a pile subjected to gradient input velocities.
82.5 82
packing density (%)
81.5 81 80.5
DEM E = 500 J
80 79.5 79 78.5
0
20
40 60 normalised time t/ (d/g)
80
Figure 4.36 Evolution of packing density with time E0 = 152mgd (DEM).
100
Normalised horizontal kinetic energy (Ekx) / initial input (Eki)
4.4 Slopes subjected to horizontal excitation
153
1 E=10J E=20J E=30J E=40J E=50J E=60J E=70J E=80J E=90J E=100J E=200J E=300J E=400J E=500J E=600J E=700J E=800J E=900J E=1000J
0.9 0.8 0.7 0.6 0.5 0.4 0.3 0.2 0.1 0 0
20
40
60
80
100
120
140
Normalised time t/ (d/g)
Normalised vertical kinetic energy (Eky) / initial input (Eki)
(a) Evolution of normalised horizontal kinetic energy with time. 0.14 E=10J E=20J E=30J E=40J E=50J E=60J E=70J E=80J E=90J E=100J E=200J E=300J E=400J E=500J E=600J E=700J E=800J E=900J E=1000J
0.12
0.1
0.08
0.06
0.04
0.02
0
0
5
10
15
20
25
30
Normalised time t/ (d/g)
(b) Evolution of normalised vertical kinetic energy with time. Figure 4.37 Evolution of vertical and horizontal kinetic energy with time (MPM) for a pile subjected to gradient input velocities.
Multi-scale modelling of dry granular flows
154
Normalised horizontal kinetic energy (Ekx) / (E’kxo)
1 E=10J E=20J E=30J E=40J E=50J E=60J E=70J E=80J E=90J E=100J E=200J E=300J E=400J E=500J E=600J E=700J E=800J E=900J E=1000J
0.9 0.8 0.7 0.6 0.5 0.4 0.3 0.2 0.1 0 0
20
40
60
80
100
120
140
Normalised time t’/ (d/g)
Figure 4.38 Evolution of kinetic energy in the x component of the velocity field normalised by the available kinetic energy at the end of the transient phase as a function of time elapsed since the same instant (MPM).
The scaling of the data with the decay time τ suggests that the run-out time, since the beginning of the second phase, t ′f might be a simple function of τ. Figure 4.40a shows both t ′f ′ , where a power-law relation can be observed for both time scales. and τ as a function of Ex0 ′ )β ′ has the same exponent β ′ ≃ 0.33 ± 0.02 as t as a function of The run-out time t ′f ∝ (Ex0 f ′ )β ′′ with β ′′ ≃ 0.38 ± 0.03. The relation between E0 . For the decay time we have τ ∝ (Ex0 the two times can thus be expressed as (figure 4.40b) ′ β t ′f = k τ (Ex0 )
′′ −β ′
,
(4.13)
where k ≃ 5.0 ± 0.4 and β ′′ − β ′ ≃ 0.05 ± 0.05. This value is small enough to be neglected. It is therefore plausible to assume that the run-out time is a multiple of the decay time and ′ the spreading process is controlled by a single time. A weak dependence on the energy Ekx0 is consistent with the fact that the energy available at the beginning of the second phase is not dissipated in the spreading process (calculated from the position of the tip of the pile) since the pile keeps deforming by the movements of the grains at the free surface even when
Normalised horizontal kinetic energy (Ekx) / initial input (Ekxo)
4.4 Slopes subjected to horizontal excitation
155
1
E=10J E=20J E=30J E=40J E=50J E=60J E=70J E=80J E=90J E=100J E=200J E=300J E=400J E=500J E=600J E=700J E=800J E=900J E=1000J
0.8
0.6
0.4
0.2
0 0
1
2
3
4
5
Normalised time t/
Figure 4.39 Evolution of kinetic energy in the x component of the velocity field normalised by the available kinetic energy at the end of the transient as a function of normalised time (MPM).
Multi-scale modelling of dry granular flows
156
the tip comes to rest. This can explain the small difference between the two exponents as observed here.
4.4.5
Effect of friction
The run-out distance, duration of flow, and the dissipation of kinetic energy are controlled by the input energy and collective dynamics of the whole pile. However, the run-out behaviour is also expected to depend on the base friction. A series of simulations with different values of base friction was performed using MPM to analyse the influence of friction on the run-out behaviour. The influence of friction on the run-out behaviour for different input energies is shown in figure 4.41a. The run-out distance decreases with increase in the basal friction. The exponent of the power-law relation between the run-out and input energy has a weak dependence on the base friction, however, the proportionality constant is affected by the change in the base friction. This behaviour is similar to that observed in granular column collapse with varying initial properties (Balmforth and Kerswell, 2005; Lajeunesse et al., 2005). CD simulations using different values of coefficient of restitution show no difference in the run-out behaviour. At large input energies, the pile remains in a dense state so that multiple collisions inside the pile occur at small time scales compared to the deformation time. When the restitution coefficients are increased, more collisions occur during a longer time interval but the overall energy dissipation rate by collisions remains the same. This effect is a seminal example of collective effects which erase the influence of local parameters at the macroscopic scale. In contrast to the restitution coefficients, the effect of friction coefficient is quite important for the run-out. MPM simulations with varying friction coefficient show that, both the run-out distance and the decay time decrease as the friction coefficient is increased. This effect is much more pronounced at low values of the friction coefficient. The run-out time, for example, is reduced by a factor of approximately 4 as µs is increased from 0.1 to 0.2 while the change in the run-out and duration is less affected with increase in friction coefficient. This “saturation effect” can be observed in a systematic way in simple shear tests. The dissipation rate may reach a saturation point where the dilation of granular materials and rolling of the grains change in response to increase in friction coefficient (Estrada et al., 2008).
Effect kinetic energy distribution Staron et al. (2005) observed that the distribution of kinetic energy in the granular system is an essential factor for the run-out distance. In order to understand the influence of energy
4.4 Slopes subjected to horizontal excitation
157
Normalised time t’/√(d/g)
1000
t’/√(d/g) τ/√(d/g)
100
10
1
10
100
Normalised energy Ekx / mgd
1000
′ . (a) Power law evolution of t ′f and τ as a function of kinetic energy Ekx0
Normalised time t’/√(d/g)
100
10
10
100
Normalised time τ/√(d/g)
1000
(b) Linear relationship between decay time and run-out time after the transient as a function of the normalised kinetic energy Ekx0 . Figure 4.40 Decay time and run-out time as a function of the normalised kinetic energy Ekx0 .
Multi-scale modelling of dry granular flows
158
normalised runout (Lf-Li)/Li
100
10
1
0.1
MPM Base friction 0.1 MPM Base friction 0.2 MPM Base friction 0.3 MPM Base friction 0.4 1
10
100
normalised energy E0/(mgd)
1000
(a) Effect of friction on the run-out distance
normalised time tf/√(d/g)
1000
100
10
MPM Base friction 0.1 MPM Base friction 0.2 MPM Base friction 0.3 MPM Base friction 0.4 1
10
100
normalised energy E0/(mgd)
1000
(b) Effect of friction on the duration of run-out. Figure 4.41 MPM simulations of effect of friction on the run-out behaviour of slopes subjected to horizontal excitation.
4.4 Slopes subjected to horizontal excitation
159
distribution on the run-out behaviour, granular pile subjected to two different velocity fields are studied. A uniform velocity Vxo (y) = V0 is applied to the entire pile, in contrast to the gradient horizontal velocity. Snapshots of flow kinematics at initial stages are shown in figure 4.42 (MPM simulations) and figure 4.43 (DEM). It can be observed from the figures that the continuum behaviour is identical to that of grain-scale simulations. As each grain experiences the same velocity, grains located at the top of the slope are pushed farther away and unlike the gradient input velocity, the cavity left behind the granular mass is not filled by the soil grains at the top. Figure 4.44a shows the influence of velocity distribution on the run-out behaviour. At low input energy, the gradient velocity distribution shows significantly longer run-out in comparison to uniform velocity distribution. Section 4.4.4 shows that at low input energies a larger fraction of the energy is consumed in the destabilisation process. This means that the amount energy available for flow is less in uniform velocity distribution than the gradient velocity profile, this energy is even smaller as the initial velocity is distributed uniformly throughout the granular mass. However at higher input energy, where most of the energy is dissipated during the spreading phase, the run-out distance has a weak dependence on the distribution of velocity in the granular mass. The duration of the flow shows similar behaviour to the run-out, however, a slope subjected to a gradient velocity flows quicker than a slope subjected to a uniform horizontal velocity. The gradient velocity distribution provides more input energy at the initial stage to overcome the frictional resistance at the base. This shows that the material property and the distribution of kinetic energy in the system has a non-trivial influence on the flow kinematics and the internal flow structure.
4.4.6
Comparison with granular column collapse
Figure 4.45 shows the run-out behaviour of granular column collapse and the slope subjected to horizontal excitations as a function of normalised kinetic energy. In the case of column collapse, the peak energy at τc is used as the energy available for the flow. It can be observed that MPM and DEM predict similar run-out behaviour for low energy regime (short columns), which undergo frictional failure along the flanks. However MPM predicts longer run-out for high energy regime (corresponding to a > 2.7), where the granular column experiences significant collisional dissipation. The lack of a collisional energy dissipation mechanism in MPM results in over prediction of run-out distances. In the case of granular column subjected to horizontal velocity, the dissipation is friction and MPM is able to predict the run-out response in good agreement with DEM simulations. At very low energy, DEM simulations show longer run-out in the case of slope subjected to excitations due to local destabilisation at the flow front. Both granular flows, column collapse and slope subjected to horizontal
160
Multi-scale modelling of dry granular flows
t=0s
t = 0.03 s
t = 0.06 s
t = 0.09 s
Figure 4.42 Snapshots of MPM simulations of the evolution of granular pile subjected to a gradient horizontal energy E0 = 61 mgd.
4.4 Slopes subjected to horizontal excitation
161
Figure 4.43 Snapshots of DEM simulations of the evolution of granular pile subjected to a gradient horizontal energy E0 = 61 mgd.
Multi-scale modelling of dry granular flows
162
normalised runout (Lf-Li)/Li
10
1
0.1
MPM Gradient Energy MPM Uniform Energy 1
10
100
normalised energy E0/(mgd)
1000
(a) Run-out distance as a function of normalised input kinetic energy.
normalised time tf/√(d/g)
1000
100
10
MPM Gradient Energy MPM Uniform Energy 1
10
100
normalised energy E0/(mgd)
1000
(b) Duration of run-out as a function of normalised input kinetic energy. Figure 4.44 Effect of input velocity distribution on the run-out behaviour of slopes subjected to horizontal velocities.
4.5 Summary
163
excitation, show power-law relation with the energy. This shows that the power-law behaviour is a granular flow characteristic.
normalised runout (Lf-Li)/Li
100
n olum c M
MP
10
olumn
DEM c
1
0.1 0.01
MPM column DEM column MPM slope impact DEM slope impact 0.1
normalised energy E/Ep0
1
10
Figure 4.45 Comparison of the normalised run-out between the collapse of granular columns and granular slope subjected to horizontal loading.
4.5
Summary
Multi-scale simulations of dry granular flows were performed to capture the local rheology, and to understand the capability and limitations of continuum models in realistic simulation of granular flow dynamics. Previous studies on granular collapse have shown a power-law dependence between the run-out and the initial aspect ratio of the column. The change in the run-out behaviour for tall columns has remained unexplained. Continuum approach predict longer run-out distance, however, the reason for this behaviour was still lacking. Most studies were focused on mono-disperse grain sizes. In the present study, multi-scale simulations of granular column collapse are performed. Studies on the role of initial packing density and a poly-disperse sample on the run-out behaviour are also performed. The following conclusions can be derived based on MPM and DEM simulations of granular column collapse:
164
Multi-scale modelling of dry granular flows • Both DEM and MPM simulations show a power-law dependence of the run-out and time with the initial aspect ratio of the column. • A continuum approach, such as MPM, with a simple frictional dissipation model is able to capture the flow kinematics of dry granular collapse for short columns. The collapse of a short column is a frictional dissipation process. • DEM simulations reveal collisional dissipation mechanism in the initial stage of collapse of tall columns. • MPM simulations show longer run-out behaviour in the case of tall columns. MPM simulation assumes that the total initial potential energy stored in the system is completely dissipated through friction over the entire run-out distance. The lack of collisional dissipation in MPM results in longer run-outs for tall columns. • The initial configuration and the material properties have a significant influence on the run-out behaviour. The run-out distance increases with increase in density of granular packing. This effect is significant in the case of tall columns. • DEM simulations with different initial packing shows evolution of packing density with time. Hence it is important to consider macroscopic parameters like packing fraction and dilatancy behaviour, which are due to meso-scale grain arrangements, when modelling the granular system as a continuum.
Natural granular flows are triggered by different mechanisms. The distribution of kinetic energy in the granular mass is found to have an effect on the flow kinematics. A multi-scale analyses of a granular slope subjected to horizontal velocities are performed and the following conclusions are derived: • A power-law dependence of the run-out distance and time as a function of the input energy is observed. The power-law behaviour is found to be a generic feature of granular flow dynamics. • The values of the power-law exponents are not simple functions of the geometry. • Two regimes with different values of the exponents: a low-energy regime and a high-energy regime are observed. • The low energy regime reflects mainly the destabilisation of the pile, with a run-out time independent of the input energy.
4.5 Summary
165
• The second regime is governed by the spreading dynamics induced by higher input energy. The evolution of granular slope in the high-energy regime can be described by a characteristic decay time, which is the time required for the input energy to decay by a factor of 0.5. • The run-out distance and the decay time decrease as the friction increases. This effect is much more pronounced at low values of friction. • At low input energy, the distribution of kinetic energy in the system is found have a significant effect on the run-out, as the energy is mostly consumed in the destabilisation process. • At higher input energy, where most of the energy is dissipated during the spreading phase, the run-out distance has a weak dependence on the distribution of velocity in the granular mass. • The duration of the flow shows similar behaviour to the run-out, however, a slope subjected to a gradient velocity flows quicker than a slope subjected to a uniform horizontal velocity. • The material property and the distribution of kinetic energy in the system has a nontrivial influence on the flow kinematics and the internal flow structure. • MPM is successfully able to simulate the transient evolution with a single input parameter, the macroscopic friction angle. This study exemplifies the ability of MPM, a continuum approach, in modelling complex granular flow dynamics and opens the possibility of realistic simulation of geological-scale flows on complex topographies.
Chapter 5 Numerical modelling of fluid–grain interactions 5.1
Fluid simulation using the lattice Boltzmann method
Grain–fluid systems can be found in many scientific and engineering applications, such as suspensions, fluidised beds, sediment transport, and geo-mechanical problems. In general, the fundamental physical phenomena in these systems are not well understood mainly due to the intricate complexity of grain–fluid interactions and the lack of powerful analysis tools (Han et al., 2007a). In addition to the interactions amongst soil grains, the motion of soil grains is mainly driven by gravity and the hydrodynamic force exerted by the fluid. The fluid flow pattern can be significantly affected by the presence of soil grains and this often results in a turbulent flow. Hence, the development of an effective numerical framework for modelling both the fluid flow patterns and the grain–fluid interactions is very challenging. Development of a numerical framework depends crucially on the size of the soil grains relative to the domain/mesh size (Feng et al., 2007). Traditionally, the Navier-Stokes equation is solved by a grid-based Computational Fluid Dynamics (CFD) method (Tsuji et al., 2007), such as the Finite Volume Method, FVM, (Capecelatro and Desjardins, 2013) or a mesh-free technique such as Smooth Particle Hydrodynamics (SPH) (Sun et al., 2013). The grid size in FVM or the smooth length in SPH for discretisation of the Navier-Stokes equation is at least an order of magnitude larger than the grain diameter (Xiong et al., 2014), thus ignoring the micro-scale interactions. In situations where the average domain concentration phase is far from dilute, the computational effort is mostly devoted to the grain dynamics. The hydrodynamic forces on the soil grains are applied based on an empirical relation using the domain-averaged local
168
Numerical modelling of fluid–grain interactions
porosity of the soil grains in the grid. As a result, developing a fast fluid hydrodynamics solver is unimportant for dense flows. However, most geo-mechanical problems involve complex interactions between the solid and the fluid phase. This requires accurate modelling of the fluid flow pattern. Additionally, geophysical problems, such as submarine landslides and debris flow have a relatively large simulation domain, which requires parallel computation. Implementation of traditional grid-based CFD methods faces great challenges on multiprocessor systems (Xiong et al., 2014). Although mesh-free approaches are free from the problem of parallel scalability, their modelling accuracy and speed are relatively low when compared to grid-based CFD methods. Therefore, an accurate, fast and a highly scalable scheme is required to model fluid - grain systems in geo-mechanics. The Navier-Stokes equation describes the motion of a non-turbulent Newtonian fluid. The equation is obtained by applying Newton’s second law to the fluid motion, together with an assumption that the fluid stress is the sum of the viscous term, proportional to the gradient of the velocity, and the pressure term. Conventional CFD methods compute pertinent flow fields, such as velocity u and pressure p, by numerically solving the Navier-Stokes equation in space x and time t. Alternatively, the transport equation or the Boltzmann equation, which deals with a single particle distribution function f (x, ξ ,t) in phase space (x, ξ ) and time t, can be used to solve various problems in fluid dynamics. The Lattice Boltzmann Method (LBM) (Chen and Doolen, 1998; Han et al., 2007b; He and Luo, 1997a,b; Mei et al., 2000; Zhou et al., 2012) is an alternative approach to the classical Navier-Stokes solvers for fluid flows. LBM works on an equidistant grid of cells, called lattice cells, which interact only with their direct neighbours. In LBM, the discretisation of continuum equations is based on microscopic models and mesoscopic continuum theories. LBM is a special discretising scheme of the Boltzmann equation where the particle distribution functions (mass fractions) collide and propagate on a regular grid. The important aspect, however, is the discretisation of the velocity, which means that the particle velocities are restricted to a predefined set of orientations. The theoretical premises of the LB equation are that (1) hydrodynamics is insensitive to the details of microscopic physics, and (2) hydrodynamics can be preserved so long as the conservation laws and associated symmetries are respected in the microscopic and mesoscopic level. Therefore, the computational advantages of LBM are achieved by drastically reducing the particle velocity space ξ to only a very few discrete points without seriously degrading the hydrodynamics (Mei et al., 2000). This is possible because LBM rigorously preserves the hydrodynamic moments of the distribution function, such as mass density and momentum fluxes, and the necessary symmetries (He and Luo, 1997a,b). LBM has evolved as a
5.1 Fluid simulation using the lattice Boltzmann method
169
comprehensive fluid solver and its theoretical aspects link well with the conventional central finite difference scheme (Cook et al., 2004).
5.1.1
Formulation
LBM is a ‘micro-particle’ based numerical time-stepping procedure for the solution of incompressible fluid flows. Consider a 2D incompressible fluid flow with density ρ and kinematic viscosity v, in a rectangular domain D. The fluid domain is divided into rectangular grids or lattices, with the same grid length ‘h’ in both x- and y-directions (see figure 5.1).
Figure 5.1 The Lattice Boltzmann discretisation and the D2Q9 scheme: (a) a standard LB lattice and histogram views of the discrete single particle distribution function/direction-specific densities fi ; (b) D2Q9 model.
These lattices are usually classified in the literature using the DαQβ -notation, where α denotes the space dimensionality and β is the number of discrete velocities (but also including the possibility of having particles at rest) within the momentum discretisation. The most common lattices are the D2Q9 and the D3Q19-models, see He et al. (1997). The present study focuses on two-dimensional problems, hence the D2Q9 momentum discretisation is adopted.
Numerical modelling of fluid–grain interactions
170
LBM discretises the Boltzmann equation in space to a finite number of possible particle spatial positions, microscopic momenta, and time. Particle positions are confined to the lattice nodes. The fluid particles at each node are allowed to move to their eight intermediate neighbours with eight different velocities ei (i = 1 , . . . , 8). A particle can remain at its own node, which is equivalent to moving with zero velocity eo . The particle mass is uniform, hence these microscopic velocities and momentum are always effectively equivalent (Han et al., 2007b). Referring to the numbering system shown in figure 5.1, the nine discrete velocity vectors are defined as e0 = (0, 0); (5.1) e1 = c(1, 0); e2 = c(0, 1); e3 = c(−1, 0); e4 = c(0, −1); e5 = c(1, 1); e6 = c(−1, 1); e7 = c(−1, −1); e8 = c(1, −1) , where C is the lattice speed that is defined as c = h/∆t , and ∆t is the discrete time step. The primary variables in LB formulation are called the fluid density distribution functions, fi , each representing the probable amount of fluid particles moving with the velocity ei along the direction i at each node. The macroscopic variables are defined as functions of the particle distribution function (see figure 5.1) β −1 ρ = (macroscopic fluid density) ∑ fi i=0 and β −1 → → − u = ρ1 ∑ fi − ei (macroscopic velocity) ,
(5.2)
i=0
where i ∈ [0, β − 1] is an index spanning the discretised momentum space. There are nine fluid density distribution functions, fi (i = 0, . . . , 8), associated with each node in the D2Q9 model. The evolution of the density distribution function at each time step for every lattice point is governed by 1 fi (x + ei ∆t,t + ∆t) = fi (x,t) − [fi (x,t) − fi eq (x,t)] (i = 0, . . . , 8) , τ
(5.3)
where for any grid node x, x + ei ∆t is its nearest node along the direction i. τ is a nondimensional relaxation time parameter, which is related to the fluid viscosity; and fi eq is
5.1 Fluid simulation using the lattice Boltzmann method
171
termed as the equilibrium distribution function that is defined as eq 3 f0 = w0 ρ(1 − 2c2 v.v)
and fi eq = wi ρ(1 + 32 ei .v 92 (ei .v)2 − 32 v.v) (i = 0, . . . , 8) , c 2c 2c
(5.4)
in which, wi represents the fixed weighting values: w0 =
4 , 9
w1,2,3,4 =
1 , 9
and w5,6,7,8 =
1 . 36
(5.5)
The right-hand side of eq. 5.3 is often denoted as fi (x, t+ ) and termed the post collision distribution. LBM ensures conservation of total mass and total momentum of the fluid particles at each lattice node (see eq. 5.3). The lattice Boltzmann model consists of two phases: collision and streaming. The collision phase computed in the right-hand side of eq. 5.3 involves only those variables that are associated with each node x, and therefore is a local operation. The streaming phase then explicitly propagates the updated distribution functions at each node to its neighbours x + ei ∆t, where no computations are required and only data exchange between neighbouring nodes are necessary. These features, together with the explicit time-stepping nature and the use of a regular grid, make LB computationally efficient, simple to implement and easy to parallelise (Han et al., 2007b). The streaming step involves the translation of the distribution functions to their neighbouring sites according to the respective discrete velocity directions, as illustrated in figure 5.2 in the D2Q9 model. The collision step, (see figure 5.3) consists of re-distribution the local discretised Maxwellian equilibrium functions in such a way that local mass and momentum are invariant. In incompressible flows, energy conservation is equivalent to momentum conservation (He et al., 1997). The standard macroscopic fluid variables, such as density ρ and velocity v, can be recovered from the distribution functions as 8
ρ = ∑ fi , i=0
8
and ρv = ∑ fi ei .
(5.6)
i=0
The fluid pressure field ‘p’ is determined by the equation of state p = cs 2 ρ,
(5.7)
172
Numerical modelling of fluid–grain interactions
streaming
Figure 5.2 Illustration of the streaming process on a D2Q9 lattice. The magnitude of the distribution functions remains unchanged, but they move to a neighbouring node according to their direction.
collision
Figure 5.3 Illustration of the collision process on a D2Q9 lattice. The local density ρ and velocity v are conserved, but the distribution functions change according to the relaxation to local Maxwellian rule.
5.1 Fluid simulation using the lattice Boltzmann method
173
where cs is termed the fluid speed of sound and is related to the lattice speed c as √ cs = c/ 3 .
(5.8)
The kinematic viscosity of the fluid v is implicitly determined by the model parameters h, ∆t and τ as 1 1 h2 1 1 v = (τ − ) = (τ − )Ch, (5.9) 3 2 ∆t 3 2 which indicates that these three parameters are related to each other and have to be appropriately selected to represent the correct fluid viscosity. An additional constraint to the parameter selection is the lattice speed c, which must be sufficiently large in comparison to the maximum fluid velocity vmax , to ensure accuracy of the solution. The ‘computational’ Mach number, Ma , defined as vmax . (5.10) Ma = c Theoretically, for an accurate solution, the Mach number is required to be 90), which shows the ability of the LBM turbulence model to capture instabilities in fluid flow. One important quantity taken into account in the present analysis is the Strouhal number St, a dimensionless number describing oscillating unsteady flow dynamics. The Strouhal number is computed from the cylinder diameter D, the measured frequency of the vortex
5.3 Turbulence in lattice Boltzmann method
187
(a) Re = 55
(b) Re = 75
(c) Re = 112 Figure 5.12 Development of Kármán vortex street around a circular obstacle, for different Reynolds number.
Numerical modelling of fluid–grain interactions
188
shedding f, and the maximum velocity Umax at the inflow plane: St =
fD . Umax
(5.44)
The characteristic frequency f is determined by a spectral analysis (Fast Fourier Transform FFT) of time series of the fluid pressure. Table 5.2 shows that the Strouhal numbers computed from LBM simulations have a very good agreement with FVM results obtained by Breuer et al. (2000). This shows the ability of LBM-LES in capturing unsteady flow dynamics. Table 5.2 Computed Strouhal number for fluid flows with different Reynolds number.
Reynolds number 55 75 112 *
5.4
Strouhal number LBM
FVM
0.117 0.128 0.141
0.117 0.129 0.141
FVM results are from Breuer et al. (2000)
Coupled LBM and DEM for fluid-grain interactions
Modelling fluid–grain interactions in submarine landslides requires the ability to simulate the interactions at the dynamic fluid – solid boundaries. In principle, the conventional FE and FVM based approaches for solving the Navier-Stokes equations with moving boundaries and/or structural interaction (Bathe and Zhang, 2004) can be applied to particle fluid interaction problems. The common feature of these approaches is to model the interaction between the fluid and the solid to a high degree of accuracy. However, the main computational challenge is the need to continuously generate new geometrically adapted meshes to circumvent severe mesh distortion, which is computationally very intensive (Han et al., 2007b). The lattice Boltzmann approach has the advantage of accommodating large particle sizes and the interaction between the fluid and the moving grains can be modelled through relatively simple fluid - grain interface treatments. Further, employing DEM to account for the grain/grain interaction naturally leads to a combined LB – DEM solution procedure. The Eulerian nature of the lattice Boltzmann formulation, together with the common explicit time step scheme of both LBM and DEM makes this coupling strategy an efficient numerical procedure for the simulation of fluid – grain systems.
5.4 Coupled LBM and DEM for fluid-grain interactions
189
LBM – DEM technique is a powerful predictive tool for gaining insights into many fundamental physical phenomena in fluid-solid systems. Such a coupled methodology was first proposed by (Cook et al., 2004) for simulating fluid-grain systems dominated by fluidgrain and grain-grain interactions. To capture the actual physical behaviour of the fluid-grain system, it is essential to model the boundary condition between the fluid and the grain as a non-slip boundary condition, i.e. the fluid velocity near the grain should be similar to the velocity of the grain boundary. The soil grains in the fluid domain are represented by lattice nodes. The discrete nature of the lattice will result in stepwise representations of the surfaces, which are otherwise circular, this is neither accurate nor smooth, unless sufficiently small lattice spacing is adopted. Modified bounce back rule To accommodate the movement of solid particles in the commonly adopted bounce-back rule (see section 5.1.3), Ladd (1994) modified the ‘no-slip’ rule for a given boundary link i to be fi (x,t + ∆t) = fi (x,t+ ) − αi ei .vb
(αi = 6wi ρ/γs2 ) ,
(5.45)
where fi (x,t+ ) is the post collision distribution at the fluid or solid boundary node x, and vb is the velocity at the nominal boundary point at the middle of the boundary link i vb = vc + ω × (x + ei ∆t/2 − xc ) ,
(5.46)
in which vc and ω are the translational and angular velocities at the mass centre of the solid particle, respectively. xc and x + ei ∆t/2 are the coordinates of the centre and the nominal boundary point, respectively. The impact force on the soil grain from the link is defined as Fi = 2[fi (x,t+ ) − αi ei .vb ]/∆t .
(5.47)
The corresponding torque Ti , produced by the force with respect to the centre of the particle is computed as Ti = rc × Fi (rc = x + ei ∆t/2 − xc ) . (5.48) Then the total hydrodynamic force and torque exerted on the particle can be calculated by summing up the forces and torques from all the related boundary links: F = ∑ Fi i
T = ∑ Ti . i
(5.49)
Numerical modelling of fluid–grain interactions
190
Ladd and Verberg (2001) described a methodology that minimises the oscillations resulting from soil grains crossing lattices at a very high speed. The methodology involves combining several extensions for the fluid simulation like the treatment of moving curved boundaries with the scheme of Yu et al. (2003) and a fluid/grain force interaction method with the momentum exchange method of Ladd and Verberg (2001). The simulation of the moving curved grain surfaces results in the intersection of links between two nodes at arbitrary distances (Iglberger et al., 2008). These distance values are referred to as delta values: δ=
Distance between fluid node and soil surface ∈ [0, 1] . Distance between fluid node and soil node
(5.50)
For each pair of a fluid and grain node, a delta value has to be calculated. Delta values of zero are not possible as the nodes on the surface are considered as solid nodes. The algorithm for computation of the δ value is presented in Iglberger et al. (2008). Figure 5.13 shows the three possible situations for delta values between 0 and 1. The fluid particles in LBM are always considered to be moving at the rate of one lattice per time step (δ x/δ t), for delta values smaller than 0.5. For δ values larger than 0.5, the fluid particles would come to rest at an intermediate node xi . In order to calculate the reflected distribution function in node xf , an interpolation scheme has to be applied. The linear interpolation scheme of Yu et al. (2003) is used in the present study, which uses a single equation, irrespective of the value of δ being smaller or larger than 0.5, to the reflected distribution function that is computed as fα (xf ,t + δt) =
1 · [(1 − δ ) · fα (xf ,t + δt) + δ · fα (xb ,t + δt) 1+δ 3 + δ · fα (xf2 ,t + δt) − 2wa ρw 2 ea · uw ] , γ
(5.51)
where wα is the weighting factor, ρw is the fluid density in node xf , and uw is the velocity at the bounce-back wall. In order to couple the fluid-grain interaction, the LBM approach is extended by adopting a force integration scheme, to calculate the fluid force acting on the grain surface, and the momentum exchanged method described earlier. The physical force acting on grain agglomerates is calculated as the sum over all fluid/grain node pairs, resulting in F=∑
19
∑ eα [fα (xb,t) + fα (x f ,t)]δ x/δt .
(5.52)
xb α=1
After the force calculations, the coupled rigid body physics can be simulated in order to move the grains / grain-agglomerates according to the applied forces. The total hydrodynamic forces and torque exerted on a grain can be computed as (Cook et al., 2004; Noble and
5.4 Coupled LBM and DEM for fluid-grain interactions
191
Torczynski, 1998) F f = Ch[∑ (βn ∑ fi m ei )] n
(5.53)
i
T f = Ch[∑ (xn − xγ ) × (βn ∑ fi m ei )] . n
(5.54)
i
The summation is over all lattice nodes covered by the soil grain, and xn represents the coordinate of the lattice node n. When grains are not in direct contact among themselves, but are driven by the fluid flow and body force, i.e. gravity, their motion can be determined by Newton’s equation of motion ma = F f + mg J θ¨ = T f ,
(5.55) (5.56)
where m and J are respectively the mass and the moment of inertia of a grain, θ¨ is the angular acceleration, g is the gravitational acceleration, F f and T f are respectively the hydrodynamic forces and torque. The equation can be solved numerically by an explicit numerical integration, such as the central difference scheme. The interaction between the soil grains, and the soil grains with the walls are modelled using the DEM technique. To solve the coupled DEM–LBM formulation, the hydrodynamic force exerted on soil grains and the static buoyancy force are considered by reducing the gravitational acceleration to (1 − ρ/rhos )g, where ρs is the density of the grains. When taking into account all forces acting on an element, the dynamic equations of DEM can be expressed as ma + γv = Fc + F f + mg , (5.57) where Fc denotes the total contact forces from other elements and/or the walls, and γ is a damping coefficient. The term cv represents a viscous force that accounts for the effect of all possible dissipation forces in the system including energy lost during the collision between grains. Considering a linear contact model Fc = kn δ ,
(5.58)
where kn is the normal stiffness and δ is the overlap, the critical time step associated with the explicit integration is determined as (He et al., 1997) q ∆tcr = 2( 1 + ξ 2 − ξ )/ω ,
(5.59)
192
Numerical modelling of fluid–grain interactions
Figure 5.13 LBM bounce back boundaries for different values of δ .
5.4 Coupled LBM and DEM for fluid-grain interactions
193
p where ω = kn /m is the local contact natural frequency and ξ = γ/2mω is the critical damping ratio. The actual time step used for the integration of the Discrete Element equations is ∆tD = λ ∆tcr . (5.60) The time step factor λ is chosen to be around 0.1 to ensure both stability and accuracy (He et al., 1997). When combining the Discrete Element modelling of the grain interactions with the LB formulation, an issue arises. There are now two time steps: ∆t for the fluid flow and ∆tD for the particles. Since ∆tD is normally smaller than ∆t, ∆tD is slightly reduced to a new value ∆ts so that ∆t and ∆ts have an integer ratio ns ∆ts =
∆t ns
(ns = [∆t/∆tD ] + 1) .
(5.61)
This results in a sub-cycling time integration for the Discrete Element part. At every step of the fluid computation, ns sub-steps of integration are performed for the Discrete Element Method (5.57) using the time step ∆ts . The hydrodynamic force F f is unchanged during the sub-cycling.
5.4.1
Draft, kiss and tumbling: Sedimentation of two grains
In multiphase flows, the fundamental mechanisms of fluid – grain and grain – grain interactions are very important for accurately predicting the flow behaviours. The sedimentation of two circular grains in a viscous fluid serves as the simplest problem to study these two types of interactions, and many experimental and numerical studies have been carried out to investigate this behaviour (Komiwes et al., 2005; Wang et al., 2014). Fortes (1987) observed experimentally that in the sedimentation of two grains under gravity in a Newtonian fluid, the two grains would undergo the draft, kiss and tumbling (DKT) phenomenon. The draft: grain 2 is first placed within the hydrodynamic drag above grain 1. As the hydrodynamic drag of grain 1 is a depression zone, grain 2 is attracted inside. The kiss: grain 2 increases its vertical velocity until it touches grain 1. The horizontal velocity of grain 1 increases and its vertical velocity decreases below that of grain 2. Tumbling: grain 2 having the same horizontal velocity and higher vertical velocity than grain 1, overtakes grain 1. LBM-DEM simulation of two grains under gravity in a viscous Newtonian fluid reproduces the draft, kiss and tumble effect (see figure 5.14). They are in agreement with the experimental description of the DKT effect. For better understanding of the DKT effect, the time history of three distances between the grains (normalised to the diameter of the grain D)
194
Numerical modelling of fluid–grain interactions
are tracked i.e., the difference in the transverse coordinates δx /D and longitudinal q coordinates
δy /D of the two grain centres, and the gap between the two surfaces δ = δx 2 + δy 2 − 1 (see figure 5.15c). As shown in figure 5.14, grain 1 trails grain 2. As grain 2 approaches the depression zone, corresponding to negative fluid pressure behind grain 1, the velocity of the trailing grain increases as the grains approach closer, this is in agreement with the experimental description of the draft. Grain 2 increases its vertical velocity more than grain 1 until it p touches grain 1. The kiss happens at a normalised time (t/ (D/g)) = 25. At this stage, the gap δ between the grains is zero, but the actual gap is about one lattice spacing for the LBM collision model. After this time, the vertical velocity of grain 1 decreases and its horizontal velocity increases as the grains tumble. At this stage, the grains still remain in contact, i.e., the gap remains unchanged δ = 0. Subsequently, the two grains separate and move away from each other. Figure 5.15b shows that the terminal velocities of the two grains are in good agreement with the terminal velocity of a single grain found by an independent simulation and calculated using the empirical Schiller and Nauman formula (Komiwes et al., 2005).
5.5
GP-GPU Implementation
The Graphics Processing Unit (GPU) is a massively multi-threaded architecture that is widely used for graphical and now non-graphical computations. Today’s GPUs are general purpose processors with support for an accessible programming interface. The main advantage of GPUs is their ability to perform significantly more floating point operations (FLOPs) per unit time than a CPU. General Purpose computations on GPUs (GPGPUs) often achieve speed-ups of orders of magnitude in comparison with optimised CPU implementations. A GPU consists of several Streaming Multiprocessors (SMs). Each SM contains 32 CUDA processors. Each CUDA processor has a fully pipelined integer arithmetic logic unit (ALU) and a floating point unit (FPU). The FPU complies with the IEEE 754-2008 industry standard for floating-point arithmetic, capable of double precision computations. The SM schedules work in groups of 32 threads called warps. Each SM features two warp schedulers and two instruction dispatch units, allowing two warps to be issued and executed concurrently. Each thread has access to both L1 and L2 caches, which improves the performance for programs with random memory access. The occupancy rate of the SPs, i.e. the ratio between the number of threads run and the maximum number of executable threads, is an important aspect to take into consideration for the optimisation of a CUDA kernel. Even though a block may only be run on a single SM, it is possible to execute several blocks concurrently on the same SM. Hence, tuning the
5.5 GP-GPU Implementation
195
Grain 2 Grain 1
(a)
(b)
(c)
(d)
(e)
(f)
Figure 5.14 Time series of draft, kiss and tumble of two grains during sedimentation in a viscous fluid.
Numerical modelling of fluid–grain interactions
196
0.65
0.8
0.6
0.7
0.55
grain[0].x/L grain[1].x/L grain[0].y/H grain[1].y/H
0.5 0.45
0.6 0.5 0.4
0.4
0.3
0.35
0.2
0.3
0.1
0.25
0
20
40 60 80 normalised time t/ (D/g)
100
0.2
0 120
0 normalised velocity v/ (Dg)
0.9 normalised vertical position y/H
1
0.7
-0.2 -0.4 -0.6 grain[0].Vx/ (Dg) grain[1].Vx/ (Dg) grain[0].Vy/ (Dg) grain[1].Vy/ (Dg) Schiller and Naumann
-0.8 -1
0
(a) transverse and longitudinal position
20
40 60 normalised time t/ (D/g)
(b) normalised velocity
4.5 normalised distance between particles /D
normalised horizontal position x/L
0.75
draft
4
tumble
3.5 kiss
3 2.5
x/D y/D /D
2 1.5 1 0.5 0 -0.5
0
20
40 60 80 normalised time t/ (D/g)
100
120
(c) distance between grains Figure 5.15 Time history of sedimentation of two circular grains.
80
100
5.5 GP-GPU Implementation
197
execution grid layout allows one to increase the occupancy rate. Nevertheless, reaching the maximum occupancy is usually not possible, as the threads executed in parallel on one SM have to share the available registers (Obrecht and Kuznik, 2011). Many-core processors are promising platforms for intrinsically parallel algorithms such as the lattice Boltzmann method. Since the global memory for GPU devices shows high latency and LBM is data intensive, the memory access pattern is an important issue for achieving good performances. Whenever possible, global memory loads and stores should be coalescent and aligned, but the propagation phase in LBM can lead to frequent misaligned memory accesses. Also, the data transfer between the host and the device is very expensive. In the present study, the LBM implementation follows carefully chosen data transfer schemes in global memory. There are three ways to accelerate GPGPU applications: (a) Using ‘drop-in’ libraries, (b) using directives by exposing parallelism, and (c) using dedicated GPGPU programming languages. OpenACC (Open Accelerators) is an open GPU directives programming standard for parallel computing on heterogeneous CPU/GPU systems. Unlike conventional GPU programming languages, such as CUDA, OpenACC uses directives to specify parallel regions in the code and performance tuning works on exposing parallelism. OpenACC targets a host-directed execution model where the sequential code runs on a conventional processor and computationally intensive parallel pieces of code (kernels) run on an accelerator such as a GPU (see figure 5.16). Initially, the GPGPU LBM – DEM code was implemented in C using OpenACC API v1.0, which was released in November 2011. The current implementation in C++ uses OpenACC API v2.0a (OpenACC-Members, 2013) and has two compute constructs, the kernels construct and the parallel construct. LBM – DEM implementation predominantly uses the OpenACC gang and vector parallelism. The LBM – DEM code runs sequential and computationally less intensive functions on the CPU, OpenMP multi-threading is used when possible. Computationally intensive functions are converted to a target accelerator specific GPU parallel code. Schematics of a heterogeneous CPU/GPU system is shown in figure 5.16. OpenACC offers kernel and parallel constructs to parallelise algorithms on CUDA kernels. The loop nests in a kernel construct are converted by the compiler into parallel kernels that run efficiently on a GPU. There are three steps to this process. The first is to identify the loops that can be executed in parallel. The second is to map that abstract loop parallelism onto a concrete hardware parallelism. In OpenACC terms, gang parallelism maps to grid-level parallelism (equivalent to a CUDA blockIdx), and vector parallelism maps to thread-level parallelism (equivalent to a CUDA threadIdx). The compiler normally maps a single loop
Numerical modelling of fluid–grain interactions
198
Application Code
Compute-Intensive function Generated parallel code for GPU
#pragma acc
Rest of sequential code
GPU
CPU
Offload computation
PCI Bus
GPU Memory
Transfer Data
CPU Memory
Figure 5.16 Schematics of a heterogeneous CPU/GPU system.
5.5 GP-GPU Implementation
199
across multiple levels of parallelism using strip-mining. Finally, in step three the compiler generates and optimises the actual code to implement the selected parallelism mapping. An OpenACC parallel construct creates a number of parallel threads that immediately begin executing the body of the parallel construct redundantly. When a thread reaches a work-sharing loop, that thread will execute some subset of the loop iterations, depending on the scheduling policy as specified by the program or at the runtime. The code generation and optimization for a parallel construct is essentially the same as for the kernel construct. A key difference is that unlike a kernel construct, the entire parallel construct becomes a single target parallel operation, aka a single CUDA kernel. Both constructs allow for automatic vectorization within the loops (Wolfe, 2012). An excerpt from the LBM-DEM code showing the OpenACC GPU implementation of the hydrodynamic force computation is presented in Listing 5.1. The kernels loop construct tells the compiler to map the body of the following loop into an accelerator kernel. The GPU implementation uses a two-dimensional grid splitting the iterations across both the vector and gang modes. The kernel is mapped to a vector mode mapped (aligned with CUDA threadidx%x) with a vector length (thread block size) of 128. The kernel is also mapped to gang parallelism, aligned to CUDA blockidx%x, to avoid partition camping by mapping the stride-1 loop to the x dimension. The compiler strip-mines the loop into chunks of 256 iterations, mapping the 256 iterations of a chunk in vector mode across the threads of a CUDA thread block, and maps the n/256 chunks in gang mode across the thread blocks of the CUDA grid. The consecutive iterations (i and i+1), which refer to contiguous array elements (fhf[i] and fhf[i+1]), are mapped to adjacent CUDA threads in the same thread block, to optimise for coalesced memory accesses. Memory transaction optimisation is more important than computation optimisation. Registers do not give rise to any specific problem apart from their limited amount. Global memory, being the only one accessible by both the CPU and the GPU, is the critical path as it suffers from high latency. However, this latency is mostly hidden by the scheduler which stalls inactive warps until data are available. For data intensive LBM, this aspect is generally the limiting factor (Obrecht and Kuznik, 2011). To optimise the global memory transactions, the memory access is coalesced and aligned, as explained above. The memory transactions between the host and the target through a PCI bus are kept to a minimum.
200
Numerical modelling of fluid–grain interactions
Listing 5.1 OpenACC GPU implementation of the hydrodynamic force computation.
1 2 3 4 5 6 7 8 9 10 11 12 13 14 15 16 17 18 19 20 21 22 23 24 25 26 27 28 29 30 31 32 33 34
// OpenACC Kernels copy data between the host and the device #pragma acc kernels copyout(fhf1 [0: nbgrains ], fhf2 [0: nbgrains ], fhf3 [0: nbgrains ]) copyin(obst [0:][0:], g[0: nbgrains ], ey [0:], f [0:][0:][0:], ex [0:]) // Create individual threads for each DEM grain #pragma acc parallel for for ( i=0; i