Scale techniques are used to partition the information contained in the frequency domain .... of both PCA and Discriminative subspace projection tech- niques. The remainder of ..... [16] M. T. D. Bolme, R. Beveridge and B. Draper, âThe CSU Face Iden- tification .... UK and a PhD degree in the area of Signal Process- ing from ...
IEEE TRANSACTIONS ON INFORMATION FORENSICS AND SECURITY: SPECIAL ISSUE ON HUMAN DETECTION AND RECOGNITION
1
Multi-Scale Representation for 3D Face Recognition Jamie Cook*, Graduate Member, IEEE, Vinod Chandran, Senior Member, IEEE, Sridha Sridharan, Senior Member, IEEE
Abstract— The Eigenfaces algorithm has long been a mainstay in the field of Face Recognition due to the high dimensionality of face images. While providing minimal reconstruction error, the Eigenface-based transform space de-emphasises high frequency information, effectively reducing the information available for classification. Methods such as Linear Discriminant Analysis (also known as Fisherfaces) allow the construction of subspaces which preserve the discriminatory information. In this article MultiScale techniques are used to partition the information contained in the frequency domain prior to dimensionality reduction. In this manner it is possible to increase the information available for classification and hence increase the discriminative performance of both Eigenfaces and Fisherfaces techniques. Motivated by biological systems, Gabor filters are a natural choice for such a partitioning scheme. However, a comprehensive filter-bank will dramatically increase the already high dimensionality of extracted features. In this article a new method for intelligently reducing the dimensionality of Gabor features is presented. The FRGC dataset of 3D face images is used to examine the performance of Gabor filter-banks for Face Recognition and to compare them against other Multi-Scale partitioning methods such as the Discrete Wavelet Transform and the Discrete Cosine Transform.
EDICS Category: BIO-BODY I. I NTRODUCTION
T
HE process of dimensionality reduction is an essential stage in Face Recognition tasks where the data has an intrinsically high dimensionality. Most methods for achieving this fall into two categories, energy based methods such as Principal Component Analysis (PCA) or discriminant based methods such as Linear Discriminant Analysis (LDA). Both approaches achieve a lower dimensional space but are optimized upon different criteria. PCA, for example, constructs a transform space which is optimised with respect to the principal modes of variation in the training data, however it can remove information required to discriminate objects within that space. LDA on the other hand is specifically optimised for discriminability but is susceptible to over fitting of the training data [1]. This leads to a transform space which doesn’t generalise well to observations outside the training set. There are many alternate approaches which have been proposed to address the short comings of both algorithms. In [2] and [3] two alternate methods of calculating the LDA transformation are proposed which claim to overcome the Small Sample Size (SSS) problem. When the number of training observations is significantly less than the dimensionality, the within-class scatter matrix, Sw , is likely to be singular. As the LDA algorithm requires calculating the inverse of Sw , The authors are with the Image and Video Research Laboratory, School of Engineering Systems, Queensland University of Technology, Brisbane, Australia. Email: {j.cook, v.chandran, s.sridharan}@qut.edu.au
this presents serious problems to computation. In [2], the authors argue that the majority of discriminative information is contained in the null-space of the within class scatter matrix, which can be calculated even when the SSS problem is present. In [3] however, it is shown that while significant discriminatory information is contained in this null space, it does not contain the entirety of discriminable information. They instead avoid the SSS problem by reversing the order in which the scatter matrices are diagonalised; testing on the ORL database demonstrates both the efficacy of their method and the distribution of information outside the null-space of Sw . In [4], a thorough examination of the practical differences between PCA and the Independent Component Analysis (ICA) is given. While the PCA method decorrelates the training data using second order statistics, ICA also utilises the higher order statistics of the input data with the aim of providing statistical independence. They report that when an appropriate distance metric is chosen for ICA, it consistently outperforms PCA in a recognition task. Also receiving much attention in the literature are the kernel machine techniques such as Kernel-PCA, Kernel-LDA (or Generalised Discriminant Analysis (GDA)) and Kernel Direct Discriminant Analysis (KDDA). These techniques are cited as being able to cope with non-linear variations due to pose and expression which are ill-catered for in their linear counterparts. In [5], the Direct-LDA algorithm of [2], [3] is adapted for use within a kernel space. Tests using a database of 20 subjects show that the proposed method can outperform KPCA and GDA using both the radial basis function (RBF) and polynomial kernel types. While the SSS problem manifests most prominently in the singular scatter matrix of LDA, it is a problem that is present in all techniques which use high dimensional image data. Until database sizes increase exponentially to match image dimensionality, methods for allieviating this shall be required. It is the position of this article that this can be achieved through the use of Multi-Scale techniques to partition the information content in the face. By training subspace projections for each partition separately, the amount of information encoded by the transformation is reduced. Thus the same training data can be used to train a series of specialised subspaces which more accurately describe the underlying information. Any such subspace projection will introduce a non-linear effect on the information content of the signal. To illustrate this, the frequency response of PCA reconstruction of 3D face images is approximated by averaging the ratio F (I 0 )/F (I), where Z 2π
F (I) =
|I(r, θ)|dθ 0
(1)
2
IEEE TRANSACTIONS ON INFORMATION FORENSICS AND SECURITY: SPECIAL ISSUE ON HUMAN DETECTION AND RECOGNITION
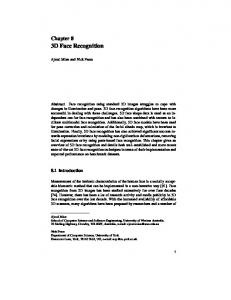
and I(r, θ) and I 0 (r, θ) are the Fourier transforms of the original and reconstructed images respectively. It can be seen from the averaged results shown in Figure 1 that as the number of retained eigenvectors is increased the response in high frequency regions is improved. However this improvement comes at the expense of extra dimensionality and even when using the full complement of eigenvectors the reconstruction still exhibits a highly non-linear low-pass characteristic. This low-pass characteristic corroborates previous work which has shown that performance of Eigen-faces is very robust to downsampling and blurring of input images [6], [7]. 1
Increasing N
0.98
0.96
F(I')/F(I)
0.94
0.92
N
0.9
0.88
0.86
0
50 150 250 350 450 550 650 750 850 942
0.05
In addition, the Discrete Cosine Transform (DCT) shall also be evaluated as a method of filter-bank partitioning. While the DCT is more commonly associated with compression tasks [15], its compactness and similarities to the Fourier Transform make it well suited to our task. In the following section these methods are introduced in more detail and their positions within the Multi-Scale framework are further examined. To examine the efficacy of the proposed methodology a standard nearest neighbour classification scheme is employed. Figure 2 shows a block diagram of the matching process given two input range images. After separation into frequency bands, each level is projected into a PCA subspace which has been trained with corresponding data. The subspace projections are compared using the Mahalanobis Cosine metric which was shown in [16] as having a consistently high performance. The summation of distances across all levels is then used as the final matching score. The unweighted summation was chosen over more esoteric score fusion techniques as it has been shown that the increase in performance doesn’t justify the extra complexity that such schemes require [17]. A. Discrete Wavelet Transform
0.1
0.15
0.2
0.25
0.3
0.35
Radial Frequency (cycles/pixel)
0.4
0.45
0.5
Fig. 1. Approximated frequency response of 3D Eigen-faces as the number, N, of retained eigenvectors is increased.
When using partitioned subspaces each space may also have a non-linear response, however the effect over the entire domain is minimised. In this article it shall be shown that the use of Multi-Scale partitioning improves the accuracy of both PCA and Discriminative subspace projection techniques. The remainder of this article is set out as follows: in Section II we present three Multi-Scale representations which enable frequency domain partitioning. Section III details experimentation with the Face Recognition Grand Challenge (FRGC) dataset along with an extended analysis of the results. Concluding remarks are given in Section IV. II. M ULTI -S CALE R EPRESENTATIONS The main objective of this article is to investigate MultiScale representations for 3D face data which can separate the information content prior to dimensionality reduction. This is motivated by biological systems; in human speech processing the Mel Frequency Cepstral Coefficients (MFCC) encode the information from a logarithmically spaced filter-bank derived from the human auditory system [8]. In the visual domain, work done in the related field of Scale-Space [9] and wavelet theory [10] draws inspiration from the human visual system [11], [12], [13]. Gabor filters are commonly cited as sharing many properties with mammalian cortical cells [14] and appear a logical choice for the task of frequency partitioning. Wavelet analysis has also been used extensively to provide a compact representation which separates the frequency content of a signal or image.
Wavelet decomposition is the projection onto an orthonormal set of basis vectors which are generated by dilation and translation of a single “mother wavelet”. The simplest such mother wavelet is the Haar wavelet, 1 : 0 ≤ t < 1/2 −1 : 1/2 ≤ t < 1 , ψ(t) = (2) 0 : else which generates the basis set, µ ½ ¶¾ t − 2j n 1 . ψj,n (t) = √ ψ 2j 2j (j,n)∈Z 2
(3)
The Discrete Wavelet Transform (DWT) is a projection of a signal onto a finite number of such basis functions. It is typically implemented using two complementary filters derived from the “mother wavelet” which have low-pass and highpass responses respectively. At each application of the filters the signal is split into a low and high frequency component which are then down-sampled by a factor of two to give a consistent memory requirement regardless of decomposition level. This also allows the same filters to be used at each level as they have effectively been up-scaled by a factor of two. Figure 3 illustrates the first three levels of the 2D wavelet transform applied to a typical 3D range image. At each level the approximation of the previous level is split into horizontally, vertically and diagonally filtered images along with a subsequent approximation image. This multi-level representation can be coerced into a filter bank form by grouping together the detail coefficients at each level. In our experimentation 5 levels of decomposition are employed which yields the equivalent of 6 filter banks (5 detail vectors and the remaining approximation vector). Using the levels of the DWT to compose our filter banks also helps to avoid the SSS problem. The number of coefficients at each level is 1/4 of that required at the previous level
COOK et al.: MULTI-SCALE REPRESENTATIONS FOR 3D FACE RECOGNITION
Multi-Scale Partitioning
Fig. 2.
3
Subspace Proj.
Scoring
Subspace Proj.
Scoring
Subspace Proj.
Scoring
Matching Score
Block Diagram of the Matching Process.
also has desirable high pass characteristics. Field defines the frequency response of a Log-Gabor filter as, Φ(f ) = exp −
(a)
(b)
(c)
Fig. 3. First three levels of DWT using Haar wavelet (a) First level (b) Second level (c) Third level.
log(f /k) , 2 log(σ/k)
(5)
where k = [u0 v0 w0 · · · ]T is the center frequency of the sinusoid and σ is a scaling factor of the bandwidth. Examples of the 3D face response to a family of Log-Gabor filters evaluated over 6 orientations and 5 scales are shown in Figure 4.
(with the exception of the final level where the factor is 1/3). This immediately gives an advantage in sub-space training as the number of dimensions becomes more comparable with the number of training observations available for training.
Gabor filters share many properties with mammalian cortical simple cells such as spatial localisation, orientation selectivity and spatial frequency characterisation [14]. They have been successfully used in a variety of image processing applications ranging from texture analysis [18] and expression characterisation [19] to face recognition [20]. Perhaps most importantly they achieve the theoretical lower bound of joint uncertainty in the conjoint domains of visual space and frequency [21] allowing the construction of compact spatio-temporal filters. They can also be considered within the wavelet framework as the complete bank of Gabor filters can be constructed by dilations, rotations and translations of a single function. This functional form of the Gabor family of filters has two main components, the complex sinusoidal carrier, s(x), and the gaussian envelope, wr (x), ψ(x, y) = =
s(x, y).wr (x, y) e2πj[u0 x+v0 y] .e−π[x
2
α2 +y 2 β 2 ]
,
(4)
where u0 and v0 define the spatial frequency of the complex valued plane wave and α and β define the sharpness of the 2 gaussian envelope. In practice a compensation term, e−σ /2 , is commonly included to remove the DC component of the filters. In [11], Field proposes an alternate method to perform both the DC compensation and to overcome the bandwidth limitation of a traditional Gabor filter. The Log-Gabor filter has a response that is Gaussian when viewed on a logarithmic frequency scale instead of a linear one. This allows more information to be captured in the high frequency areas and
Orientation
B. Gabor Filter Bank
Scale
Fig. 4. The response of an example face image to a bank of Log-Gabor filters with varying scale and orientation.
One of the principal difficulties faced when using Gabor filters for feature extraction is that of dimensionality explosion; by applying a 6 orientation, 5 scale filter-bank to a 128x128 image, 491,520 coefficients are generated. Many authors deal with this by only extracting features from fiducial points on the face [20], [19] or by blindly decimating the concatenated coefficients [22], [23], [24]. Inspection of Figure 4 shows that by employing the same concept that allows each level of the wavelet transform to use less coefficients than the previous, a more natural downsampling can be achieved. It is a property of the DWT that full reconstruction is still possible whilst performing dyadic decimation at each iteration. However, this is not a property shared by the Gabor responses, nor is reconstruction a requisite for such a representation. Instead the decimation scheme of the DWT is modified to use bilinear resampling. At each scale level the coefficients are
4
IEEE TRANSACTIONS ON INFORMATION FORENSICS AND SECURITY: SPECIAL ISSUE ON HUMAN DETECTION AND RECOGNITION
resampled by a factor of 1/2( s − 1) giving a dimensionality that is 1/4 of the previous level. C. Discrete Cosine Transform The Discrete Cosine Transform (DCT) is closely related to the Discrete Fourier Transform and is sometimes (erroneously) referred to as the real component of the Fourier Transform. Both the DCT and FFT are separable, linear transforms, however, except for the special case where the signal under consideration is even, they are distinct. Instead of representing a signal, f (x) by the weighted summation of complex sinusoids, ejωx , the DCT instead uses a set of cosines, cos(ωx), as basis functions. The 1D-DCT of an N dimensional signal is defined as, · ¸ N −1 X π(2x + 1)k C(k) = α(k) f (x) cos , (6) 2N x=0 where,
r
r 1 2 α(0) , , α(k) , for 1 ≤ k ≤ N − 1. (7) N N Due to the DCT’s linear separable nature, the 2D transform can be calculated by cascading together two 1D-DCTs in the horizontal and vertical directions. The DCT has the effect of concentrating the energy in a signal in a relatively small number of coefficients and has been widely used in image compression schemes including the popular JPEG image format. In order to construct filter-banks from a DCT representation a fundamental difference between the DCT and the other methods must first be addressed. This is namely that while the DWT and the Gabor filter response defines the output of a particular filter at a given pixel the DCT instead defines the average response to the DCT basis vectors across the area in which it is applied. Thus the DCT cannot be applied across the entire image in the same manner as the previous methods, instead we opt for the common overlapping block implementation as is used in the Part-Face method of [17]. An overlap of 50% is used and coefficients from each block are divided into bands based upon the radial frequency of the corresponding basis vector. As with the DWT, this places a variable number of co-efficients into each level, with high-frequency bands containing more co-efficients than low frequency bands. III. E XPERIMENTATION Experimental evaluation of the three methods described previously was conducted using the Face Recognition Grand Challenge (FRGC) version 2.0 data set [25], [26]. The combined 2D/3D data in this database was collected at the University of Notre Dame during the 2003-2004 academic year from 466 subjects. The training portion of the dataset comprises 943 images captured in Spring 2003 while the testing set contains 4007 images captured in Fall 2003 and Spring of 2004. Each capture consists of a 640 × 480 resolution RGB texture image and a corresponding 3D scan taken with a Minolta Vivid 900 range scanner. The associated landmark metadata is used to normalise the images to 128 × 128 pixels.
Method
EER (%)
PCA ICA LDA GDA
7.31% 7.24% 4.51% 4.56%
Accuracy at FAR=0.1% 55.35% 55.75% 69.76% 70.99%
TABLE I B EST PERFORMANCE (EER)
OF GLOBAL METHODS ON
FRGC
DATASET
In the following sections this data is used to test two hypotheses, firstly that a Multi-Scale partitioning of the frequency domain can improve the discriminability of both the PCA and LDA subspace projection techniques. Secondly, the over-complete representation provided by Log-Gabor filters provides a better partioning of the space/frequency domain for recognition than regular Gabor Filters, Discrete Cosine Transform or the Wavelet Transform. The cited motivation of the FRGC was to improve the performance of Face Recognition Technology (FRT) by an order of magnitude while maintaining a consistently low False Alarm Rate (FAR). In accordance with this, two main indicators of performance are considered when evaluating these hypotheses, the Equal Error Rate (EER) and the performance at a FAR of 0.1%. A. Popular Holistic Methods In this section we will establish a baseline, using popular holistic methods for face recognition, against which we shall compare our Multi-Scale technique. As was stated earlier, discriminant techniques (i.e. LDA, GDA) are often combined with a PCA stage to avoid the SSS problem. Fortunately the FRGC dataset is of sufficient size to avoid creating a singular within-class scatter matrix and the PCA stage was thus not required. When implementing the ICA algorithm both architecture I and II of [4] were considered. Testing corroborated that architecture II performed better and was thus selected for our evaluation. Each method was independently optimised over a range of retained dimensions and the best results from each can be seen in Table I. It becomes obvious that the methods optimizing for discriminability enjoy a significant performance advantage on this dataset. There also appears to be little to differentiate between PCA/ICA or between LDA/GDA. In the next three sections the PCA algorithm is chosen to evaluate the performance of the proposed Multi-Scale representations and to tune parameter selection. In Section III-E the three MultiScale representations are then compared using both the PCA and LDA sub-space projection techniques. B. Gabor Filters Each of the previously introduced methods are capable of partitioning the frequency domain with varying degrees of spatial locality. The Gabor and Log-Gabor filters are the closest in nature to the manner in which human’s process visual stimulus and allow the greatest flexibility in selecting partitions. A full discourse on the optimal filter-bank construction is beyond the scope of this article and the interested reader is referred
COOK et al.: MULTI-SCALE REPRESENTATIONS FOR 3D FACE RECOGNITION 25%
Log-Gabor
Center Frequency (cycles/pixel)
w/ out overlap
with overlap
w/ out overlap
with overlap
0.1923 0.0923 0.0462 0.0231 0.0116 Combination
8.93% 6.40% 7.49% 11.99% 15.11% 5.32%
9.18% 6.51% 6.73% 7.56% 12.92% 4.74%
8.99% 6.99% 7.32% 12.19% 22.94% 5.15%
8.76% 6.92% 6.28% 7.03% 11.90% 4.26%
Center Frequency 0.1923 0.0923 0.0462 0.0231 0.0116
20%
15% EER (%)
Gabor
5
10%
TABLE II
5%
EER (%) OF G ABOR F ILTER BANKS 0% 0
to [20], [27] for discussion of Gabor filter parameter selection and to [28] as a good starting point in selecting Log-Gabor filter parameters. One aspect of filter-bank construction which is of central importantance to this article however, is that of filter-bank overlap. Should filters have minimal overlap in order to increase the independence of extracted features? Or should they blanket the entire domain in order to ensure full coverage? Most work done with Gabor filters uses feature fusion to combine the various scales and orientation and thus will naturally aim for the former. In this work classifier fusion is employed leading to some ambiguity in this regard. In order to resolve the question, each type of filter was evaluated both with and without overlapping bands, the results of which are presented in Table II. As can be seen the use of overlapping bands improved performance for both types of filter, however the effect was most noticeable in the lower frequency bands where the relative increase in bandwidth was higher. It can also be noted that while performance in individual bands is variable, the Log-Gabor filters outperform significantly in the combination of bands. The combination of all five overlapping frequency bands allows a PCA based approach that outperforms the LDA and GDA algorithms detailed in the previous section. This leads to the conclusion that an over-complete representation is more beneficial than filter-bank independence in a discrimination task. Having identified the center frequencies of an optimal set of filters, we return to the problem of dimensionality explosion in Gabor filters. We now compare the blind decimation technique utilized by other authors with the guided averaging technique proposed earlier. Figure 5 shows the performance of individual bands as a function of the decimation factor. Of great interest are the peaks which occur around 32, 64, 128 and 192, these manifest most noticeably in the high frequency band but are present in all bands to a more limited extent. They can be attributed to the 1-dimensional decimation of what is an inherently 2-dimensional signal; when the decimation factor is near to an integer multiple of the image size the 2D sampling pattern forms into scanlines. Figure 6 contrasts the uniform 2D sampling obtained with a decimation factor of 72 against the highly correlated sampling from a factor of 64. After removing the perturbations caused by uneven sam-
50
100
150
200
Decimation Factor
Fig. 5.
Performance as function of decimation.
(a)
(b)
(c)
Fig. 6. Original mask (a) and decimated masks with decimation factor (b) 64 (c) 72.
pling it is observed that the effect of decimation varies depending upon the center frequency of the filter. The band with center frequency of 0.1923 cycles/pixel suffers serious performance degradation with higher decimation whereas the lower frequency bands remain stable across a large range of values. The downsampling scheme proposed in Section IIB avoids both problems by considering the gabor responses as 2D functions and downsampling partitions relative to their information content. The benefits of this can be seen in Table III, by selectively managing the increase in dimensionality, performance can be improved significantly. C. Discrete Wavelet Transform After selecting frequency bands from the Log-Gabor representation we are faced with the problem of finding comparable representations using the other methods. Equivalence with the Center Frequency (cycles/pixel) 0.1923 0.0923 0.0462 0.0231 0.0116 Combination
Decimation Factor None
96
Bilinear Resampling
8.76% 6.92% 6.28% 7.03% 11.90% 4.50%
12.54% 8.02% 6.61% 6.86% 11.87% 4.50%
8.76% 6.93% 6.56% 6.97% 10.18% 4.00%
TABLE III EER (%) ACROSS DECIMATION TECHNIQUES .
6
IEEE TRANSACTIONS ON INFORMATION FORENSICS AND SECURITY: SPECIAL ISSUE ON HUMAN DETECTION AND RECOGNITION
Center Frequency (cycles/pixel) 0.1875 0.0938 0.0469 0.0234 Approximation Combination
db1 13.56% 9.86% 7.77% 8.57% 13.39% 5.75%
Daubechies db2 db4 22.08% 27.06% 12.32% 15.54% 8.57% 9.68% 8.79% 9.20% 12.40% 12.61% 6.09% 6.85%
db6 27.57% 14.95% 11.25% 10.10% 12.97% 7.91%
coif1 21.53% 12.71% 10.11% 9.59% 12.94% 7.27%
Coiflet coif2 26.51% 14.96% 10.78% 10.18% 13.41% 7.38%
coif3 27.41% 15.11% 11.22% 8.99% 13.39% 7.72%
TABLE IV EER (%) OF DAUBECHIES AND C OIFLET WAVELETS BASED FILTER - BANK
DCT is established using the method outlined in Section IIC. Each band of the Gabor filter defines a lower and upper cutoff from the half-peak magnitude profile, by selecting DCT basis functions which have peak frequency response within these bounds we establish equivalent representations using both methods. The DWT presents a slightly more difficult problem due to the inflexible yet variable nature of its partitions, which depend upon the basis wavelet. We can estimate the center frequencies of the DWT by assuming that each iteration cuts the frequency domain into two equal sized regions, different wavelets will have slightly different lowpass, high-pass characteristics but this serves well for the purpose of approximation. The estimated center frequencies for the Wavelet decomposition are listed in Table IV and a comparison with the values listed in Table II shows that they align well with the Gabor method and that comparison between the two is apt. The first point to notice from these results is the negative trend in accuracy as the order of the wavelet is increased. This can be explained through examination of the mother wavelets for these wavelet families; in Figure 7 the wavelet functions for the lower orders of the Daubechies and Coiflet families are shown. One of the principal benefits of the wavelet transform is its ability to capture transient phenomena, as the wavelet order increases so too does the sharpness of the filter and the accuracy with which such phenomena can be localised. Compare then the sharpness of these filters against the smoothly changing nature of the human face and it becomes obvious that it is more appropriate to use the smoother lower order wavelets. While not shown here similar trends were observed in the Biorthogonal and Symlet families of wavelets and these results reflect those found in [29]. D. Discrete Cosine Transform As stated previously the block based nature of the DCT makes exact comparisons with the DWT and Gabor filters difficult. To make the comparison as equal as possible a range of block sizes were considered to provide differing levels of spatial locality to the extracted features. The results of this comparison are displayed in Table V, and show little to differentiate a block size of 32 from a block size of 64. However when using a block size of 8 pixels, lower frequency information can not be encoded and this appears to have
Fig. 7.
db2
db4
db6
coif1
coif2
coif3
Psi functions of Daubechies and Coiflet wavelets
Center Frequency 0.1923 0.0923 0.0462 0.0231 Combination
16x16 19.01% 7.36% 6.64% 6.55%
32x32 24.17% 10.02% 6.19% 6.47% 5.26%
64x64 25.78% 12.21% 7.21% 6.57% 5.38%
TABLE V EER OF DCT
USING INCREASING BLOCK SIZE .
a serious impact on recognition accuracy. It is also notable that the DCT encoding of high frequency information is less suitable for recognition than was the Gabor representations examined in the previous section. Unlike experiments in the previous section where all bands contributed to the combined performance, the DCT high-frequency band degrades combined performance and is hence omitted from the results presented. E. Analysis In the previous experimentation various methods of dimensionality reduction have been trialled using the largest available database of 3D face images. It was found that
COOK et al.: MULTI-SCALE REPRESENTATIONS FOR 3D FACE RECOGNITION
40
PCA DCT (32x32 window) Haar Wavelet
Miss probability (in %)
20
Log−Gabor
10
5
2 1 0.5 0.2 0.1 0.1 0.2
Fig. 8.
0.5
1
2 5 10 False Alarm probability (in %)
20
40
DET Comparison of PCA-based Multi-Scale techniques.
40
7
tion yields consistent enhancements across the entire range of the curve. The relative improvement in EER for PCA-based projection is 45% (7.31% to 4.00% when using Log-Gabor representation) and for LDA-based projection it is 28% (4.51% to 3.25% again using Log-Gabor representation Log-Gabor). The improvement in LDA performance is especially important as the baseline in this case is tailored for discriminability. This illustrates the benefits of using specialised subspaces over a transformation which attempts to encode the entire frequency domain into a single projection. Resolution of the second hypothesis is less clear however, when using LDA subspaces, the Log-Gabor representation outperforms both the DWT and DCT across the entire curve. However when using PCA based subspaces, it falls behind in the low FAR region. Experimentation has shown that performance in this region of the DET responds well to lowfrequency information, this degradation could be rectified by increasing the bandwidth of the low-pass filters. Alternately, scores from both Log-Gabor and DCT representations can be fused together to obtain desirable characteristics of both. As with most interpretations of DET curves, a final decision on which Multi-Scale representation is most appropriate depends upon the target application.
LDA DCT (32x32 window)
IV. C ONCLUSION
Haar Wavelet
Miss probability (in %)
20
Log−Gabor
10
5
2 1 0.5 0.2 0.1 0.1 0.2
Fig. 9.
0.5
1
2 5 10 False Alarm probability (in %)
20
40
DET Comparison of LDA-based Multi-Scale techniques.
Discriminative Analysis methods significantly outperformed PCA and ICA. Previously we positted that Multi-Scale representations can improve the performance of both PCA based and Discriminant based subspaces. To verify this we now compare the Detection Error Tradeoff (DET) curves of the top performing parameter set from each of the methods against the baseline systems established earlier. Results from the PCA based experimentation of the previous sections is shown in Figure 8 and the combination of Multi-Scale with LDA is shown in Figure 9. Immediately it is obvious that the Multi-Scale methods presented here dramatically improve upon the performance of the classic eigen-faces and fisher-faces approaches. Large improvements, especially in the high FAR regions, are observed when using PCA-based projection; LDA-based projec-
In this article, we have demonstrated that the use of MultiScale partitioning prior to dimensionality reduction can increase the information available for classification and greatly increase Face Recognition performance. Three techniques for Multi-Scale partitioning have been identified and tested using the Face Recognition Grand Challenge 3D Face dataset. Experimentation using unweighted classifier fusion has shown that partitioned data is capable of improving the performance of both the PCA and LDA subspace projection techniques. A new technique for coefficient sampling has been proposed to reduce the dimensionality of Gabor features while maintaining their information content. Inspired by the wavelet transform, this technique uses more coefficients to represent high-frequency content and less coefficients for low-frequency content. This in effect concentrates the information available at each scale level and, in contrast to the unguided decimation used previously, improves the performance of the tested classifier. Using this technique, a bank of Log-Gabor filters has been shown to outperform regular Gabor filters and the other presented Multi-Scale techniques over the majority of the Detection Error Tradeoff space. ACKNOWLEDGMENT This research was supported by the Australian Research Council (ARC) through Discovery Grant Scheme, Project ID DP452676, 2004-6. R EFERENCES [1] A. Martinez and A. Kak, “PCA versus LDA,” Pattern Analysis and Machine Intelligence, IEEE Transactions on, vol. 23, no. 2, pp. 228– 233, 2001.
8
IEEE TRANSACTIONS ON INFORMATION FORENSICS AND SECURITY: SPECIAL ISSUE ON HUMAN DETECTION AND RECOGNITION
[2] L.-F. Chena, H.-Y. M. Liaob, M.-T. Kob, J.-C. Lina, and G.-J. Yuc, “A new lda-based face recognition system which can solve the small sample size problem,” Pattern Recognition Letters, vol. 33, pp. 1713–1726, June 2000. [3] H. Yu and J. Yang, “A direct LDA algorithm for high-dimensional data with application to face recognition,” Pattern Recognition, vol. 34, no. 10, pp. 2067–2070, 2001. [4] B. Draper, K. Baek, M. Bartlett, and J. Beveridge, “Recognizing faces with PCA and ICA,” Computer Vision and Image Understanding, vol. 91, no. 1-2, pp. 115–137, 2003. [5] J. Lu, K. Plataniotis, and A. Venetsanopoulos, “Face recognition using kernel direct discriminant analysis algorithms,” Neural Networks, IEEE Transactions on, vol. 14, no. 1, pp. 117–126, 2003. [6] A. Lemieux and M. Parizeau, “Experiments on eigenfaces robustness,” in ICPR ’02: Proceedings of the 16 th International Conference on Pattern Recognition (ICPR’02) Volume 1. Washington, DC, USA: IEEE Computer Society, 2002, p. 10421. [7] K. Chang, K. Bowyer, and P. Flynn, “Face recognition using 2D and 3D facial data,” ACM Workshop on Multimodal User Authentication, pp. 25–32, 2003. [8] L. Rabiner and B. Juang, Fundamentals of speech recognition. PrenticeHall, Inc. Upper Saddle River, NJ, USA, 1993. [9] J. Sporring, L. Florack, M. Nielsen, and P. Johansen, Gaussian ScaleSpace Theory. Kluwer Academic Publishers Norwell, MA, USA, 1997. [10] S. Mallat, A wavelet tour of signal processing. Academic Press, 1998. [11] D. Fields, “Relations between the statistics of natural imags and the response properies of cortical cells,” Journal of OpticSociety of America, vol. 4, no. 12, pp. 2379–2394, 1987. [12] R. Young, “The Gaussian derivative model for spatial vision: I. Retinal mechanisms.” Spat Vis, vol. 2, no. 4, pp. 273–93, 1987. [13] G. DeAngelis, I. Ohzawa, and R. Freeman, “Receptive-field dynamics in the central visual pathways,” Trends Neurosci, vol. 18, no. 10, pp. 451–458, 1995. [14] J. Daugman, “Two-dimensional Spectral Analysis of Cortical Receptive Field Profiles,” Vision Research, vol. 20, pp. 847–856, 1980. [15] ITU-T and ISOIEC JTC1, “G.711 - digital compression and coding of continuous-tone still images,” Recommendation, September 92. [16] M. T. D. Bolme, R. Beveridge and B. Draper, “The CSU Face Identification Evaluation System: Its Purpose, Features and Structure,” in International Conference on Vision Systems. Springer-Verlag, 2003, pp. 304–311. [17] S. Lucey and T. Chen, “Face recognition through mismatch driven representations of the face,” in Visual Surveillance and Performance Evaluation of Tracking and Surveillance, 2005. 2nd Joint IEEE International Workshop on, 2005, pp. 193–199. [18] W. Ma and B. Manjunath, “Texture features and learning similarity,” Computer Vision and Pattern Recognition, 1996. Proceedings CVPR’96, 1996 IEEE Computer Society Conference on, pp. 425–430, 1996. [19] Y. Li Tian, Takeo Kanade, and Jeffrey Cohn, “Evaluation of gaborwavelet-based facial action unit recognition in image sequences of increasing complexity,” in Proceedings of the Fifth IEEE International Conference on Automatic Face and Gesture Recognition, May 2002, pp. 229–234. [20] L. Wiskott, J.-M. Fellous, N. Kr¨uger, and C. von der Malsburg, “Face recognition by elastic bunch graph matching,” IEEE Trans. on Pattern Analysis and Machine Intelligence, vol. 19, no. 7, pp. 775–779, 1997. [Online]. Available: http://www.cnl.salk.edu/∼wiskott/Abstracts/ WisFelKrue97a.html [21] J. Daugman, “Complete discrete 2-D Gabor transforms by neural networks for image analysis and compression,” Acoustics, Speech, and Signal Processing [see also IEEE Transactions on Signal Processing], IEEE Transactions on, vol. 36, no. 7, pp. 1169–1179, 1988. [22] C. Liu and H. Wechsler, “Independent Component Analysis of Gabor Features for Face Recognition,” IEEE Transactions. Neural Networks, vol. 14, no. 4, pp. 919–928, 2003. [23] L. Shen and L. Bai, “Gabor wavelets and kernel direct discriminant analysis for face recognition,” Pattern Recognition, 2004. ICPR 2004. Proceedings of the 17th International Conference on, vol. 1, 2004. [24] S. Shan, W. Gao, Y. Chang, B. Cao, and P. Yang, “Review the strength of gabor features for face recognition from the angle of its robustness to mis-alignment.” in ICPR (1), 2004, pp. 338–341. [25] P. J. Phillips, P. J. Flynn, T. Scruggs, K. W. Bowyer, J. Chang, K. Hoffman, J. Marques, J. Min, and W. Worek, “Overview of the face recognition grand challenge,” in CVPR ’05: Proceedings of the 2005 IEEE Computer Society Conference on Computer Vision and Pattern Recognition (CVPR’05) - Volume 1. Washington, DC, USA: IEEE Computer Society, 2005, pp. 947–954.
[26] K. W. Bowyer, K. Chang, and P. Flynn, “A survey of approaches and challenges in 3D and multi-modal 3D + 2D face recognition,” Computer Vision and Image Understanding, vol. 101, no. 1, pp. 1–15, 2006. [27] L. Shen, L. Bai, and M. Fairhurst, “Gabor wavelets and general discriminant analysis for face identification and verification,” Image and Vision Computing, vol. In Press, Corrected Proof, 2006. [28] D. P. Kovesi, “What are Log-Gabor Filters and why are they good?” http://www.csse.uwa.edu.au/∼pk/Research/MatlabFns/ PhaseCongruency/Docs/convexpl.html, 2006. [29] J.-T. Chien and C.-C. Wu, “Discriminant waveletfaces and nearest feature classifiers for face recognition,” IEEE Transactions on Pattern Analysis and Machine Intelligence, vol. 24, no. 12, pp. 1644–1649, 2002.
Jamie Cook received Bachelors degrees in Information Technology and Electronic Engineering from the Queensland University of Technology, Brisbane, Australia. He is currently pursuing his PhD in 3D Face Recognition in the Image and Video Research Laboratory also at QUT. His research interests include biometrics, Scale-Space techniques, Gabor filters and other biologically motivated computer vision techniques.
Vinod Chandran is an Associate Professor at Queensland University of Technology, Brisbane, Australia. Dr. Chandran holds a PhD in Electrical and Computer Engineering from Washington State University. His research interests include biometrics, higher order spectra and applications of nonlinear signal and image processing techniques to pattern recognition problems.
Sridha Sridharan has a BSc (Electrical Engineering) degree and obtained a MSc (Communication Engineering) degree from the University of Manchester Institute of Science and Technology (UMIST), UK and a PhD degree in the area of Signal Processing from University of New South Wales, Australia. He is a Senior Member of the Institute of Electrical and Electronic Engineers - IEEE (USA). He is currently with the Queensland University of Technology (QUT) where he is a full Professor in the School of Engineering Systems. Professor Sridharan is the Deputy Director of the Information Security Institute and the Leader of the Research Program in Speech, Audio, Image and Video Technologies at QUT. In 1997, he was the recipient of the award of Outstanding Academic of QUT in the area of research and scholarship.