Multi-Scenario, Multi-Objective Optimization Using. Evolutionary Algorithms: Initial Results. Kalyanmoy Deb, Ling Zhu, and Sandeep Kulkarni. Department of ...
Multi-Scenario, Multi-Objective Optimization Using Evolutionary Algorithms: Initial Results Kalyanmoy Deb, Ling Zhu, and Sandeep Kulkarni Department of Computer Science Michigan State University East Lansing, MI 48824, USA Email: {kdeb,zhuling,sandeep}@msu.edu COIN Report Number 2015005 Abstract—Most designs in practice go through a number of different loading or operating conditions. Therefore, a meaningful and resilient design must be such that it performs well under all such scenarios. Despite its practical importance, multi-scenario consideration has not been paid much attention in multi-objective optimization literature. In this paper, we address this challenging issue by suggesting an aggregate based handling of multiple scenarios and contrasts the proposed approach against a recently suggested approach which involves running multi-objective optimization multiple times and a rigid decision-making method. The proposed method is applied to two numerical test problems and two engineering design problems. This first evolutionary based multi-scenario, multi-objective optimization study should spur further interests among EMO researchers.
I. I NTRODUCTION A real-world design problem, after its implementation, usually goes through a number of different scenarios during its life time. They could be different loading conditions or other operating conditions or even unexpected contingencies for which the original design was probably not accounted for. Consider, for example, the design or a bridge over a river. A structural engineer will design the bridge for different loading conditions, such as (i) a scenario depicting a bumper-to-bumper traffic jam over the bridge providing the largest vertical loading that the bridge has to withstand, (ii) a scenario for which a series of cars zipping through the bridge at a very high speed, thereby causing a periodic dynamic load, (iii) a scenario in which a hurricane at 200 miles/hr passes through the bridge thereby providing a large side-wise load, (iv) a scenario in which an accident occurring on the bridge has destroyed a key support member of the bridge, and others. Over a span of 100 years of life of the bridge, each of the above scenarios is a possibility and a designer must take into considerations each such scenario in designing the bridge and make sure that the bridge is safe under each such scenario. A designer may also consider catastrophic scenarios, such as an effect of an earthquake, which may have a very small probability to happen. We realize that such rare but highly catastrophic events require special treatments and we do not consider them in this paper. In most design optimization studies, a single scenario of loading or operating conditions is considered and an optimal design is obtained for that scenario. From a practical standpoint, such a design is meaningless, as it is expected that a design will go through a number of different scenarios in its
life of operation. To take care of multiple scenarios into design, designers usually follow an easy path. The worst scenario is identified and an optimal design is found for the worstcase scenario. Since it is not an easy task to know before hand which scenario is worst, in some occasions, the worst objective function value of K scenarios is minimized. For a single-objective optimization problem: minimize f (x), subject to gj (x) ≤ 0 for j = 1, 2, . . . , J, the following optimization problem is formed and solved: � � Minimize max �f 1 (x), f 2 (x), . . . , f K (x)� , Subject to max gj1 (x), gj2 (x), . . . , gjK (x) ≤ 0, ∀j. (1) There is no denying the fact that every constraint must be satisfied under every scenario, otherwise the solution will be considered to have failed under that scenario. Thus, the use of a max (or worst) function for the constraints is justified, but the use of a max function for the objective function may make the overall design too restrictive, demanding, or pessimistic. A weighted average of objectives due to different scenarios would be a better approach. There exists a number of multiscenario studies in the context of single-objective optimization problems [1], [2]. However, there does not exist too many studies for considering multiple scenarios in the context of multi-objective optimization. Besides a few studies, a formal treatment was provided through a couple of studies elsewhere [3], [4]. In this paper, we follow up on these studies and raise some computational and decision-making concerns. Authors of these earlier studies suggested an optimization-cum-decision-making procedure of handling multiple scenarios that results in a single solution purely based on geometric deviation of its objective values under different scenarios. We argue that such a pre-determined decision-making strategy is against the general philosophy of multi-objective optimization and decision-making. The latter is usually achieved through relative preference information among different objectives and a great deal of efforts are usually spent in analyzing trade-off solutions to arrive at a single preferred solution [5], [6]. In this paper, we suggest a different procedure of handling multiple scenarios which maintains the multi-objective problem solving principle and demonstrate its working on a number of test and engineering design problems. Handling multiple scenarios during a design optimization phase is highly practical. The lack of adequate studies of handling multiple scenarios in
multi-objective optimization is a bottleneck and we hope this study will be motivating to interested researchers to pay more attention to this important task in the coming years. In the remainder of this paper, we make a brief description of the existing multi-scenario optimization problems, particularly in the context of multi-objective optimization problems in Section II. The difficulties associated with the existing methods is discussed next. Thereafter, we propose a new methodology for solving multi-scenario, multi-objective optimization based on evolutionary algorithms in Section III. We help explain the differences of our proposed method with the existing methods through a numerical bi-objective optimization problem used in the literature. Then in Section IV, we consider a biscenario version of ZDT1 problem and two engineering design problems to evaluate the proposed methodology. ZDT1 test problem helps us evaluate if our proposed methodology is able to reach the true Pareto-optimal front and the two application problems demonstrate its practical usefulness. Finally, Section V concludes this study and outlines a number of future studies. II.
E XISTING M ULTI -S CENARIO , M ULTI -O BJECTIVE O PTIMIZATION M ETHODS There exist very few studies on multi-scenario, multiobjective optimization in either algorithm development or in applications. Most existing related studies dealing with multiple scenarios consider the existence of different scenarios as an uncertainty in problem parameters (loading or operating conditions) [7], [8], [9]. Thereafter, they treat the problem as a stochastic uncertainty-based optimization problem and look for robust or reliable solutions. It is clear that such a treatment is valid as long as the uncertainty level (or difference in loading or operating conditions) is small. In the context of a structural bridge design problem discussed above under a vertical loading condition arising from heavy traffic on the bridge is quite different from a lateral loading arising from a hurricane. A study [10] aggregated scenarios and considered each objective as an criteria. However, only a geometric mean of all possible scenarios is suggested as an aggregate function. There also exists scenario-based multi-objective optimization problems. In [11] authors constructed a multi-objective problem by applying a weighted-sum all objectives for a scenario and each scenario is then considered as an objective value. Due to the similarity of our proposed approaches with two recently proposed methods [3], [4], we discuss these studies in more details here. In these studies, authors proposed a scenario-oriented approach in which an individual trade-off set (P OF k ) is first found for each scenario (k-th) by optimizing all M objective functions, as given below: � k � k Minimize f1 (x), f2k (x), . . . , fM (x) , Subject to gjk (x) ≤ 0, j = 1, 2, ..., J k , k = 1, 2, . . . , K. (2) Notice that for each such multi-objective optimization, a solution is declared feasible only if it is feasible under all scenarios. One criticism of this approach is the need for running multiobjective optimization multiple (K) times. There is also an issue with the decision-making procedure associated with the overall approach, which we discuss next. For decision-making purposes, authors of [4] proposed to choose a preferred solution from one of the trade-off set (P OF k ) using any decision-making method [6], [12]. If the
chosen solution (say xk ) is also a member of all other tradeoff sets, it is the final solution of the multi-scenario, multiobjective optimization problem. This makes sense as if a solution is found to be the most preferred solution for a particular scenario, and it is also Pareto-optimal to all other scenarios, it is clearly a good overall solution. However, due to differences in scenarios, this is an unlikely event. In the event the above is not true, a set of constraints are constructed by allowing only a pre-specified �-dominant solutions to xk to be feasible for optimizing the other scenario-based problems. This is continued for all other trade-off sets and a single solution satisfying the �-domination principle is found, it is declared as the final solution. If not, the original preferred solution xk is changed or �-vector is relaxed, and the above procedure is continued until such a solution is found. Authors demonstrated their principle to two-objective problems only, hence the exact methodology in three or more objectives is unclear and certainly different ideas can be tried to find an acceptable solution. Authors of [3] suggested a different approach. Every pair of POFs (say, P OF i and P OF j ) are considered and the shortest normalized Euclidean distance of every solution in P OF i from P OF j is computed. Similarly, distances from P OF j to P OF i are also computed. Then one solution from each POF which is closest (but not largest) to a pre-specified threshold value is identified. Thereafter, the solution that is furthest from the objective-wise extreme solutions is chosen. Our criticism to these decision-making approaches is as follows. Multi-objective decision-making approaches start with analyzing multiple trade-off solutions in an M -dimensional objective space. Different methodologies involving many different ways of eliciting preference information are used to arrive at a single preferred solutions [6], [12]. Although, the decision-making through preference information takes place only in one of the trade-off efficient front for a particular scenario, for other trade-off frontiers, the decision-making is geometry based, which may be highly questionable in practice. The decisions made in practice are mostly motivated by some other high-level problem information, user-specific preference based, or in tune with an industry’s motto for quality or quantity based practices. But in these papers, authors have proposed decision-making methodologies that are based on geometric distance between objective points in two scenario spaces, which may not be agreeable to decision-makers in general. We argue that by specifying a decision-making this way, authors have taken away the liberty and principles of decision-making practices from the decision-makers. III. P ROPOSED E VOLUTIONARY M ULTI -S CENARIO M ULTI -O BJECTIVE O PTIMIZATION (EMMO) M ETHOD Our proposed approach to handling multi-scenario, multiobjective optimization problem is to follow method (b) mentioned in Section I and combine all scenarios for each objective function and construct one aggregate function for k each objective function. Let us denote fm (x) as the m-th k objective function for k-th scenario and gj (x) ≤ 0 is the jth inequality constraint for k-th scenario. Instead of multiple runs of different multi-objective optimizations, our proposed optimization problem is to solve the following problem: � K k � k K k Minimize �k=1 f1 (x), �K k=1 f2 (x), . . . , �k=1 fM (x) , Subject to gjk (x) ≤ 0, j = 1, 2, ..., J k , k = 1, 2, . . . , K. (3)
K
k k �K k=1 fm (x) = max fm (x), k=1
(4)
thereby evaluating the worst value for all K scenarios, or a weighted average of all scenarios: k �K k=1 fm (x) =
K �
k wk fm (x),
(5)
k=1
for which a predefined weight vector w is supplied to indicate the of some scenarios over the other. In this case, � preference K = 1 w = 1. Some other aggregate functions [13] k k can also be used. Importantly,for every objective function a different aggregate function can be used as well. It is important to note that while a designer is free to choose any reasonable aggregate function, a feasible solution x must satisfy all constraints under all scenarios. The above formulation can be extended for equality constraints and variable bounds, if any, present in a problem. The above formulation collapses multiple scenarios to be produce a single objective function for each objective, thereby making the above problem an M -objective optimization problem. Thus, when optimized using an EMO [14] or a generative classical multi-objective optimization method [6], a set of trade-off Pareto-optimal solutions (in the original M dimensional objective space) corresponding to the aggregate functions will be obtained. Once the trade-off solutions are found, they can be presented to the decision-makers as usual and an a-posteriori multi-criterion decision making (MCDM) method [15] can be performed using decision-maker’s preference information to choose a single preferred solution. A. Differences with Existing Method First of all, our approach does not require to solve K many-objective optimization problems. Instead, a single multiobjective optimization is enough. Since an aggregate function optimization (such as, the worst case consideration) may make the overall multi-objective optimization non-differentiable and non-convex, the authors of previous studies [3], [4] may have taken the multiple optimization route, but since we plan to use an evolutionary multi-objective optimization method to solve the resulting aggregate-based multi-objective problem (stated in Equation 3), a proposal to solve a non-differentiable or nonconvex problem to obtain an near efficient set is pragmatic. Secondly, our approach produces one trade-off set in the M -dimensional objective space, like in single-scenario multiobjective optimization. Thus, standard multi-criterion decisionmaking methods can be applied to the obtained set of tradeoff solutions to choose a single preferred solution. In fact, the availability of objective values under different scenarios for each trade-off solution may provide addition decisionmaking information. A solution that has smaller scenario-wise difference may be more preferred than a solution having a large difference – a matter which is solely considered in the existing studies [4], but here such differences can be combined with other preference information of objectives (such as predefined reference points, trade-off rates, etc.) to make a comprehensive decision-making task. In this respect, from both computational point of view (one multi-objective optimization versus many) and decision-making point of view (more flexible and following standard practices).
B. Proof-of-Principle Results To illustrate the working of the existing method [4] and our approach, we consider the two-scenario, two-objective numerical problem from the existing study. The problem has two variables, as given below: Minimize
� 1 f1 = (x1 − 2)2 + (x2 − 1)2 , f 2 = (x1 − 1)2 + (x2 + 1)2 , � 11 f2 = x21 + (x2 − 3)2 , f2 (x1 , x2 ) f22 = (x1 + 1)2 + (x2 − 1)2 , 2 Subject to x1 − x2 ≤ 0, x1 + x2 ≤ 2, x1 ≤ 1.
for for for for
f1 (x1 , x2 )
SC SC SC SC
1, 2, 1, 2,
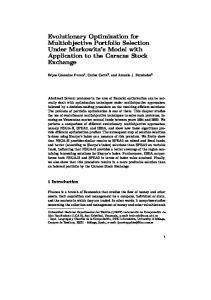
(6) Say, we denote the feasible space as X . As discussed before, the existing scenario-wise method requires to solve the following two, two-objective optimization problems: � Minimize {f11 (x1 , x2 ), f21 (x1 , x2 )}, (7) Subject to x ∈ X , � Minimize {f12 (x1 , x2 ), f22 (x1 , x2 )}, (8) Subject to x ∈ X , In all simulations here, we use NSGA-II method with a population size = 100, SBX recombination operator [16] with pc = 0.8 and index ηc = 10, and polynomial mutation operator [14] with pm = 0.5 and index ηm = 20. A maximum generation of 500 is used. Figure 1 shows the efficient solutions of the above two optimization runs in blue and green points, respectively, on Scenario 1 objective space. Since the blue points are optimized Clemson Numerical − Scenario1 11 10 9 8 7 f2
The operator � creates the aggregate function. For a minimization problem, the aggregate function can be the max function:
6 SC1 SC2 Worst−Case Average−Case Final Solution
5 4 3 2 1 1
2
3
4 f1
5
6
7
Fig. 1. Non-dominated fronts for different aggregation based multi-objective optimization runs plotted in Scenario 1 based objective space for the numerical problem.
for Scenario 1, it is not surprising that the green points appear to be dominated by the blue points. Similarly, Figure 2 shows the efficient solutions of above two optimizations in Scenario 2 objective space. Now, green points (trade-off solutions obtained for Scenario 2) dominates the blue points (trade-off solutions obtained for Scenario 1). These efficient fronts are exactly the same as those presented in the original existing study [4].
Clemson Numerical − Scenario2 4 SC1 SC2 Worst−Case Average−Case Final Solution
3.5
3
these figures, Figures 4 and 5 show all four efficient fronts in average-case and worst-case objective spaces, respectively.
Numerical Problem Average−Case Objective Space
f2
6 2.5
SC1 SC2 Worst−Case Average−Case Final Solution
5.5 5
2
4.5 4 f2
1.5
3.5 1
2
4
6
8
3
10
f1
2.5
Fig. 2. Non-dominated fronts for different aggregation based multi-objective optimization runs plotted in Scenario 1 based objective space for the numerical problem.
2 1.5 2
4
6
8
f1
After two multi-objective optimizations, a decision-making task is performed carried out to choose a single preferred solution. Shortest normalized distances between every point in blue front to every point in green front are computed and plotted in Figure 3. If a threshold of 0.55 is used, as an example, to illustrate the working of the procedure, a solution (marked with a pink diamond) from the green front is closest to the threshold. Hence, this solution is the final result of the overall procedure. It is clear from the above computational efforts
Fig. 4. Non-dominated fronts for different aggregation based multi-objective optimization runs plotted in average-case objective space for the numerical problem.
Numerical Problem Worst−Case Objective Space 9
SC1 SC2 Worst−Case Average−Case Final Solution
8 1
7
POF1 to SC2 sol 0.9
2
POF to SC1 sol
6
Threshold=0.55
f2
Final Solution
0.8
5 4
distance
0.7
3
0.6
2 0.5
1 2 0.4
0
10
20
30
40 50 60 design number
70
80
90
100
4
6 f1
8
10
Fig. 5. Non-dominated fronts for different aggregation based multi-objective optimization runs plotted in worst-case objective space for the numerical problem.
Fig. 3. Shortest normalized Euclidean distance between Scenario 1 and Scenario 2 fronts for the numerical problem.
that (i) the existing approach requires many multi-objective optimization runs, and (ii) importantly employ a geometrybased decision-making approach that incommensurates with the standard practices. The final outcome also depends on the chosen threshold parameter. Our proposed approach avoids geometric distance computations, but suggest to use one of the aggregation methods to find a trade-off front and then follow an usual decisionmaking procedure to select a preferred solution. Figures 1 and 2 also show the average and worst-case aggregation based optimization results. Although they do not appear as a front in
Figure 6 shows the x1 -x2 points for all four methods. It is clear that solutions for Scenarios 1 an 2 are quite different and our proposed approaches make a good compromise to take care of both scenarios.
IV. R ESULTS In this section, we present results of our approach to one test problem and two engineering design problems.
ZDT1 Average−Case Objective Space
SC1 SC2 WorstCase Average
1.8
x2
1
0.5 0
3 2 1 0.2
0.4
0.6
0.8
1
f1
0.4 0.2 0
0.2
0.4
0.6
0.8
1
x1
Fig. 6. Optimized solution sets for all four methods for the numerical problem.
A. ZDT1 Test Problem We modify ZDT1 problem [17] into a two-scenario, twoobjective optimization test problem: � 1 (x1 ) = x1 , f2 (x) = g(1 − ( fg( x) )) n � xi /(n − 1), for SC 1, 0.6 + 11 i=2 = n � 2 1 + 9 (xi − 0.5) /(n − 1), for SC 2, i=2
subject to
4
1
0.6
g(x)
5
1.5
0.8
f1 (x1 )
3
0 ≤ xi ≤ 1.
(9) The first objective is identical to the original ZDT1 problem, but the second objective varies according two scenarios. Since the g() function is different for two scenarios, the corresponding Pareto-optimal solutions for each scenario are also different from each other. For the first scenario, xi = 0 for i ≥ 2 are Pareto-optimal and for the second scenario, xi = 0.5 for i ≥ 2 are Pareto-optimal. Since two scenarios are expected to produce two different Pareto-optimal fronts, it is of interest to investigate what solutions will correspond to the solution to the above bi-scenario, bi-objective problem. An identical NSGA-II parameter setting to that in the previous problem is used here. Our approach uses a suitable aggregation of two scenarios for each objective and an EMO method is used to find the respective Pareto-optimal solutions. Figure 7 shows the obtained non-dominated front (red ‘+’ points) with an average aggregate of two scenarios. The obtained solutions are in the average aggregate objective space. The same problem is solved for three other aggregate functions for each objective for a comparison. The blue square points represent solutions obtained by using a weighted average aggregate function for each objective with (1, 0)T weight vector. The green circle points represent solutions obtained by using a weighted average aggregate function for each objective with (0, 1)T weight vector. The cyan ∇-points represent by using the worst-case aggregate function for each objective. There are a few observations which are made from this figure. It is important to note that all the four optimization results are plotted in the average aggregate objective space for which the x-axis values are calculated as 0.5f11 (x) + 0.5f12 (x) and
SC1 SC2 Worst−Case Average−Case
6
2.5 2
1.2
Minimize
3.5
f2
1.4
7
SC1 SC2 Worst−Case Average−Case
f2
1.6
0
ZDT1 Worst−Case Objective Space
4
2
Fig. 7. Non-dominated fronts for different aggregation based multiobjective optimization runs plotted in average based objective space for ZDT1.
0 0
0.2
0.4
0.6
0.8
1
f1
Fig. 8. Non-dominated fronts for different aggregation based multiobjective optimization runs plotted in worst-case objective space for ZDT1.
y-axis values are calculated as 0.5f21(x)+0.5f22(x). Naturally, the average aggregate results dominates the other three optimization results in this specific objective space. Interestingly, the weighted average aggregate optimization with (1, 0)T weight vector is slightly worse than the average aggregate front and the worst-case aggregation based solutions are also close to the average aggregation based solutions. This implies that the first scenario makes the objective functions more predominant than the second scenario. In practice, users are expected to run only one of these cases to obtain a complete Pareto-optimal front, which then can be aided with a decisionmaking approach to choose a single preferred solution. Here, we show the sensitivity of the obtained efficient fronts with respect to the aggregate function chosen in the optimization process. Different aggregation based optimization results can provide an insight about relation importance of one scenario over the others. Next, in Figure 8, we plot all four optimized efficient fronts on the worst-case objective space (x-axis is computed using max(f11 (x), f12 (x)) and y-axis is computed using max(f21 (x), f22 (x))). It is clear from the figure that the worstcase solutions now dominate the other three fronts. The average aggregate solutions (red ‘+’ points) relatively closer to the worst-case objective values, followed by the weighted average with w = (1, 0)T objective values. As found in the previous figure, the weighted average with w = (0, 1)T objective values are quite different from the worst-case solutions. Figures 9 and 10 show all four trade-off fronts in Scenario 1 (f11 (x)-f21 (x)) and Scenario 2 (f12 (x)-f22 (x)) based objective spaces, respectively. Similar conclusions are made about the relative closeness of the solutions in the respective objective spaces. In Figure 9, Scenario 1 based results dominate all other fronts and in Figure 10, Scenario 2 based results dominate all other fronts. Figure 11 shows the x1 -x2 points for all four methods. It is clear that solutions for Scenarios 1 an 2 are quite different, while our proposed approaches make a good compromise to take care of both scenarios. B. Three-bar Truss Design Problem We now consider a three-bar truss design problem which was used in [3]. The truss is shown in Figure 12. The three-bar truss problem is subject to two different static loadings applied at node D which are considered as two scenarios. The two scenarios and two objectives – (i) minimization of total weight
ZDT1 Scenario 2
ZDT1 Scenario 1
3.5
SC1 SC2 Worst−Case Average−Case
6 5
2.5 2 f2
f2
4 3
1.5
2
1
1
0.5
0 0
SC1 SC2 Worst−Case Average−Case
3
0.2
0.4
0.6
0.8
0 0
1
0.2
f1
Fig. 9. different objective Scenario ZDT1.
0.4
0.6
0.8
1
Fig. 12.
Two-scenario three-bar truss design problem.
f1
Non-dominated fronts for aggregation based multioptimization runs plotted in 1 based objective space for
Fig. 10. Non-dominated fronts for different aggregation based multiobjective optimization runs plotted in Scenario 2 based objective space for ZDT1.
predominant effect to the objective values than Scenario 1. Three Bar Truss Problem Average−Case Objective Space 1
Three Bar Truss Problem Worst−Case Objective Space 1
SC1
SC1 SC2 Worst−Case Average−Case
SC2 0.8
0.8
Worst−Case Average−Case
0.7 0.6
0.6
0.6
0.5
f2
SC1 SC2 WorstCase Average
f2
0.8
0.4
0.4
0.2
0.2
0 0
0.2
0.4
0.6
0.8
0 0
1
0.2
0.4
Fig. 13. Non-dominated fronts for different aggregation based multiobjective optimization runs plotted in average-case objective space for the three-bar truss design problem.
0.8
1
0.2 0.1 0
0
0.2
0.4
0.6
0.8
1
x1
Optimized solution sets for all four methods for ZDT1.
of bars and (ii) minimization of the displacement at node D – are considered. The variables are three cross-sectional areas of these three bars: x1 , x2 , and x3 . √ Minimize f1 (x1 , x2 , x3 ) = ρL( 2x1 + x2 + 2x3 ), Minimize f2 (x1 , x2 , x3 ) = dj (x1 , x2 , x3 ) subject to σij (x1 , x2 , x3 ) ≤ Sy , i = 1, 2, 3, j = 1, 2, 10 ≤ xi ≤ 200, i = 1, 2, 3, (Fx , Fy ) = (20kN, −20kN ), for SC1, (Fx , Fy ) = (−20kN, −20kN )for SC2. (10) The first objective function does not depend on two scenarios, whereas the second objective does. The function σij (x) is the stress developed in the i-th bar under j-th scenario. It is a function of the loads (Fx , Fy ) and truss dimensions. The stress must be smaller than the allowable strength of the chosen material (Sy = 200 MPa is assumed here). The above formulation requires that all six stress constraints must be satisfied for a solution x to be feasible. Identical NSGA-II parameters to that in previous problems are used here. Figure 13 shows the non-dominated fronts in the average aggregate objective space. Clearly, the corresponding average aggregate based trade-off solutions dominate or are non-dominated to other three optimization runs. Here, the Scenario 1 based optimization results are dominated by other three aggregate runs. This implies that Scenario 2 has a more
Fig. 14. Non-dominated fronts for different aggregation based multiobjective optimization runs plotted in worst-case objective space for the three-bar truss design problem.
Figure 14 shows the results of four different optimization runs on the worst-case objective space. The worst-case and average case results indicate an almost identical efficient fronts and Scenario 1 based objective values are dominated by other three fronts. A plot of all four efficient fronts, when plotted in Scenario 1 based objective space (Figure 15), the difference among the objective values get clear. Average-case objective values are closer to Scenario 1 based objective values, but the Scenario 2 based objective values are maximally different from the Scenario 1 objective values. A similar conclusion is also made from Figure 16 in which all four efficient fronts are plotted in Scenario 2 based objective space. Three−bar Truss problem Scenario 1
Three−bar Truss problem Scenario 2
1
1 SC1 SC2 Worst−Case Average−Case
0.8
SC1 SC2 Worst−Case Average−Case
0.8
0.6
0.6 f2
0.3
Fig. 11.
0.6 f1
0.4
f2
x2
f1
0.4
0.4
0.2
0.2
0 0
0.2
0.4
0.6
0.8
1
f1
Fig. 15. Non-dominated fronts for different aggregation based multiobjective optimization runs plotted in Scenario 1 based objective space for the three-bar truss design problem.
0 0
0.2
0.4
0.6
0.8
1
f1
Fig. 16. Non-dominated fronts for different aggregation based multiobjective optimization runs plotted in Scenario 2 based objective space for the three-bar truss design problem.
The results and their plots so far indicates the following observations:
C. Cantilever Beam Design Problem Finally, we consider a cantilever beam design problem with three variables (width x1 and height x2 of the rectangular cross-sectional area, and length x3 of the beam, in inches) and two objectives – minimization of weight (f1 ), and minimization of stored strain energy (f2 ), under two different loading conditions. Figure 17 shows a sketch of the welded beam. Scenario 1 has an end load (F ) and Scenario 2 uses
where F =6,000 lb, T =25,000 lb-in, ρ = 0.248 lb/in3 , E = 29.0(106) psi, G =11.5(106) psi. Parameters c1 and c2 depend on x1 /x2 ratio and is taken from [18]. NSGA-II with identical parameter setting as in the previous case studies is used to optimize two-objective problems. Figure 18 shows the non-dominated front of the averagecase aggregation of scenarios. We plot the objective values in the average f1 -f2 space. Apparently, all four optimizations Cantilever Beam Design Problem Average−Case Objective Space 150
SC1 SC2 Worst−Case Average−Case
100 f2
1. The trade-off solutions from a particular aggregation of scenarios when plotted in the same objective space dominate (or are non-dominated to) other aggregation based Pareto-optimal solutions plotted in the same space. This is always true, as an optimization run is expected to produce the best non-dominated set of solutions. We consistently observe this fact on all problems considered so far, thereby confirming the accuracy of the optimization procedure used in this study. 2. It is also interesting to observe that the average and worst-case efficient points lie within Scenario 1 and Scenario 2 based efficient points in the latter two objective spaces. This is not intuitive and requires additional theoretical analysis to confirm its validity on all problems. 3. Except the efficient front plotted on the same objective space, all other efficient fronts need not exhibit a nondominated structure. 4. The relative positioning of different aggregate based approaches from the two extreme Scenario 1 and Scenario 2 based fronts provide a clear idea of relative predominance structure of one scenario over the other. This is interesting, as it is likely to provide decision-makers additional information about the importance of different scenarios in the performance of their final preferred solution.
50
0 0
100
200 f1
300
400
Fig. 18. Non-dominated front for multi-objective optimization with average case aggregation for the cantilever beam design problem.
(average-case, worst-case, Scenario 1 case and Scenario 2 case) produce a very similar trade-off front for this problem. This implies that none of the two scenarios are overly predominant to each other and the loading cases are such that they have similar effect on the obtained optimized solutions. A similar observation can be made from the re-plot of all four efficient fronts in the worst-case objective space (Figure 19). However, in Scenario-based objective space plots Cantilever Beam Design Problem Worst−Case Objective Space 250 SC1 SC2 Worst−Case Average−Case
200
A cantilever beam design problem is subjected to two scenarios.
150 f2
Fig. 17.
a torque load (T ), as shown in the figure. The end load will develop a maximum bending stress (σ) and the torque load will develop a shear stress (τ ) at the root of the beam. The complete optimization problem using our proposed generic strategy (Equation 11) is given below: Minimize f1 (x1 , x2 , x3 ) = ρx1 x2 x32, 3 f 1 = 2F x33 , for SC 1, 2 Ex1 x2 f2 (x1 , x2 , x3 ) T 2 x3 f22 = , for SC 2, 2c2 Gmax(x1 ,x2 )min(x1 ,x2 )3 � 6F x3 ρ = x1 x2 , 2 subject to T , τ = max(x ,x c)1min (x1 ,x2 )2 1 2 1 ≤ (x1 , x2 ) ≤ 10, 15 ≤ x3 ≤ 25, (11)
100
50
0 0
100
200 f1
300
400
Fig. 19. Non-dominated front for multi-objective optimization with worstcase aggregation for the cantilever beam design problem.
in Figures 20 and 21, the difference between the four efficient fronts is significant. Again, the worst and average efficient fronts lie within Scenario 1 and Scenario 2 efficient fronts in these two figures. The fact that both average and worst-case
efficient fronts are somewhat clustered in the middle of the two individual Scenario-based efficient fronts reiterates the almost equal importance of two scenarios on the optimized solutions. Cantilever Beam Design − Scenario1
Cantilever Beam Design − Scenario2
140
140 SC1 SC2 Worst−Case Average−Case
120 100
SC1 SC2 Worst−Case Average−Case
120 100
f2
80
f2
80 60
60
40
40
20
20
0 0
100
200 f1
300
0 0
400
Fig. 20. Non-dominated front for multi-objective optimization with Scenario 1 based objective space for the cantilever beam design problem.
100
200 f1
300
400
Fig. 21. Non-dominated front for multi-objective optimization with Scenario 2 based objective space for the cantilever beam design problem.
Of the three variables of this problem, all optimized solutions have one common property: length of the beam (x3 ) is exactly equal to its lower bound (15 in). However, different optimization runs converge to different x1 -x2 combinations, as shown in Figure 22 . Our worse-case and average case compromise solutions are in between two scenarios, revealing the way our procedure is able to find compromise solutions between two scenarios. Solutions from two scenarios are efficient for the respective scenario, but are not efficient in the other scenario; whereas the solutions of the aggregate approach make a good compromise between both scenarios and make a good trade-off in performing well under both scenarios in practice. 10 9 8
x2
7 6 5
SC1 SC1 WorstCase Average
4 3 2
2
4
6
8
10
x1
Fig. 22. Different x1 -x2 combinations for different multi-objective optimization runs for the cantilever design problem.
It is clear from these examples that our method to find trade-off solutions using an aggregate objective of all scenarios produces compromise solutions that lie usually in the intermediate region of the individual scenario-based tradeoff solutions. The amount of compromise from each scenario provides useful information about relative importance of one scenario over the other and this information may also be useful as a decision-making aid for choosing a single preferred
solution. Importantly, our approach keeps the overall structure of optimization and decision-making in tune with standard practices of solving multi-objective optimization problems. V. C ONCLUSIONS In this paper, for the first time, we have applied an evolutionary multi-objective optimization (EMO) approach to solve multi-scenario, multi-objective optimization problems. Despite the importance of handling multiple scenarios in multiobjective design and other practical applications, the literature does not provide too many studies. One particular study has suggested a computationally expensive procedure in multiple multi-objective optimization runs are proposed before choosing a single preferred solution. Moreover, the decision-making procedure is based on geometric closeness of trade-off front of one scenario from that of another scenario. This reduces the flexibility of the decision-making process and makes the approach impractical. In this paper, we have suggested one viable approach which aggregates different scenarios of each objective function to constitute a single multi-objective optimization problem. Although practitioners are free to choose any aggregation method, the procedure allows the use of an EMO procedure and a subsequent decision-making strategy to choose a single preferred solutions, thereby restoring the standard practices of executing a multi-objective optimization and decision-making study for multi-scenario problems. The working of the proposed methodology has been demonstrated on two numerical and two engineering design problems. Results have indicate consistent relationships between different aggregation methods. This first study has shown promise to try the approach to more real-world problems involving three or more scenarios and three more objectives. R EFERENCES [1] C. D. Laird and L. T. Biegler, Large-Scale Nonlinear Programming for Multi-scenario Optimization. Springer, 2008, pp. 323–336. [2] D. Varvarezos, L. Biegler, and I. Grossmann, “Multi-period design optimization with sqp decomposition,” Comp. Chem. Eng., vol. 18, no. 7, pp. 579–595, 1994. [3] M. M. Wiecek, V. Singh, and V. Blouin, “Multi-scenario multi-criteria optimization in engineering design,” DTIC Document, Tech. Rep., 2007. [4] M. M. Wiecek, V. Y. Blouin, G. M. Fadel, A. Engau, B. J. Hunt, and V. Singh, “Multi-scenario multi-objective optimization with applications in engineering design,” in Multiobjective Programming and Goal Programming. Springer, 2009, pp. 283–298. [5] R. L. Keeney and H. Raiffa, Decisions with Multiple Objectives: Preferences and Value Tradeoffs. New York: Wiley, 1976. [6] K. Miettinen, Nonlinear Multiobjective Optimization. Boston: Kluwer, 1999. [7] P. Kouvelis and G. Yu, Robust discrete optimization and its applications. Springer, 1997, vol. 14. [8] M. Campi and G. Calafiore, “Decision making in an uncertain environment: the scenario-based optimization approach,” Multiple Participant Decision Making, pp. 99–111, 2004. [9] H.-G. Beyer and B. Sendhoff, “Robust optimization–a comprehensive survey,” Computer methods in applied mechanics and engineering, vol. 196, no. 33, pp. 3190–3218, 2007. [10] G. Palermo, C. Silvano, and V. Zaccaria, “Robust optimization of soc architectures: A multi-scenario approach,” in Embedded Systems for Real-Time Multimedia, 2008. ESTImedia 2008. IEEE/ACM/IFIP Workshop on. IEEE, 2008, pp. 7–12. [11] C.-S. Wang, B. Yu, J. Xiao, and L. Guo, “Multi-scenario, multiobjective optimization of grid-parallel microgrid,” in Electric Utility Deregulation and Restructuring and Power Technologies (DRPT), 2011 4th International Conference on. IEEE, 2011, pp. 1638–1646.
[12] [13]
[14] [15]
[16] [17]
[18]
V. Chankong and Y. Y. Haimes, Multiobjective Decision Making Theory and Methodology. New York: North-Holland, 1983. L. Zhu, K. Deb, and S. Kulkarni, “Multi-scenario optimization using multi-criterion methods: A case study on byzantine agreement problem,” in Proceedings of World Congress on Computational Intelligence (WCCI-2014), Piscataway, NJ: IEEE Press, 2014, pp. 2601–2608. K. Deb, Multi-objective optimization using evolutionary algorithms. Chichester, UK: Wiley, 2001. J. Branke, K. Deb, K. Miettinen, and R. Slowinski, Multiobjective optimization: Interactive and evolutionary approaches. Springer, 2008, vol. 5252. K. Deb and R. B. Agrawal, “Simulated binary crossover for continuous search space,” Complex Systems, vol. 9, no. 2, pp. 115–148, 1995. E. Zitzler, K. Deb, and L. Thiele, “Comparison of multiobjective evolutionary algorithms: Empirical results,” Evolutionary computation, vol. 8, no. 2, pp. 173–195, 2000. S. H. Crandall, N. C. Dahl, and T. J. Lardner, Introduction to the Mechanics of Solids. McGraw-Hill Publishing Company, 1978.