Multi-sensor Integration for Unmanned Terrain Modeling Sreenivas R. Sukumar*, Sijie Yu, David L. Page, Andreas F. Koschan, Mongi A. Abidi Imaging, Robotics, and Intelligent Systems Laboratory, Department of Electrical and Computer Engineering, The University of Tennessee, Knoxville, TN, USA 37996-2100
ABSTRACT State-of-the-art unmanned ground vehicles are capable of understanding and adapting to arbitrary road terrain for navigation. The robotic mobility platforms mounted with sensors detect and report security concerns for subsequent action. Often, the information based on the localization of the unmanned vehicle is not sufficient for deploying army resources. In such a scenario, a three dimensional (3D) map of the area that the ground vehicle has surveyed in its trajectory would provide apriori spatial knowledge for directing resources in an efficient manner. To that end, we propose a mobile, modular imaging system that incorporates multi-modal sensors for mapping unstructured arbitrary terrain. Our proposed system leverages 3D laser-range sensors, video cameras, global positioning systems (GPS) and inertial measurement units (IMU) towards the generation of photo-realistic, geometrically accurate, geo-referenced 3D terrain models. Based on the summary of the state-of-the-art systems, we address the need and hence several challenges in the real-time deployment, integration and visualization of data from multiple sensors. We document design issues concerning each of these sensors and present a simple temporal alignment method to integrate multi-sensor data into textured 3D models. These 3D models, in addition to serving as apriori for path planning, can also be used in simulators that study vehicle-terrain interaction. Furthermore, we show our 3D models possessing the required accuracy even for crack detection towards road surface inspection in airfields and highways. Keywords: terrain modeling, unstructured terrain mapping, airfield/road surface inspection
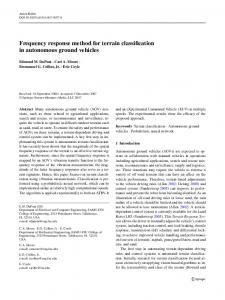
1. INTRODUCTION Unmanned vehicles have been deployed in several defense and security applications to provide apriori information about unknown, unstructured environments with minimal risk to human life [1]. These vehicles instrumented with sensors are capable of avoiding obstacles to navigate in an unknown environment, reporting concerns in different scenarios such as a battlefield [2], civilian security [3], disaster management [4], or in a patrol/surveillance mission [5]. In such missions, a 3D environment map of the surveyed area of interest is useful feedback for organizing future action and deployment of army resources in a much more efficient manner. Our goal with this paper is to present a modular multi-sensor system and processing package that can be mounted on unmanned vehicles/mobility platforms to generate photo-realistic, geometrically accurate geo-referenced 3D models of the area of interest. We demonstrate in this paper that our system is capable of delivering 3D models for three different yet significant defense and security applications: (a) strategic planning and deployment of resources in unknown arbitrary dynamic unstructured environments, (b) simulators for vehicle-environment interaction analysis, (c) automated pavement/runway distress survey in airfields and highways. Using Figure 1, we establish the need for 3D terrain models in defense and security applications and explain with preliminary results from our system on how a multi-sensor integration approach is a potential solution that can feed inputs to each of these applications. We will very briefly describe these applications in the following paragraphs, list the specific requirements in each case, and also present our imaging system as a potential step towards extending the stateof-the-art with unmanned missions. *
Further author information: Email:
[email protected] ; phone: (865) 974-9213; fax: (865) 974-5459 Unmanned Systems Technology VIII, edited by Grant R. Gerhart, Charles M. Shoemaker, Douglas W. Gage, Proc. of SPIE Vol. 6230, 623008, (2006) · 0277-786X/06/$15 · doi: 10.1117/12.666249
Proc. of SPIE Vol. 6230 623008-1
Terrain models in defense and security applications
Simultaneous navigation and mapping
Vehicle-terrain analysis using VPG
Airfield/Highway Pavement distress (Image source: www.faa.gov)
The need
Multi-sensor Integration for Terrain Modeling Results
Models generated using our multi-sensor integration approach
Multi-sensor integrated map of a test area (parking lot) collected using our mobility platform. A zoomed-in view shows parked cars.
Digitized 3D models introduce realism into simulations.
Our models have the high resolution and accuracy for automatic crack detection.
Figure 1: Application of terrain models in defense and security applications. Our system can be easily mounted on unmanned robots such as the Andros in picture (top left) to generate 3D maps of navigated terrain (bottom left). Next, we have shown (center images) the realism that our 3D models can embed into the Virtual Proving Grounds (VPG) as a new cost effective method in contrast to analyzing vehicle-terrain dynamics of army vehicles on real terrain (Image from Aberdeen proving grounds). By using a different high resolution 3D sensing module in our mobile scanning system, we show digitization results on road surfaces (bottom right) that can avoid human error and also aid fast inspection of airfield runways.
(a) Map building for strategic planning: Most unmanned vehicles are already equipped with position and orientation sensors for localization along with vision sensors that are used for obstacle avoidance and navigation. The position and orientation measurements sustain the smooth operation of the vehicle in a constant feedback mechanism in an unknown environment [6]. Though vision cameras can provide spatial information about objects in the scene, map generation from sensory data requires interface between localization sensors and vision sensors. The images/ data collected over a period of time need to be registered into a spatially understandable sense. Reconstructing a map of the surroundings of the vehicle without overloading the localization sensors that are critical in the motion of the vehicle is desirable. Hence, an independent modular system with the processing interface dedicated for mapping can expedite the map building process and also improve mapping accuracy. Based on the level of detail that we desire in the environment, such a system should be modular and flexible in the system design, data collection and processing. Also, the map building process using the unmanned vehicles that are usually operated in stealth mode should be independent of ambient illumination capable of acquiring visual results both during the day and in the night. (b) Simulators and Virtual Proving Grounds (VPG): The U.S Army has constructed several proving grounds scattered all over the country. The idea being that army vehicles (tanks and carrier equipment) can be tested on rough and uncertain terrain before deployment in real world scenarios. The testing is performed by driving assembled and fully equipped vehicles across different types of surfaces such as the Belgian blocks, Perryman surfaces etc. and making measurements for fatigue, damage, wear and tear of different components in the automobile. Such an assessment gives
Proc. of SPIE Vol. 6230 623008-2
an idea of the robustness of the vehicle under test. Also, the vehicle dynamics can be better understood through experimental measurements from surfaces of different material (grass, concrete etc.), road roughness and topography (hilly, plain, and rugged). These test drives also help in analyzing the driver behavior and form the feedback loop towards the improvement of army vehicles and making them suitable for battlefield conditions. Recently, the U.S army concluded that experiments using real vehicles were very expensive and proposed to move towards virtual reality testing using vehicle dynamics models of automobiles and statistical models of road terrain. The VPG for driver/soldier training, soil-tire interaction, vehicle-terrain interaction and component behavior analysis is an effort in that direction [7]. The terrain models for these vehicle-terrain simulators are presently generated using profilometers. The data from the profilometer is statistically modeled and synthetically regenerated for use in simulators. As seen from Figure 1, the models generated from profilometers do not embed the real-world uncertainty into the simulation. Hence, the need for generating 3D models of dynamic environments such as hilly terrain, a speed breaker, a gravel road etc. arises. The requirement imposed by such simulators are that the 3D models be in a commonly used format that is easy to visualize, statistically modeled and suitable for analyzing vehicle dynamics using finite element methods. For generating statistical models of the arbitrary terrain for these simulators, centimeter level accuracy is sufficient. (c) Airfield and Pavement Distress: Traditionally, general aviation airfield pavements are maintained based on the inspection staff’s judgment and experience. The inspection personnel walks or drives slowly through asphalt and concrete pavements observing surface defects and degradation to make recommendations for immediate and long term maintenance. The manual inspection procedure is not only cumbersome, time consuming and expensive but is also susceptible to human error and inefficiency. With safety of aircrafts and passengers in mind, this functional and important process of inspection can be significantly improved using a formalized imaging system that will ease the effort required to inventory airfield conditions through periodic evaluations and subsequent surface distress management without compromising safety. Furthermore, accurate archives of such 3D models of road surfaces over time can be used for statistical wear and tear analysis. A 3D imaging system provides depth information as an improvement over camera-based systems and also removes ambient illumination requirements. The depth information is of particular significance in airfields because the rating scheme for the runway surface [8] is not just dependent on the length and width of the cracks alone as is the case with pavement distress applications but also on the depth. Crack depths in the order of a few millimeters require high precision distance measurements. Hence, the design requirements for a comprehensive airfield data collection system should address accuracy (in the order of a few millimeters) and precision in three dimensions of measurement, speed of acquisition, time required for post processing, ease of visualization and evaluation. Catering to these three applications and the goal of being able to generate 3D models without making any assumptions about the vehicle trajectory, ambient illumination and also considering the uncertainties involved in a dynamic unstructured environment, we address the design challenges in the construction of such a multi-modal integrated imaging system that is capable of real-time data collection. We have begun by listing the specific requirements as our problem statement. In Section 2, we summarize contemporary systems capable of fast digitization of 3D environments. The literature survey emphasizes on the design methods implemented thus far and also serves as a reference study to understand the difficulty in building systems for real-time deployment. We introduce our prototype system and explain the idea behind using multi-modal sensors in Section 3. After the data acquisition, we deal with the integration of multimodal data in Section 4. The integration involves the representation of range and visual data into a spatially meaningful form using the information from position and motion sensors. We show the 3D models generated using our system driving a mobile platform along a test area containing different types of cracks in Section 5 and conclude with recommendations for possible improvements and reproducibility of our system in Section 6.
2. STATE-OF-THE-ART SYSTEMS Our system development and integration is inspired by the computer vision literature on digitization of large scale environments using mobile platforms. In the early attempts towards terrain modeling, large swaths of coarse terrain data were acquired using airborne video systems [9]. Moving away from air-borne systems to easily accessible ground vehicles, an inexpensive approach of recovering 3D structure of buildings and cityscapes from video [10] was demonstrated on cases where the shape could be recovered using stereo principles from successive image frames. Later, Zhao and Shibaski [11] demonstrated that using range sensors and a line CCD as extra data for registration and
Proc. of SPIE Vol. 6230 623008-3
integration to create textured 3D models of urban environments was a faster and efficient approach to urban scene modeling compared to the aerial survey that was the state-of-the art at that time. The MIT City scanning project [12] that inferred structure using spherical nodules was another effort in that direction. Inspired by Zhao and Shibaski, Christian Früh [13] came up with the idea of using two laser range profilers in an orthogonal arrangement along with digital cameras as shown in Figure 5. He demonstrated the system mounted on a truck and driving at normal highway speeds to collect data that was processed offline. With his orthogonal arrangement, he was able to compute centimeter level accuracy by matching successive laser scans against each other and between the two sensors. The horizontal laser scans were used to approximate a component of the acquisition vehicle’s motion. With the vertical scanner providing the façade of the urban structure, he proposed two different approaches in using information from aerial maps to minimize global localization error using laser scans alone. One of those methods was to use a cross correlation and the other a Markov-Monte Carlo technique to acquire 3D models in a matter of few minutes subject to traffic conditions. The two major drawbacks of this approach being the availability of the aerial map and the magnitude of global error that accumulated over just 100m of data. Zhao and Shibaski [14] further improved on Konno et al. [15] who proposed three single-row laser range scanners and six line cameras mounted on a measure vehicle (GeoMaster), with a system equipped with a GPS/INS/Odometer-based navigation system. Their sensor mount outputs three kinds of data sources: laser range points, line images, and navigation data. Either the laser range points or the line images are in the sensor’s local coordinate system at the time of measurement. They are synchronized with the navigation data using the sensor’s local clock and integrated into 3D models offline. The motivation behind these urban scanning projects described so far are more on digitization than accuracy of digitization with expected errors in the order of a few centimeters. Also these methods did not address the uncertainty in the measurement process and the dynamic environment towards map building. However, based on our study of these systems, we note that the multi-sensor approach definitely provides better accuracy and fidelity to the actual environment compared to the other methods. This conclusion also agrees with the related literature in pavement inspection and crack detection. In Table 1, we summarize the high accuracy commercial imaging systems for road surface inspection. We list the systems, their accuracies, processing speeds and the modalities included to better understand how each one of these modalities contribute towards better and efficient terrain mapping. Table 1. Summary of the state-of-the-art commerical systems on road surface mapping.
System/ Group
Modalities used
Resolution of imagery
Special notes
Komatsu
Video, Line scan
4 mega pixel image.
Collects data in the night with argon lights at 10 km/hr.
WiseCrax
Dual video cameras
GPS Van
Stereo and analog camera, GPS , INS
Detects 3mm wide cracks Built for large scale imaging
3D range
< 0.5 mm
National Optics NRC (Canada) AMPIS
Video, GPS
3mm wide,4mm deep cracks 0.3 mega pixels
RoadCrack
Array of CCD
1mm crack width.
3D range
Can collect data at 80 km/hr. Acquires geo-spatial data for urban planning. Novel synchronized laser scanning approach proposed. An array of Biris 3D sensor used. Limited field of view. Can collect 400 km of data in one day at highway speeds.
Based on our survey, we note that current data collection methods still necessitate integration of several heterogeneous technologies. We further identify the scope for improvements in system design targeting the time of acquisition and processing and list the important characteristics of a real-time deployable system. An ideal terrain data collection system must operate in real time gathering and post processing speeds. The duration required for data analysis should not overwhelm the time required for acquisition. A single pass data collection should be sufficient for cost-effective distress identification and localization, the critical aspect being the accuracy and robustness of the system and its extendibility to arbitrary terrain. With all these system requirements in mind we now present our prototype system in the following section.
Proc. of SPIE Vol. 6230 623008-4
3. PROTOTYPE SYSTEM We are looking to digitize terrain surfaces as accurately and quickly as possible with available technology and processing equipment. Our focus is more on the image acquisition system than image processing as we describe the data collection system in this section. We begin with the list of hardware in Table 2 that we have used and share our design ideas. We show the schematic diagram of our system in Figure 2. Table 2. Design specifications of components in our prototype.
Components
System Design Specification
3D sensors: (IVP SC-386)
Depth accuracy ~ 1 mm configured for a baseline of 70cm and stand off 70cm and a triangulation angle of 45 degrees gives 1m width of view at 2000 profiles/sec.
(RIEGL)
Range accuracy ~ 5 cm that can digitize 3m – 300 m far objects at 21 profiles/sec.
(SICK)
Range accuracy ~5 mm and 16 m wide profiles of the scene at 30 profiles/sec.
Video camera (Sony) GPS (Leica)
Placed on a rod for increased field-of-view orthogonal to the road surface and also pre-registered with the range profile. Base station placed in an area with no obstructions with one GPS radio receiver and antenna on the mobile platform (in line with the 3D sensor) to communicate with the base station. Is placed as close as possible to the 3D range sensor camera and measures orientation angles accurate up to a tenth of a degree.
IMU (Xsens)
Video
L__*y
INS N
yaw
3D Z4
pitch
GPS Base
GPS Receiver
roll
Figure 2: Schematic of our data collection system that also shows the different reference frames of each sensor.
Our primary goal is being able to digitize unstructured large terrain and at the same time being able to measure depth of cracks along the road. Therefore, a modular processing approach, independent of the type of the sensors used, appears to be the right approach. We tried to use three different 3D acquisition methods (triangulation-based, time-of-flight and structured lighting) for the data collection. We concluded that the triangulation based system matched our requirements for high speed and high accuracy for detection of cracks. The sheet-of-light triangulation-based sensor that we used (IVP RANGER SC386) is capable of acquiring 2000 profiles/second that corresponds to 6 mm separation between successive profiles driving at 30 miles/hour. In terms of accuracy, our system that was placed 70 cm above the road surface and configured for a baseline of 70 cm and a triangulation angle of 45 degrees gives 1mm accurate depth information. The price that we, however, pay in using such a system is the field-of-view. We are able to scan 0.6 m
Proc. of SPIE Vol. 6230 623008-5
wide section of the road using a single sensor. We recommend using an array of such sensors as a possible solution to large scale data collection. Towards generation of terrain models for the simulators, we used the SICK LMS scanner for acquiring terrain profiles. The time-of-flight principle based SICK scanner senses 3D range information at 30 Hz within an 8 m radial field-of-view with an accuracy of 5mm. We recommend the use of the SICK scanner in applications where time of acquisition and accuracy are not critical. For large scale terrain mapping, we use the RIEGL scanner, which can sense up to a range of 300m with an accuracy of 5 centimeters. These 3D scanners use lasers that operate outside the visible spectrum of light and hence add to the stealth aspect of mapping and also avoiding special illumination required for imaging. Though the 3D information alone is sufficient for crack detection and surface rating, we need spatial information for aligning the 3D profiles. We collect physical location information by setting up a GPS base station and placing a receiver on the mobile platform. The GPS data is accurate up to 4 cm in the motion direction and gives us 10 samples of position information in one second. The GPS can be thought of as sampling the 3D motion of the mobile platform that houses the sensors. In the schematic shown in Figure 2, we have shown a video camera mounted on a rod, whose image axis is orthogonal to the road surface. We prefer the orthogonal field-of-view because it makes the registration of range and intensity profiles trivial and considerably improves integration time without having to consider CCD calibration and rectification of images. The video data in addition to providing visual cues for crack detection also helps in estimating the motion. The pose from video algorithm [16] is particularly useful when the GPS satellite signals are intermittently not available from the satellites during certain time intervals of the day. The system components that we have described thus far are sufficient for scanning terrain when the mobile platform is following a nicely structured smooth pavement. For roads with sufficient distress, varying terrains and embanked pavements, the effect of driving on such terrain and roads with bumps needs to be compensated. The oscillations on the mobile platform caused by the suspension system also have to be considered. We have hence used the IMU for measuring the orientation Euler angles (roll, pitch and yaw) of the sensor mount during data collection. We have used a high performance computer with a Pentium 4 processor that supports hyper threading with 1GB of RAM and with special high speed serial interface cards as the processing equipment. Our acquisition programs are multi-threaded, multi-document graphical user interfaces written in C++ capable of real-time buffer memory management and storage.
4. DATA INTEGRATION Now that we have collected data from multiple sensors, we describe the procedure for integrating the data into one complete single visualizable multi-modal dataset. This task of spatial alignment is not trivial because, each of the measurement systems has their own reference co-ordinate system differently oriented in free space. We introduced this issue in Figure 2 that we further illustrate in Figure 3. Hence as a first step towards integration and fusion of the data, we need to choose a global reference co-ordinate system to represent our data. We have used the GPS co-ordinate frame as our reference frame and transformed the range and intensity profiles to that frame without losing geographic location information of the road surface. Range Profiles Dt = [ x t r , y t r , z t r ]T @ 30 Hz if using the SICK, 21 Hz using the RIEGL, 2000 Hz using the IVP
GPS curve sampled at 10 Hz. Pt = [ x t g , y t g , z t g ]T
IMU data @ 100 Hz
(ω , φ , κ ) Video data @ 30 Hz
Figure 3: Spatial integration of multi-sensor data.
Proc. of SPIE Vol. 6230 623008-6
We need to deal with another important issue before transforming the data to the real-world co-ordinates. We attribute this issue to different acquisition rates from different sensors. The GPS supplies data at a frequency of 10 Hz, video camera at 30 Hz, the IMU at 100 Hz, while the range profiles are acquired at nearly 2000 Hz. We have two choices in resolving this issue. Either to discard the range data and use the profiles that are time synchronized with the GPS data or use all the points of the range data and align the profiles based on interpolated GPS path for various time intervals that we have the range data for. We observed that we lose more information in discarding acquired data by choosing the former solution. We hence suggest cubic spline interpolation of the GPS path as a 3D curve at time stamps recorded by the range sensor. The IMU orientation data also needs to be interpolated. But before that, having characterized our IMU sensor, we applied simple smoothing techniques to reduce the noise in its measurements before interpolation. Towards the spatial alignment of data, if we can denote the Euler angles of roll, pitch and yaw from the IMU by (ω , φ , κ ) and 3D range measurements (xtr, ytr, ztr ) by at a particular time t (note that we have already interpolated all the sensor data to synchronize in time) and let the GPS measurements after considering the distance along each dimension of the range sensor from the GPS receiver be ( xg , y g , z g ) , the mapping to the real-world co-ordinate system Wt of the profile acquired for that instantaneous time t can be made using Equation 1. R t D t + Pt = W t
⎡ cosφ cosκ Rt = ⎢⎢− cosφ sin κ ⎢⎣ sin φ
, where
sin ω sin φ cosκ + cosω sin κ − sin ω sin φ sin κ + cosω cosκ − sin ω cosφ
is the measurement from the 3D range sensor and through GPS measurements. Dt = [ x t r , y t r , z t r ]T
− cosω sin φ cosκ + sin ω sin κ ⎤ cosω sin φ sin κ + sin ω cosκ ⎥⎥ ⎥⎦ cosω cosφ Pt = [ x t g , y t g , z t g ]T
(1)
is the position of the range sensor
The transformation and alignment based on multi-sensor data (collected over a time period) gives us an unorganized point cloud of data that, for visualization purposes, we triangulate using the method described by Hoppe in [17]. We represent the triangulated mesh as a VRML model that can be rendered in most computers that support OpenGL or DirectX. The dense point cloud that we have converted into a mesh can then be textured using the color images from the video. By the design of our setup and initial hardware registration step, we can actually map the color pixels in the CCD to the range profile as a quick method for multi-modal visualization. We summarize the entire integration process as a simple block diagram in Figure 4. Multi-sensor data
Noise reduction and sample interpolation
Spatial alignment (Range, IMU and GPS)
3D meshing and video texture mapping
3D Visualization
Figure 4: Block diagram of the integration pipeline.
5. RESULTS In Figure 5a, we show our system mounted on a push cart along with various other components that we have used. We show an area of interest that we have scanned using our data collection system (Figure 5b) along with the GPS path on a satellite map (Original image from www.maps.google.com) and the multi-modal integrated data in Figure 6. The discontinuity in the GPS path is because we could not get back precisely to the starting point. To draw attention to the resolution at which we have imaged we show some zoomed in images of cracks and rough asphalt surfaces in the same figure. We have color-coded the depth to emphasize the cracks in blue color. The small cracks on the right are about 2cm wide and 2cm deep while the longitudinal crack in the top-left is 3cm wide and 4 cm deep. We have not shown the entire path (75m) at that high resolution considering the size of the data and memory resources required to render the model. However, to highlight the quality of the actual data we show 3D multi-sensor integrated models with the geographic location information as textured datasets in Figure 7 after registration of intensity and range profiles. Figure 7a shows texture details and underlying geometry of an asphalt surface. We underscore the need to integrate both visual and range data with the help of Figure 7b where the geometry leads to a different conclusion about the cracks while texture clearly indicates the presence of grass. The textured 3D data contains the visual information for both 2D and 3D crack detection and classification algorithms. In Figure 7c we show a larger section of the road to emphasize the resolution that our system is able to deliver.
Proc. of SPIE Vol. 6230 623008-7
(a)
H.
(b)
Figure 5: Real-time data collection. (a) Our multi-sensor integrated data collection system on a push cart. (b) GPS path (path length of 75 m) marked on a satellite image.
Figure 6: Multi-sensor integrated 3D data of an area of interest with three small zoomed in sections of areas with different roughness and depth of cracks. The zoomed in sectional views show the color and the color-coded range data side-by-side.
Proc. of SPIE Vol. 6230 623008-8
(a)
(b)
(c) Figure 7: More multi-sensor integrated 3D datasets. (a) A flat terrain asphalt road surface 0.5m in width and 5m of displacement in motion acquired using the IVP system. (b) Textured 3D model of the road surface with patches of green grass. (c) A large scale 4m wide and 20 m long point cloud acquired and integrated using the SICK scanner and rendered at full resolution to emphasize the quality our integrated datasets with large scale models.
6. CONCLUSION AND FUTURE WORK We have laid out the specifications required for a multi-modal integrated 3D imaging system for scanning terrain surfaces as a significant improvement over the state-of-the-art. With the 3D models that we have generated crack detection has become easy with simple threshold-based algorithms giving us fast and accurate results. We have overcome the illumination requirements of the contemporary systems and are able to scan driving at 30 miles/hour at 1 mm depth accuracy on the cracks and 6mm inter-profile distance. With data samples from four sensors supplying data at different rates, we have integrated photo-realistic and accurate 3D models for surface condition archival and convenient visualization.
Proc. of SPIE Vol. 6230 623008-9
The GPS signal availability is a major issue and though we have attempted a solution by trying to estimate motion from video, such algorithms are based on feature matching. We had difficulties in identifying features on smooth planar road surfaces. Through the system design, we have reduced the computations required for the final integration. The postprocessing time visualizing the data was almost equal to the time duration of scanning. Though it is a considerable improvement over the available 3D systems, we attribute it to large amounts of data that need to be processed simultaneously. For a 1m wide dataset that is 45m long driving at 30mph, we are thinking about a few million points at least 60 megabytes of data in its compressed form. Hence, our future efforts will target real-time rendering, visualization and archival of such large datasets.
ACKNOWLEDGEMENTS This work is supported by the University Research Program in Robotics under grant DOE-DE-FG52-2004NA25589 and by the DOD/RDECOM/NAC/ARC Program under grant W56HZV-04-2-0001. The authors would also like to thank Brad Grinstead for helping us with the data collection and his several suggestions towards the system development.
REFERENCES 1. D. Gage, “UGV history 101: A brief history of Unmanned Ground Vehicle (UGV) development efforts,” Unmanned Systems Magazine, 13 (3), pp. 9-16, 1995. 2. M.L. Courtright, “Unmanned Vehicles Go to War,” Machine Design, 63 (25), pp. 60-64, 1991. 3. L.A. Freiburger, W. Smuda, R.E. Karlsen, S. Lakshmanan, and B. Ma, “ODIS the under-vehicle inspection robot: development status update,” in the Proc. of SPIE Unmanned Ground Vehicle Technology V, 5083, pp. 322-335, 2003. 4. R. R. Murphy, “Activities of the rescue robots at the world trade center from 11-21 September 2001,” IEEE Robotics & Automation Magazine, 11(3), 2004. 5. W. N. Klarquist, K.G. Bonner, and B. M. Gothard, “Demo III: reconnaissance, surveillance, and target acquisition (RSTA) preliminary design,” in the Proc. of SPIE Mobile Robots XIII and Intelligent Transportation Systems, 3525, pp. 232-242, 1999. 6. S. Thrun, “175 Miles Through the Desert,” Lecture Notes in Computer Science, 3698, pp. 17, 2005. 7. Y. Zhang, A. Tang, T. Palmer, and C. Hazard, “Virtual Proving Ground - an integrated technology for full vehicle analysis and simulation,” International Journal of Vehicle Design, 21 (4/5), pp. 450-470, 1999. 8. D. Walker, “Asphalt Airfield Pavements, Pavement Surface Evaluation and Rating,” University of Wisconsin, Madison, Transportation Information Center, 2004. 9. C. Baillard and H. Maître, “3-D reconstruction of urban scenes from aerial stereo imagery: A focusing strategy,” Computer Vision and Image Understanding, 76(3), pp. 244-258, 1999. 10. M. Pollefeys, R. Koch, M. Vergauwen, and L. V. Gool, “Automated reconstruction of 3D scenes from sequences of images,” ISPRS Journal of Photogrammetry & Remote Sensing, 55 (4), pp. 251-267, 2000. 11. H. Zhao and R. Shibasaki, “Automated Registration of Ground-based Laser Range Image for Reconstructing Urban 3D Object,” International Archive on Photogrammetry and Remote Sensing, 32 (3-4W2), 1997. 12. M. E Antone and S. Teller, “Automatic recovery of relative camera positions in urban scenes,” Computer Vision and Pattern Recognition, 2, pp. 282-289, 2000. 13. C. Früh and A. Zakhor, “3D Model Generation for Cities Using Aerial Photographs and Ground Level Laser Scans,” in the Proc. of Computer Vision and Pattern Recognition, 2, pp. 31-38 , 2001. 14. H. Zhao and R. Shibasaki, “Reconstructing textured CAD model of urban environment using vehicle-borne laser range scanners and line cameras,” Machine vision and its applications, 14, pp. 35-41, 2003. 15. T. Konno, “A new approach to mobile mapping for automated reconstruction of urban 3D model,” in Proceedings of the International Workshop on Urban Multi-Media/3D Mapping, 2000 (CDROM). 16. B. Grinstead, A.F. Koschan, and M. A. Abidi, “A Comparison of Pose Estimation Techniques: Hardware vs. Video,” in Proc. of SPIE Unmanned Vehicle Technology VII, 5804, pp. 166-173, 2005. 17. H. Hoppe, T. DeRose, T. Duchamp, J. McDonald, and W. Stuetzle, “Surface Reconstruction from Unorganized Points,” Computer Graphics, 26(2), pp. 71-78, 1994.
Proc. of SPIE Vol. 6230 623008-10