2013 Seventh International Conference on Sensing Technology
Multi-Source Information Fusion for Drowsy Driving Detection Based on Wireless Sensor Networks Razali Jidin
Liang Wei
College of Engineering,University Tenaga Nasional (UNITEN), Kajang 43300, Malaysia Email:
[email protected]
School of Computer science and Engineering, Changshu Institute of Technology,Changshu 215500, China Email:
[email protected]
Chia-Pang Chen
S. C. Mukhopadhyay
Department of Electrical Engineering, National Taiwan University, Taipei 106, Taiwan Email:
[email protected]
School of Engineering and Advanced Technology, Massey University, Palmerston North, New Zealand
is expected to be in demand in the future. However, driver fatigue is affected by many factors; so far, research have not found any effective indicators or fatigue level model which could evaluate these factors accurately. Therefore, it is necessary to further study the relationships between drowsiness indicators and driver fatigue level. In addition, the existing driver fatigue monitoring methods are based on single indicator. Under some limited conditions the single indicator can achieve an accurate determination of driver fatigue. However, it is difficult to meet the higher requirement for safety. In order to resolve such problem and to promote accuracy and reliability of fatigue determinant, multi-source information fusion method will be a better development direction.
Abstract—Drowsy
driving is a major cause of road accidents. This paper analyses the drivers’ behavior in the state of fatigue driving and introduces the latest developments of drowsy driving detection technology. In this study we also propose a drowsy driving detection based on the driver’s physiological signals such as eye activity measures, the inclination of the driver’s head, sagging posture, heart beat rate, skin electric potential, and electroencephalographic (EEG) activities, as well as response characteristics, decline in gripping force on the steering wheel and lane keeping characteristics. By developing a hierarchical model that is able to collect the sensing data, analyze the driving behavior and the reactions to the driver, it can provide a safe and a comfortable driving environment. Combining different indications of drowsiness and processing the contextual information to predict whether a driver is drowsy, the system not only issues a warning for the driver, but also provides the drowsy driving information to transportation control center and other vehicles if necessary.
II.
Several studies have proposed a range of methods to detect drowsiness and distractibility. Some of the research results have been applied in commercial products and have started to appear in the market. For example, a study[1] had developed a pilot drowsy driving detection system in the car to capture the images of driver's face by a camera and to collect the driver photoplethysmograph by a bio-signal sensor installed on the steering wheel. The system was developed using Android-based Smartphone to receive sensory data from a video sensor and a bio-signal sensor. Then it further processed the data to evaluate the fatigue state of the driver. Another study in [2] had developed a driver fatigue behavior detection system to detect the drowsiness of drivers. A five-layer sensing architecture was proposed to collect driving information to reflect the state of a driver in real time. The studies in [3], [4] and [5] developed a monitoring system to detect if drowsy driving state occured. The proposed system was consisted of a physiological signal-acquisition module to monitor longterm EEG and an embedded signal-processing module to detect real-time drowsiness. The research in [6], [7] and [8] had developed devices to recognize driving maneuvers and driver distraction. The proposed device adopted video recordings, GPS latitude and longitude for driving maneuver recognition to build driver behavior models. On the other hand, study [9] proposed WSN-based traffic monitoring sensors to be deployed along the road to improve quality
Keywords- wireless sensor networks; drowsy driving; driver behaviour
I.
INTRODUCTION
Drowsy driving is a main reason for many serious traffic accidents. When drivers are fatigued, their perception for the surrounding environment, their ability to judge the situation, and their ability to control the vehicle will decline in some different degrees, which resulting in accidents. If we could monitor the drivers in real time and determine if drowsy driving occurs, we could avoid many traffic accidents. Research regarding driver fatigue is very important because of its important application on the prevention of traffic accidents. Research on automotive safety technology
This work was supported by National Natural Science Foundation of China (No. 61202440).
978-1-4673-5221-5/13/$31.00 ©2013 IEEE
RELATED WORK
861
2013 Seventh International Conference on Sensing Technology
then through a signal processing unit. In the signal processing unit, the pre-processed EEG signal will be analyzed by a drowsiness detection algorithm. The result will determine whether drowsy driving has occurred.
and safety of car mobility to enhance reliability and accuracy of short-term traffic state prediction. The study in [10] presented a context-aware smart car built by a hierarchical architecture to collect and evaluate contextual information about the driver, the vehicle and the driving environment. A software platform was then built for the context model and its applications. However, this system was used to alert the driver and it did not relay warning messages to the transportation control center at the roadside or to other vehicles. The study in [11] developed a drowsy driver detection device to measure the degree of drowsiness of driver by measuring the point of time breathing changes from conscious, such as in pursed-lip breathing, to unconscious, when the driver became drowsy. Research in [12-15] had developed a system to detect driver fatigue state by a video camera and issued a timely alarm to alert the driver. III.
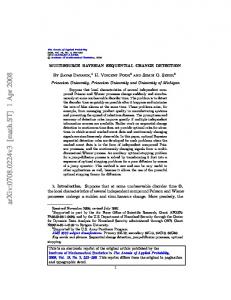
2) On the other hand, ECG is mainly used in the driving load of physiological measurements. Studies [19] and [20] show that ECG will obviously decrease when a driver is fatigued, and the changes of HR (heart rate) do have a potential relationship to the degree of drowsiness of the driver. Heart rate can be measured by the electrocardiogram (ECG) [15]. A typical ECG signal is shown in Fig 1. There are interval peaks among wave, which are called “R-wave”, the distance between two R waves is called "R-R interval". Heart rate is exactly a reciprocal of the "R-R interval". In order to measure a driver's R-R interval, at least two electrodes need to be attached to the body of the driver. The easiest way is to mount two electrodes on the steering wheel. However, the drivers do not always hold the steering wheel with both hands, especially when the driver is in fatigue. Another way is to take the ECG measurements by capacitive coupling the electrodes on the driver's seat or on the back of the seat. These methods are no longer dependent on the electrodes on the wheel; instead, they are sensing the driver's body motion.
OVERVIEW OF DRIVER’S FATIGUE BEHAVIOUR
The detection methods for drowsy driving can be defined in four categories described as follows. A. Drowsiness Detection Based on Driver’s Physiological Signals. The study on drowsiness began with physiology, where the driver’s physiological indicator of drowsiness strays from the normal state. According to relative study, driver fatigue can be determined by the driver's physiological indicators. Today, well-developed methods on driver fatigue detection could measure the EEG, ECG (Electrocardiography), etc.
Fig. 2 A typical ECG signal and R-R Interval
There is a high accuracy of fatigue detection based on physiological signal to determine driver fatigue. However, it requires physiological signal measurement which needs a direct contact with the object. The application of driver fatigue monitoring based on physiological signal also has many constraints. Thus, it remains in an experimental stage.
Fig. 1 EEG headband embedded with signal-acquisition module
B. Drowsiness Detection Based on the Driver's Physiological Response Characteristics Drowsiness detection based on driver's physiological response characteristics determines driver fatigue according to the dynamic characteristics of the movement of driver's eyes and head. Through analyzing a series of drivers’ face images, some symptoms can be detected, such as head nodding, yawning, prolonged eyes closing, which are related to drowsiness. After the drivers recognize these signs, they can take precautionary measures to avoid accidents. 1) The movement and blink information of a driver’s eyes is considered in order to reflect important features of fatigue. Blink amplitude, frequency of blinking and the average closure time of a driver’s eyes can be used directly for the detection of fatigue. Nowadays, there are many research studies on algorithms, which are based on eye movement characteristics of fatigue driving. The widely
1) Researchers found that EEG is a direct reflection of brain activities. Entering the state of fatigue, delta wave and theta wave activities in EEG will grow substantially while there will be only a slight increase of alpha wave activity. Some studies [3], [16] and [17] on monitoring EEG signals indicated that the EEG used for monitoring driver fatigue is an effective indication. Researchers also found that EEG signal characteristics have great individual differences, depending on gender, personality, psychological and human activities. A typical EEG-based Drowsy driving detection system is consisted of a physiological signal acquisition unit and a signal processing unit [18]. EEG signal data are collected through the EEG electrode as shown in Fig. 1; they are then amplified and filtered by an EEG amplifier in a physiological signal acquisition unit. After that, EEG signals will be pre-processed through a microprocessor unit,
978-1-4673-5221-5/13/$31.00 ©2013 IEEE
862
2013 Seventh International Conference on Sensing Technology
acceleration rate of vehicles can be provided from the GPS and the vehicle speedometer. In front of the vehicle, a laser distance sensor is installed to measure the distance between the two vehicles. However in the drowsy driving detection system laser distance sensor is only used as data analysis reference, attached to pedal pressure sensors. The system measures parameters, including acceleration, deceleration, and pressure level on accelerate pedals, pressure on brake pedals and the speed.
applied algorithms include PERCLOS [3], [21] and [22], a percentage of eyelid closure within a certain time frame is used as a measurement of physical fatigue. The measurement of the time of eyes blinking and the time of eyes remaining closed is one of the most commonly used methods, called PERCLOS (Percentage of Eyelid Closure), to identify driver fatigue. We can determine whether a driver's attention is compromised by examining his eyes, nose and mouth position together with facial recognition and eye tracking techniques. The identification of curvature of the upper eyelid curve is an alternative method to detect drowsiness. If the geometric curvature is convex the eyebrow is aside, the eye is regarded as opened; if the curvature is concave, the eye is regarded as closed. Another approach is to analyze the white of the eye sclera; sclera white area becomes greater with greater eye opening. 2) Moreover, study [23] has found that there is a very close correlation between nodding movements and drowsiness. Corresponding to this approach of PERCLOS (Percentage of Eyelid Closure) to identify fatigue driving, nodding monitoring and ECG measurement and fatigue are highly correlated. The head nodding motion of the driver is detected by the position sensors. Based on the variation of head position, we can determine whether the driver is drowsy. In general, drowsiness detection, which is based on the driver's physiological response characteristics, is characterized by the use of non-contact measurement. It is a better driver fatigue recognition method, in terms of detection accuracy and practicality. Although the use of head nodding for drowsy driving detection level is at a lower level, as nodding is affected by other areas of the body movement which is not related to drowsiness, it is a good additional measurement of the deepening of fatigue and sleepiness, since nodding will also increase more frequently.
A driver's operating behavior is relative not only to fatigue state, but also to personal habits, vehicle’s speed, road conditions, operating skills, state of the vehicle, as well as vehicle features, roads, and many other environmental factors. Therefore, the key issue is how to improve precision of the driver’s operating behavior measurement through indirect measurement technology. D. Drowsiness Detection Based on Vehicles Lane Tracking and Lane Deviation Information Vehicle lane tracking and lane deviation information can also be used for drowsiness detection. The method is similar to drowsiness detection based on driver's operating behavior. It is a very practical method and is easy to install, as it can be used without using many devices or any interference methods on the driver's driving behavior. In the lane keeping detection method [26], [27] and [28], the camera is fixed on the vehicles, pointing towards the road ahead. The camera monitors the lane tracking according to certain image processing algorithms to determine whether a driver is distracted or drowsy. The lane detection and tracking algorithms are carried out, including fitting of composite curves to curved lanes. In this system, vision-based lane crossing calculators and lane keeping detection system detect the lane boundaries. Even though the lanes are parallel, the marking sizes of the lane are irregular and the lanes slope around the vehicles are not constant. Therefore, by using the warp perspective mapping, the original image with perspective view is rectified in order to solve this problem.
C. Drowsiness Detection Based on the Driver's Operating Behavior Drowsiness detection based on driver's operating behavior determines driver fatigue according to the operational behavior of driver operations, such as steering wheel. Research of data processing on driver's steering operation reveals a certain relationship between driver's steering operation and driver fatigue.
The intelligent concept car uses some driver aid features, such as lane keeping, intersection collision avoidance, and pedestrian detection. Vision-based lane keeping detection involves both lane tracking and obstacle on road detection at the same time. Lane keeping detection is based on a pattern matching technique, while obstacle detection is deduced by determining the free-space in front of the vehicle, using stereo image pairs without 3D reconstruction.
Research literature indicates that steering wheel operation is a valid method on driver fatigue determination. Overall, there are fewer studies [24] and [25] of fatigue behavior detection using information of driver’s operating behavior.
1) The most common drowsy driving detection system, based on lane tracking, is optical sensors that are ordinary cameras. They are often called “passive sensors” since they collect data in a non-invasive way. One advantage of the passive sensors is that it is less expensive than active sensors. We can also install both forward facing camera and backward facing camera on a vehicle, in order to enable an almost 360 degree field of view. Optical sensors can be effectively applied to lane tracking or tracking the movement of the vehicle relative to the road. The system also need no modification of road infrastructure,
Drivers’ pedaling operation mode changes with the deepening level of fatigue driving. The Drowsiness Detection system based on the Driver's Operating Behavior needs to establish the driver's normal driving rule set and the non-normal driving rule set in advance. By comparing the driver's response pattern with corresponding rule set, their level of fatigue can be deduced. Pressure sensors are installed on the pedal in this detection system in order to monitor the drivers’ control on vehicle speed. The
978-1-4673-5221-5/13/$31.00 ©2013 IEEE
863
2013 Seventh International Conference on Sensing Technology
or snow, road or travel conditions, such as slope or sharp bend, as well as road traffic density.
visual information associated with a lot of applications, such as vehicle detection, traffic signal recognition, object identification, or pedestrians and obstacles.
Each vehicle or sensor node collectively contributes to the gathering of information at different times toward realizing the central repository database systems that will in turn be employed to support in decision making processes to determine the state of drowsiness of a driver or safe driving patterns.
2) The most common active sensors, such as the radar-based, laser-based, and acoustic-based, are also used on lane tracking. When the radar transmits radio waves into the air, a small part of the power is reflected back to the radar receiver. Light Detection and Ranging, which is Lidar, can also transmit and receive electromagnetic waves at a higher frequency of electromagnetic waves than radar. Lidar works in the electromagnetic spectrum of ultraviolet range, visible and infrared region. These sensors are called “active” because they measure the distance of the objects by measuring the time difference between signals transmitted from sensors and reflected signal from the objects. Radarbased systems are able to see at least 150 meters ahead, in fog or rain, while average drivers can only see less than 10 meters ahead. Lidar is less expensive than radar and easy to install as well. However, lidar operates worse than radar in rain and snow conditions. Laser-based systems are more accurate than radar, but their application are restricted due to its relatively high usage cost. Vehicles equipped with active sensors are used with satisfactory results. However, when a large number of vehicles move in the same direction, interference among the same type of the sensors is a major problem. IV.
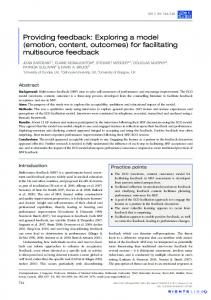
A simple vehicle sensor network can consist of multiple moving vehicles and a fixed roadside infrastructure component as shown in Fig. 3. In addition to onboard sensors, a vehicle should have multiple wireless communication channels to exchange data with other fellow vehicles that can function as communication hops for data in transit to a fixed infrastructure. When two vehicles are within a wireless communication range, they will start to establish a communication link for data exchange. A fixed wireless communication infrastructure node deployed on the road-side will act in the same way. It communicates with a vehicle when a vehicle passes near it. The roadside infrastructure can also act as a router for Internet to serve a group of vehicles that not only provide broadband services but other emergency facilities as well, if needed. Within a single vehicle node, a controller is needed to process the multiple acquired data to decide locally when the communication channel fails or overloaded.
WIRELESS VEHICLE SENSOR NETWORKS
Data acquired from the ambient and state of vehicle sensors can be employed as “baseline setting” for establishing different safe driving patterns within a section of a road or influence a confidence factor in determining drowsiness states. As an example, in a scenario of driving a car at early morning, like four o’clock, and passes a straight stretch of a remote road will influence the confidence index in determining the drowsiness state of the a driver when the sensors within the car dashboard detect such condition. Multiple different types of sensors such as visual, audio and others can provide more accurate diagnosis. The visual sensors can monitor a driver’s eyes, head nodding as well as lane compliant, while other sensors measure steering grip and gas pedal push. Upon the diagnosis, the next steps can include alarms annunciation, or lowering of the car speed and altering of the steering wheel. Data collected from the multiple of sensors has to be properly tagged, and supported with wireless protocols that can reduce data traffic congestion. Gathered data can be stored first, or instantaneously forwarded to roadside traffic management centers, en-route to remote servers to be processed and collated in a variety of different structures including macroscopic-level knowledge-bases. To reduce data overloading, the approach is to preload the knowledgebases into the vehicle for the local vehicle node to decide when a driver is starting to enter his drowsiness state.
Fig. 3 A vehicle sensor network consist of moving vehicles and fixed roadside infrastructure components
Multiple sensor devices installed inside a car provides key information on the car itself and state of its driver while it is moving. A vehicle with this kind of capabilities represent a node that wirelessly communicates with other nodes forms a vehicle sensor network. The onboard sensors of a vehicle node collects information that can be grouped into two types. The first type of information gathers the state of a driver and the driven vehicle, such as the car's position and speed. The second type of information gathers the ambient outside the vehicle that can include darkness, rain
978-1-4673-5221-5/13/$31.00 ©2013 IEEE
Driver fatigue driving information can also be used for traffic analysis, traffic management and road safety application. With the availability of economical sensors and wireless sensor networks, technologies like fusion of data and other can help in determining the driver’s drowsiness and dangerous road conditions.
864
2013 Seventh International Conference on Sensing Technology
V.
light, motion, temperature, humidity, and so on. They share sensed data by wireless communication with each other. Part of their function is to convert data to be processed by the reasoning part of the table.
DROWSY DRIVING DETECTION SYSTEM ARCHITECTURE
This paper attempts to present an overall structure of drowsy driving prevention, based on multi-sensor information system with integrated warning indicators. In this structure, the WSN drowsiness driving detecting system collects the driver status data and the driving state data of a vehicle deviating from normal. The system will issue a warning, like wake-up sound when a driver is drowsy, and at same time the system sends a message to the road traffic management centers to alert other nearby vehicles to take precautions, or alerting the drowsy drivers.
B. Reasoning stage: The function of this stage is to use reasoning techniques to deal with environmental data to extract useful environmental information for the user. This stage is responsible for determining the state of the driver, and to determine the next operation. There are two types of environmental information: one is directly related to reasoning for drowsy state, such as eyes closed, EEG, ECG, etc; the other is not directly related to sleep, but it could affect drowsiness recognition. For example, the weather condition could affect lane keeping detection, environmental information collected from temperature sensor, and humid sensor. In the reasoning stage, the behavior detection algorithm reasons on the driver’s behavior through converging multi-source information to deduce the state of the driver. C. Application stage: This stage acts as a subsystem, and is responsible for disseminating warning messages, which includes early warning messages for other vehicles on the road. An invehicle alarm device is installed to prevent the occurrence of accidents and to reduce potential traffic fatalities. Fig. 5 shows the mechanism of a driver drowsiness detecting system which also provides the driver’s status information to other vehicles on the roads. The sensors surround the vehicle and the road senses the driver's status information and road environment information, including the physical and logical information, such as speed, acceleration, real-time traffic information, video and GPS information.
Fig. 4 Drowsy driving detection system architecture
The drowsy driving detection system is consists of the following three stages, as shown in Fig. 4: A. Sensing stage: The main function of this stage is to collect environmental information through the sensors. That is, to collect data on drivers, vehicles and the environment, then forward these data to the next data processing stage. The sensing stage, which is consisted of a variety of different integrated sensors, is responsible for collecting relevant data. The suggested sensing sensors are consisted of two main parts: internal data source and external data source. The internal data source sensors include driver cameras, lane tracking cameras, brake sensors, gas pedal sensors, steering wheel sensors, speed sensors, distance sensors, GPS and so on. The external data source sensors are mounted inpavement in the middle of the traffic lane or at the roadside. These sensors include magnetic field, video, acoustic waves,
978-1-4673-5221-5/13/$31.00 ©2013 IEEE
Fig. 5 Drowsy driving detection system mechanism
Fig. 5 shows the mechanism of drowsy driving detection system process. Information will be collected and be transformed into a format that can be processed by the
865
2013 Seventh International Conference on Sensing Technology
processor. As shown in the diagram, the input data from various sensors will go through the smoothing preprocess.
This proposed Drowsy Driving Detection System is based on Texas Instruments (TI) MSP430F149 microcontroller. With Image Processing by TMS320C6000 ™ DSP, wireless signal transmitting and receiving by RF CC1101, many correlative sensors are integrated in order to achieve a Drowsy Driving Detection System.
After collecting multiplexing channel data from a variety of sensors to be preprocessed, they reason and calculate the state of the driver by a variety of attribute inference algorithms. The relative algorithms include Multi-Criteria Decision Analysis Method, Decision Tree Classification Algorithm, Market Basket Analysis, and so on. TOPSIS is a popular algorithm in Multi-Criteria Decision Analysis Method. TOPSIS is based on the concept that the chosen alternative should have the shortest geometric distance from the positive ideal solution and the longest geometric distance from the negative ideal solution. Decision Trees are also tools used to choose multi-source data collected from a variety of sensors. They provide a highly effective structure which displays the selection of data and the investigation of possible outcomes of choosing those selections. Market basket analysis can be used in deciding the options of multisource information.
The Texas Instruments MSP430 family of ultralowpower microcontrollers is consisted of several devices, featuring different sets of peripheral targeted for various applications. The architecture, combined with extensive low-power modes, is optimized to achieve extended battery life in portable measurement applications. The device features a powerful 16-bit RISC CPU, 16-bit registers, and constant generators that contribute to maximum code efficiency. The digitally controlled oscillator (DCO) allows wake-up from low-power modes to active mode in 3.5 µs (typical) [29]. The MSP430F5 chip family of Texas Instruments is of l6-bit mixed-signal microcontrollers set which have ultra-low-power features and in the 1.8V-3.6V operating voltage range, where the MSP430F5519 processor can perform as high as 25MIPS. As shown in Fig 6, this paper suggests a design using multi-channel signal detection system by MSP430F5519 microcontroller.
The reasoning stage judges whether the driver is at the drowsy driving state. As mentioned, the initial threshold values cannot satisfy all kinds of driver since individual driver has his/her own driving habit. Therefore, the initial threshold values need to be tuned and updated according to the driver’s habits.
The design of this wireless sensor networks is consisted of two kinds of node. One is roadside sensor node; the other is in vehicle sensor node. The former provides in-vehicle sensing data for Drowsy Driving Detection System of Multi-Source Information Fusion; the latter provides sensory data outside the car for Drowsy Driving Detection System of Multi-Source Information Fusion.
If the result of inference is a normal driving state, which satisfies normal driving conditions, the system will not take action and the sensor networks will acquire new information. If the result of inference is a drowsy driver state, the processor will take a warning action. The processor will then send a signal to the application unit 1 to alert the driver. The processor will also send a signal to the application unit 2 in order to send the drowsy driving information to the traffic control center. A signal also can be sent to application unit 3 to alert other neighboring vehicles on the road. VI. HARDWARE DETECTION SYSTEM
DESIGN
OF
DROWSY
For in-vehicle sensor nodes, they are powered by in-car battery. Internal data sources which provide for MSP430 reasoning operations are divided into three kinds: 1) image sensing data; 2) other sensing data from in-vehicle sensor; and 3) data come from the wireless communication module which receive data from roadside traffic management centers and roadside nodes. Sensing image data need to be processed by TMS320C6000™ DSP before they are sent to MSP430 processor for operations involving reasoning. The TMS320C6000™device is based on high-performance advanced VelociTI very-long-instruction-word (VLIW) architecture developed by Texas Instruments (TI), making this DSP an excellent choice for multichannel and multifunction applications [30]. Image sensing data of invehicle sensor nodes come from two cameras: one camera detects the driver's eye, the other is a lane tracking camera. TMS320C6000™ DSP is responsible for Real-time processing image recognition. Other data sensing in-vehicle are connected to the senor bridge. These sensors include brake sensors, gas pedal sensors, steering wheel sensors, speed sensors, distance sensor, and so on.
DRIVING
RF CC1101 module can transmit and receive information from traffic management centers and around other vehicles within a distance of about 350 m. The CC1101 circuit is mainly intended for ISM (Industrial, Scientific and Medical) and SRD (Short Range Device) frequency bands at 315, 433, 868 and 915 MHz, but they
Fig 6 In-vehicle node hardware architecture
978-1-4673-5221-5/13/$31.00 ©2013 IEEE
866
2013 Seventh International Conference on Sensing Technology
the driver fatigue level, as well as analyzes and compares the current common drowsy driving detection technology. With regards to the problem of low accuracy and reliability of an existing driver fatigue monitoring method, based on a single indicator, this paper proposes a multi-source information fusion method, based on wireless sensor network; a wireless sensor network hardware platform for multi-source information fusion with detailed analysis and design.
can easily be programmed for operation at other frequencies in the 300-348 MHz, 387-464 MHz and 779-928 MHz bands [31]. Information of these sensors includes the results of image recognition and other factors of receiving from RF module converge to MSP430 module. This module will do a calculation to determine whether the driver is sleepy based on the Multi-Source Information Fusion algorithm. If the result of inference is a drowsy driver state, the processor will send a warning signal to alert the driver. The processor will also notify the other surrounding vehicles and roadside traffic management center through the RF module. Meanwhile, the RF module can receive a signal on whether the surrounding drivers are drowsy.
ACKNOWLEDGMENT This work is supported by Changshu Institute of Technology(China) and Massey University(New Zealand). I like to thank my supervisor Prof. Subhas Chandra Mukhopadhyay and other researchers in the School of Engineering and Advanced Technology for their feedback and suggestions.
REFERENCES [1]
B.-G. Lee and W.-Y. Chung, “Driver Alertness Monitoring Using Fusion of Facial Features and Bio-Signals,” IEEE Sensors Journal, vol. 12, no. 7, pp. 2416–2422, Jul. 2012. [2] S. Al-Sultan, A. Al-Bayatti, and H. Zedan, “Context Aware Driver Behaviour Detection System in Intelligent Transportation Systems (ITS).,” IEEE Transactions on Vehicular Technology, no. c, pp. 1–1, 2013. [3] Chin-Teng Lin, Che-Jui Chang, Bor-Shyh Lin, Shao-Hang Hung, Chih-Feng Chao, and I-Jan Wang, “A real-time wireless braincomputer interface system for drowsiness detection.,” IEEE transactions on biomedical circuits and systems, vol. 4, no. 4, pp. 214–22, Aug. 2010. [4] C. Lin, Y. Chen, R. Wu, S. Liang, and T. Huang, “Assessment of Driver’s Driving Performance and Alertness Using EEG-based Fuzzy Neural Networks,” 2005 IEEE International Symposium on Circuits and Systems, pp. 152–155, 2005. [5] D. Kim, H. Han, S. Cho, and U. Chong, “Detection of Drowsiness with eyes open using EEG- Based Power Spectrum Analysis,” 2012 7th International Forum on Strategic Technology (IFOST), Tomsk, pp. 3–6, 2013. [6] A. Sathyanarayana, S. O. Sadjadi, and J. H. L. Hansen, “Leveraging sensor information from portable devices towards automatic driving maneuver recognition,” 2012 15th International IEEE Conference on Intelligent Transportation Systems, pp. 660–665, Sep. 2012. [7] L. Tijerina, T. Pilutti, J. F. Coughlin, and E. Feron, “Detection of Driver Fatigue Caused by Sleep Deprivation,” IEEE Transactions on Systems, Man, and Cybernetics - Part A: Systems and Humans, vol. 39, no. 4, pp. 694–705, Jul. 2009. [8] W.-C. Cheng and C.-C. Chiang, “The development of the automatic lane following navigation system for the intelligent robotic wheelchair,” 2011 IEEE International Conference on Fuzzy Systems (FUZZ-IEEE 2011), pp. 1946–1952, Jun. 2011. [9] A. Pascale, M. Nicoli, F. Deflorio, B. Dalla Chiara, and U. Spagnolini, “Wireless sensor networks for traffic management and road safety,” IET Intelligent Transport Systems, vol. 6, no. 1, p. 67, 2012. [10] J. Sun, Y. Zhang, and K. He, “Providing Context-awareness in the Smart Car Environment,” 2010 10th IEEE International Conference on Computer and Information Technology, no. Cit, pp. 13–19, Jun. 2010. [11] D. Sandberg and M. Wahde, “Particle swarm optimization of feedforward neural networks,” IEEE International Joint Conference on Neural Networks, pp. 788–793, 2008.
Fig. 7 Roadside node hardware architecture
For roadside sensor nodes shown in Fig. 7, they are powered by solar panels near the roadside. Data are collected from roadside cameras, other sensory data and information from other nodes in the roadside or traffic management center. The roadside sensor nodes provide relevant information to the in-vehicle nodes. Those are the important factors to determine whether the vehicle is at drowsy driving state. The roadside cameras monitor road traffic images, which are processed through the DSP TMS320C6000, in order to identify whether vehicles have deviated from the lane. Other sensors at the lane or roadside are connected to Sensor Bridge. These sensors include audio sensors, magnetometers sensors, speed sensors, distance sensor, temperature sensor, humid sensor, and so on. After the information and the collected data have been processed through the processor, they will be transmitted to the passing vehicles and the road management center through the RF module. CONCLUSION Wireless sensor networks application is an important application for automotive safety technology in the monitoring of drowsy driving, in order to prevent traffic accidents caused by driver fatigue. Although there are many characteristics of drowsy driving, no effective indicator or fatigue level model could be accurately evaluated. This paper summarizes the relationship of various indicators and
978-1-4673-5221-5/13/$31.00 ©2013 IEEE
867
2013 Seventh International Conference on Sensing Technology
[12] H. Singh, J. S. Bhatia, and J. Kaur, “Eye tracking based driver fatigue monitoring and warning system,” India International Conference on Power Electronics 2010 (IICPE2010), pp. 1–6, Jan. 2011. [13] J. Sil and T. Srikanthan, “A hybrid approach to designing an autonomous driving alert system using geometrical features and gray level information of face images,” Annual Technical Conference IEEE Region 5, 2003, pp. 33–38. [14] T. Hong, H. Qin, and Q. Sun, “An Improved Real Time Eye State Identification System in Driver Drowsiness Detection,” IEEE International Conference on Control and Automation, pp. 1449– 1453, 2007. [15] Y. Kondo, K. Sasaki, Y. Nakano, S. Sano, and H. Tomimori, “Reduction of baseline fluctuation in Electrocardiogram measurement for a car driver,” TENCON 2010 - 2010 IEEE Region 10 Conference, pp. 1738–1741, Nov. 2010. [16] A. Picot, S. Charbonnier, and A. Caplier, “On-Line Detection of Drowsiness Using Brain and Visual Information,” IEEE Transactions on Systems, Man, and Cybernetics - Part A: Systems and Humans, vol. 42, no. 3, pp. 764–775, May 2012. [17] F.-C. Lin, L.-W. Ko, C.-H. Chuang, T.-P. Su, and C.-T. Lin, “Generalized EEG-Based Drowsiness Prediction System by Using a Self-Organizing Neural Fuzzy System,” IEEE Transactions on Circuits and Systems I: Regular Papers, vol. 59, no. 9, pp. 2044– 2055, Sep. 2012. [18] E. Michail, A. Kokonozi, I. Chouvarda, and N. Maglaveras, “EEG and HRV markers of sleepiness and loss of control during car driving.,” Conference proceedings : ... Annual International Conference of the IEEE Engineering in Medicine and Biology Society. IEEE Engineering in Medicine and Biology Society. Conference, vol. 2008, pp. 2566–9, Jan. 2008. [19] V. P. Nambiar, M. Khalil-Hani, C. W. Sia, and M. N. Marsono, “Evolvable Block-based Neural Networks for classification of driver drowsiness based on heart rate variability,” 2012 IEEE International Conference on Circuits and Systems (ICCAS), pp. 156–161, Oct. 2012. [20] G. D. Furman, A. Baharav, C. Cahan, S. Akselrod, T. Aviv, and S. Zedek, “Early Detection of Falling Asleep at the Wheel: A Heart Rate Variability Approach Methods,” Computers in Cardiology, pp. 1109– 1112, 2008. [21] I. G. Daza, N. Hernandez, L. M. Bergasa, I. Parra, J. J. Yebes, M. Gavilan, R. Quintero, D. F. Llorca, and M. a. Sotelo, “Drowsiness
978-1-4673-5221-5/13/$31.00 ©2013 IEEE
[22]
[23]
[24]
[25]
[26]
[27]
[28]
[29] [30]
[31]
868
monitoring based on driver and driving data fusion,” 2011 14th International IEEE Conference on Intelligent Transportation Systems (ITSC), pp. 1199–1204, Oct. 2011. D. Sommer and M. Golz, “Evaluation of PERCLOS based current fatigue monitoring technologies.,” Conference proceedings : ... Annual International Conference of the IEEE Engineering in Medicine and Biology Society. IEEE Engineering in Medicine and Biology Society. Conference, vol. 2010, pp. 4456–9, Jan. 2010. R. O. Mbouna, S. G. Kong, S. Member, and M. Chun, “Visual Analysis of Eye State and Head Pose for Driver Alertness Monitoring,” IEEE Transactions on Intelligent Transportation Systems, Issue: 99 , pp. 1–8, 2013. X. Gao, G. Dong, and L. Gao, “Comparison on driving behavior between manned and unmanned ground vehicles,” 2011 2nd International Conference on Intelligent Control and Information Processing, pp. 522–526, Jul. 2011. X. Hu, R. Eberhart, and B. Foresman, “Modeling drowsy driving behaviors,” Proceedings of 2010 IEEE International Conference on Vehicular Electronics and Safety, pp. 13–17, Jul. 2010. Z. Sun, G. Bebis, and R. Miller, “On-road vehicle detection: a review.,” IEEE transactions on pattern analysis and machine intelligence, vol. 28, no. 5, pp. 694–711, May 2006. K. Zhao, M. Meuter, C. Nunn, D. Müller, S. Müller-schneiders, and J. Pauli, “A Novel Multi-lane Detection and Tracking System,” IEEE Conference on Intelligent Vehicles Symposium (IV) , pp. 1084–1089, 2012. A. Control and I. Technical, “Vision Based Lane Keeping Assistance Control Triggered by a Driver Inattention Monitor,” IEEE International Conference on Systems Man and Cybernetics (SMC), 2010 , pp. 289–297. 2010 Texas Instruments , “MSP430F5519 Device Erratasheet” 2013 [Online]. Available: http://www.ti.com/product/msp430f5519 Texas Instruments, “TMS320C6000 DSP/BIOS 5.x Application Programming Interface (API) Reference Guide” 2013 [Online].Available: http://www.ti.com/lit/ug/spru403s/spru403s.pdf Texas Instruments, “MSP430F5519 Device Erratasheet” 2013 [Online]. Available: http://www.ti.com/lit/ds/swrs061h/swrs061h.pdf