we generated a surface which generalizes the usual signature by adding a time dimension. ... ONLINE STAGE: MULTI-TEMPORAL IMAGES UNMIXING AND ...
PIERS ONLINE, VOL. 6, NO. 5, 2010
480
Multi-temporal Hyperspectral Images Unmixing and Classification Based on 3D Signature Model and Matching I. R. Farah1, 2 , S. Hmissi1, 2 , K. Saheb Ettabaa1, 2 , and B. Souleiman2 1
2
RIADI-GDL, ENSI, Tunis, Tunisia T´el´ecom Bretagne, D´ep. ITI, Technopˆole Brest-Iroise-CS 83818, 29238 BREST CEDEX 3, France
Abstract— Land cover and land use types are challenged to access real-time and precise information of interest. The recent advent of sophisticated sensors permits to exploit independent observations of a phenomenon and to extract more detailed information and performs a decision level for scene interpretation. In this paper, we propose a new approach for multi-temporal hyperspectral images processing based on multi-temporal spectral signature representation. The 3D model characterizes all the pixels in a scene by considering their reflectance values as a function of time of imaging and spectral waveband. We showed the use of such modeling strategies in overcoming the dimensionality problem and improving both multi-temporal classification and unmixing problems associated with hyperspectral data. A case study was conducted on multi-temporal Hyperion series located in southern Tunisia. The obtained results showed good accuracies. 1. INTRODUCTION
Land cover and land use types are challenged to access real-time and precise information of interest. Remote sensing has been used to observe, to model and to provide input data by aerial measurements for many applications, including flood monitoring, surface deformation and land cover variations [1]. Nowadays, processing remote sensing data, as a forecasting tool for land surface study, allows a real time object detection or a-posteriori evaluation of damaged areas, on a case-to-case basis by providing thematic products. However, traditional products (e.g., aerial photographs, mono-date images) are not able to cover wide enough areas [2]. The effective use of remotely sensed data for classification and unmixing cases stills a difficult task due to some limitations associated with the data resolution, processing, and costs. Recently, the advent of hyperspectral data provides hundreds of relatively narrow (≤ 10 nm), contiguous bands that may be useful for extracting land-use information and identifying the constituents of ground materials i.e., Endmember in the image pixel. Thus, dynamic object analysis by satellite observation and multi-temporal images processing could become a necessity. It is imperative for remote sensing community to expand their approaches boundaries to incorporate multi temporal images processing specially hyperspectral ones, since these kinds of images can provide a much better results for large areas. Therefore, multi-temporal data may improve accurate image analysis in situations where data is coming from a single sensor lack fidelity in the spectral or/and spatial domains [3]. 2. RELATED WORKS
The problems of multi-temporal image classification are highly relevant in most remote sensing study [4]. To address the problem of multi-temporal images analysis, a range of image processing techniques has been greatly expanded. Such as in [5], Prasad and al. proposed a framework in which they incorporate a subspace identification procedure to divide the hyperspectral space into multiple contiguous subspaces, and then a decision fusion mechanism was employed to melt local classification resulting from each subspace. In [6], the authors proposed a new method to combine original spectral information with multi-temporal texture extracted by the Pseudo Cross Variogram algorithm (PCV). Several other approaches using neural networks or SVM have been proposed. However, several problems are identified in the presented approaches. First, classifiers are, in general, sensitive to the high dimension of pixels in hyperspectral images or to higher dimensional feature space generated by putting together multi-dates features. Second, the learning of most proposed classifiers is based on different temporal data sets, i.e., a pixel group for each date. Nevertheless, at different time instants each pixels sample present distinctive characteristics due to differences in atmospheric conditions, sensor drifts, etc. Hence, the learning paradigm, investigated
PIERS ONLINE, VOL. 6, NO. 5, 2010
481
on data coming from different distributions, is violated. It does not respect the independence of features over different temporal data sets and the non-linear cross information among pixels at different temporal dates [7]. 3. OVERVIEW OF THE PROPOSED APPROACH
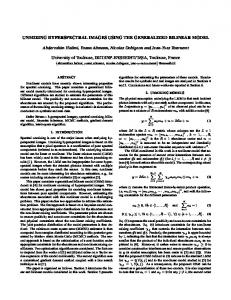
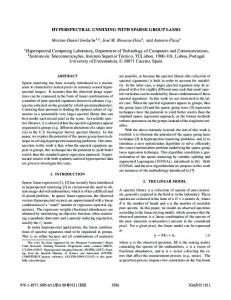
On the attempt of multi-temporal hyperspectral images classification, we outline in this research an approach including several stages. Figure 1 depicts the proposed 3D model and its application for images classification and unmixing task. The first stage is “off-line” and consists on building a 3D hyperspectral library from field missions and In-Situ data collected using a spectro-radiometer. Other stages are on-line and include several steps. The block-diagram of the “on-line” 3D model spectral matching system is depicted using the processing chain shown in Figure 1(a). on-Line Processing (a)
Off-Line (b)
Figure 1: Proposed approach.
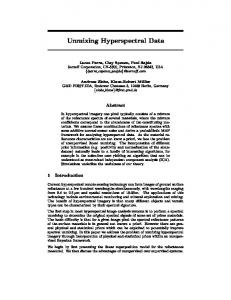
Figure 2: Proposed multi-temporal spectral signature model.
The first module inside the chain is normalization and is used to guarantee invariance with respect to rotation, translation and scaling. Indeed, different 3D spectral signature could have considerably similar shape, but different scale, orientation, and position in the 3D space. The motivation of this step can be depicted by finding a canonical position and normalized orientation for the 3D model. Then, an analytical 3D surface is generated for each pixel, Delaunay triangulation was used to generate and parameterize the obtained mesh. The respective shape descriptors will be introduced to 3D spectral search engine. The next step consists of finding the highest match score between pixels surface in the image and the surfaces stored in our 3D spectral library, a shape differentiation of meshes using a similarity measure was used. Finally, we use the spectral distance calculated between surfaces for the classification and unmixing task. 3.1. Multi-temporal Spectral Signature
In this paper, we propose a 3D model that characterizes all the pixels in a scene by considering their reflectance values as a function of imaging time and spectral waveband. To achieve this goal, we propose a new approach for designing multi-temporal spectral signature as a three dimensional function (time, reflectance, and wavelength band). Hence for each pixel,
PIERS ONLINE, VOL. 6, NO. 5, 2010
482
we generated a surface which generalizes the usual signature by adding a time dimension. Despite classical bi-dimensional spectral representation, we call this new representation the multi-temporal spectral signature. Thus, the proposed model is based on a view of multi-sources and multi-temporal hyperspectral imagery represented in a three-dimensional space (Eq. (1)), the axes of which are wavelength band (x), reflectance (y) and time (z). Multi-temporal measurement taken from different hyperspectral sensors can be plotted in this space. Ref lectanceP ixel(i,j) = f (W avelength, time)
(1)
4. OFFLINE STAGE: SPECTRAL BASE AND SURFACE RECONSTRUCTION
The objective of this research is to provide a multi-temporal hyperspectral data classification based on 3D spectral signature matching. Before this, Endmember surface should been built according to described model. For our 3D spectral data base implementation, we opted initially for a multitemporal construction based on spectrum probing. To achieve this goal, we collected a set of multitemporal spectra for each Endmember from various on line spectral databases (Hyperspectral. info, DLR, ASTER Spectral Library, USGS Digital Spectral Library, Johns Hopkins University Spectral Library, SPECCHIO, etc). Then, we constructed from single-date collected spectrums the multitemporal spectral signature by integrating the time component. We are currently working on to build the 3D spectral data base from real ground measurements. Endmember surface construction consists to translate the point cloud collected multi-temporal spectrum into a continuous 3D surface, through surface reconstruction. Surface reconstruction provides a powerful concept for modeling shapes from samples. Delaunay based surface reconstruction algorithms showed good performances either in theory or practice for point cloud data with only geometric coordinates as input. Assuming we are given a cloud point set P sampling an unknown pixel or Endmember surface and that the given sampling is dense enough. We used The SuperCocone algorithm [8] based on Divide to conquer paradigm. It demands only the computation of the Delaunay triangulation D(P ). 5. ONLINE STAGE: MULTI-TEMPORAL IMAGES UNMIXING AND CLASSIFICATION
This module allows two principals tasks: Spectral unmixing and hard classification. Spectral unmixing is a quantitative analysis used to recognize ground cover materials to obtain their mixing proportions (or abundances) from a mixed pixel. The measured mixed spectrum is decomposed into a set of endmembers and their corresponding fractional abundances within the pixel. In order to reliably estimate these maps several steps are conducted: • Endmember extraction: Endmember identification from a set of multi-temporal hyperspectral images was done by expert. Then, in order to label each Endmember, a 3D spectral matching was performed between each multi-temporal surface pixel and 3D spectral library ones. • 3D spectral matching: After generating the triangular mesh, we turn now to the spectral similarity stage. The 3D spectral matching which will take place between the built surface for each pixel with each of the surfaces stored in the 3D spectral signature. To achieve this goal, we based on the following 3D shape descriptors: Cords-Based Descriptor combining the spatial extent information and the orientation of 3D object. For all object faces, a cord is defined and constructed as a vector that runs from an object’s center to the centroid of a face. Shape Distribution describing the geometric properties of the object as a probability distribution sampled from a shape function. Because there is no optimal way of describing a 3D object, the most important requirements in choosing 3D shape descriptors are: the static dimension of feature vectors and the robustness of fundamentally chosen descriptors. The search engine (application) is based on the previous description scheme. These descriptors were chosen because they work on the mesh-domain. The first adopted similarity metric for calculating the distance and the similarity between two descriptors f 0 , f 00 is the plain Euclidean: sX 0 00 (2) diff (f , f ) = (f 0 , f 00 )2 i
Moreover, we used the Bhattacharyya distance defined by: Xp p D =1− Qi Vi Q et V are the calculated histograms i
(3)
PIERS ONLINE, VOL. 6, NO. 5, 2010
483
• Abundance quantification: The main goal of this step is to obtain an optimum and unique estimate value for the abundances α, for a given mixed pixel surface X and Endmember surface M . Thus, this step is commonly used to measure similarity between any two surfaces. Finally, the hard classification task can be performed by choosing the highest score among Endmember 3D spectral matching. 6. VALIDATION
In the present section, we describe the experiments conducted during the research and studies made for the development of the proposed approach. The experiments are conducted using MATLAB and IDRISI. The study area was located near the town of Gabes, southern Tunisia. Twenty four remotely sensed Hyperion images acquired throughout 2007 and 2008 were used for analysis. 180 spectral wavebands of Hyperion imagery were used. In addition, some field measurements were collected and used to generate a ground reference data set. The registration of all images was performed using 17 ground control points and nearest neighbor re-sampling, since this technique maintained the original pixel values. In each case, the root-mean-square error associated with registration was less than 0.5 pixels. Atmospheric correction was performed to account for atmospheric differences between multi-temporal images. The results of RMSE for each method were given in Table 1. As Table 1 has shown, the proposed approach gets the lowest RMSE among tested techniques, which means that it owns the highest accuracy. On the other hand, to evaluate the classification accuracy improvement involved by the incorporation of the multi-temporal model matching into hyperspectral data classification process, several multi-temporal approaches have been used to perform the accuracy assessment task. Then, standard accuracy measures derived from a hard classification were computed. The measures based on the confusion matrix were overall accuracy, individual class accuracy, producer’s accuracy and user’s accuracy. The pixels received the label of the output class having the highest probability. Both classification accuracies for the 4 class using are presented in Table 2. Individual classification accuracy for each land cover type, the value of the Kappa coefficients and overall accuracy are reported in this table. Table 1: RMSEs for unmixing accuracy assessment. Land cover type Water Vegetation Urban Wheats
Proposed multi-temporal unmixing 0.26 0.15 0.11 0.41
Multi-temporal LSMA 0.31 0.22 0.10 0.48
Table 2: Classification accuracies. Land cover type Water Vegetation Urban Wheats Overall (%) Kappa
Neural Networks 67.3 77.5 65.9 64.5 68.8 0.67
Linear Regression 69.6 80.1 63.5 73.6 71.7 0.69
Proposed approach Euclidan Bhattacharyya 71.5 73.6 78.8 82.3 70.0 75.1 73.2 79.4 73.37 77.6 0.71 0.78
PIERS ONLINE, VOL. 6, NO. 5, 2010
484
All classification accuracies are significant better than 70% considered as a confidence level. Moreover, the level of accuracy was gradually improved by employing the 3D similarity matching for multi-temporal hyperspectral images interpretation. 7. CONCLUSION
The basic assumption of the approach is that spectral signature is changing over time, which can be modeled through 3D surface by adding the time dimension. This investigation has been shown to be effective in identifying land surface classes. Hence, data points obscured by noise and perturbations can be filtered out throughout Delaunay triangulation and interpolation. Moreover, the overall spectral variation of a given Endmember over the time is captured by a set of shape descriptors. REFERENCES
1. Holter, M. R., “Remote sensing: The next 50 years,” IEEE Transactions on Aerospace and Electronic Systems, Vol. 20, No. 4, 316–324, July 1984. 2. Berni, J. A. J., P. J. Zarco-Tejada, L. Suarez, and E. Fereres, “Thermal and narrowband multispectral remote sensing for vegetation monitoring from an unmanned aerial vehicle,” IEEE Transactions on Geoscience and Remote Sensing, Vol. 47, No. 3, 722–738, 2009. 3. Bruzzone L., P. C. Smits, and J. C. Tilton, “Foreword special issue on analysis of multitemporal remote sensing images Bruzzone,” IEEE Transactions on Geoscience and Remote Sensing, Vol. 41, No. 11, 2419–2422, 2003. 4. Jeon, B. and D. A. Landgrebe, “Decision fusion approach for multitemporal classification,” IEEE Transactions on Geoscience and Remote Sensing, Vol. 37, No. 3, 1227–1233, May 1999. 5. Radke, R. J., S. Andra, O. Al-Kofahi, and B. Roysam, “Image change detection algorithms: A systematic survey,” IEEE Trans. Image Process, Vol. 14, No. 3, 294–307, March 2005. 6. Du, Q., L. L. Wasson, and R. King, “Unsupervised linear unmixing for change detection in multitemporal airborne hyperspectral imagery,” Proceedings of the 3rd International Workshop on the Analysis of Multi-Temporal Remote Sensing Images, Biloxi, MS, 2005. ´ 7. Camps-Valls, G., L. G´omez-Chova, J. Mu˜ noz-Mar´ı, J. L. Rojo-Alvarez, and M. Mart´ınezRam´on, “Kernel-based framework for multitemporal and multisource remote sensing data classification and change detection,” IEEE Transactions on Geoscience and Remote Sensing, Vol. 46, 2008. 8. Dey, T. K., J. Giesen, and J. Hudson, “Delaunay based shape reconstruction from large data,” “IEEE Symposium on Parallel and Large-data Visualization and Graphics, Vol. 4, 19–146, 2001.