applied sciences Article
Multi-Temporal Remotely Sensed Data for Degradation Dynamics in Linxia Rangeland, Northwest China Xinyang Yu 1, *, Changhe Lu 2 and Gengxing Zhao 1 1 2
*
College of Resources and Environment, Shandong Agricultural University, Tai’an 271018, China;
[email protected] Key Laboratory of Land Surface Pattern and Simulation, Institute of Geographic Sciences and Natural Resources Research, Chinese Academy of Sciences, Beijing 100101, China;
[email protected] Correspondence:
[email protected]; Tel.: +86-156-8882-7280
Academic Editor: Antonio Fernández-Caballero Received: 27 October 2016; Accepted: 23 January 2017; Published: 3 March 2017
Abstract: The importance of accurately monitoring rangeland degradation dynamics over decades is increasing in Linxia rangeland, the birthplace of the Yellow River in China. Since 2000, the Chinese government has implemented the “Grain for Green” program and enforced a grazing ban in Gansu province, one of the most degraded provinces, to mitigate the problem of rangeland degradation. The effects of these policies are controversial and have become a topic of public concern. In this study, a grading system was established for the estimation of Linxia rangeland degradation. Degrees of rangeland degradation were interpreted and the spatio-temporal dynamics of the degraded rangeland through several study periods were mapped and monitored using the Linear Spectral Mixture Analysis method on Landsat Thematic Mapper (TM)/ETM+ (Enhanced Thematic Mapper Plus) images for the years of 1996, 2001, 2006, and 2011. The results demonstrated that the time around the year 2001 appeared to be a turning point of the rangeland degradation reversion course, as the rangeland degradation reversed significantly since 2001. From 1996 to 2001, the total degraded area in Linxia rangeland increased from 2922.01 km2 to 3048.48 km2 (+4.33%), and decreased by 4.54% to 2909.97 km2 in 2011; the non-degraded rangeland gradually increased from 602.74 km2 to 710.01 km2 , an increase of 17.80%. Degraded rangeland vegetation was restored significantly during 2001–2011: the area of slightly degraded rangeland increased by 3.71% and 3.83% annually during 2001–2006 and 2006–2011 intervals, respectively, and the area of moderately and severely degraded rangeland decreased annually by 4.77% and 2.41% from 2001 to 2006, and 4.58% and 0.81% during 2006–2011, respectively. These results indicated that the “Grain for Green” program and grazing ban policy, together with other ecological impacting factors, helped reverse the rangeland degradation and promote the rehabilitation of rangeland vegetation. Keywords: rangeland degradation; spectral mixture analysis; “Grain for Green” program; grazing ban policy; Linxia rangeland
1. Introduction The degradation of rangeland in semi-arid and dry sub-humid regions due to climate change and/or human activity has long been an issue attracting public concern, especially in northwest China. By the end of 2011, the area of rangeland in China was 39.30 million km2 , accounting for 41.70% of its territory. However, more than 90% of China’s rangeland is subject to various degrees of degradation [1], and rangeland degradation has become a serious issue that results in ecological and socio-economic ramifications. Accurate mapping and monitoring of rangeland degradation are
Appl. Sci. 2017, 7, 241; doi:10.3390/app7030241
www.mdpi.com/journal/applsci
Appl. Sci. 2017, 7, 241
2 of 11
essential for further assessing and combating the increasing problem [2]. Since the 1980s, remotely sensed data has gradually become the main data source of research in rangeland degradation, which Appl. Sci. 2017, 7, 241 2 of 11 can provide multi-temporal and various spatial scale information of rangeland degradation [3–9]. The Linxia rangeland is located in the ecotone of farming-grazing, in northwest China. As the sensed data has gradually become the main data source of research in rangeland degradation, which first renowned rangelands in the headstream of Yellow river, Linxia rangeland was once known can provide multi‐temporal and various spatial scale information of rangeland degradation [3–9]. for The Linxia rangeland is located in the ecotone of farming‐grazing, in northwest China. As the being a flourishing, prosperous, and productive ecosystem in the 1800s. However, since the 1980s, first renowned rangelands in the headstream of Yellow river, Linxia rangeland was once known for overgrazing and excessive cultivation gradually deteriorated its ecological sustainability, which led to being a flourishing, prosperous, and productive ecosystem in the 1800s. However, since the 1980s, adverse impacts to the middle and lower reaches of the Yellow River. To combat the worsening issue, overgrazing and excessive cultivation gradually deteriorated its ecological sustainability, which led the Chinese government implemented two protection policies, the “Grain for Green” program and to adverse impacts to the middle and lower reaches of the Yellow River. To combat the worsening a grazing ban, which has been in place since 2000, to convert cultivated farmland back to rangeland and issue, the Chinese government implemented two protection policies, the “Grain for Green” program promote the rehabilitation of rangeland vegetation in the ecotone of farming-grazing. Until recently, and a grazing ban, which has been in place since 2000, to convert cultivated farmland back to no study has been done to accurately detect and precisely monitor the dynamics of the Linxia rangeland. rangeland and promote the rehabilitation of rangeland vegetation in the ecotone of farming‐grazing. In the present study, a rangeland gradation system for the years of 1996, 2001, 2006, and 2011 was Until recently, no study has been done to accurately detect and precisely monitor the dynamics of established based on multi-temporal Landsat images and field survey, and the Linear Spectral Mixture the Linxia rangeland. In the present study, a rangeland gradation system for the years of 1996, 2001, 2006, and 2011 was established based on multi‐temporal Landsat images and field survey, and the Analysis (LSMA) methods were selected to interpret the data from the four periods (1996, 2001, 2006, Linear Spectral Mixture Analysis (LSMA) methods were selected to interpret the data from the four and 2011). periods (1996, 2001, 2006, and 2011).
2. Materials and Methods 2. Materials and Methods
2.1. Study Region 2.1. Study Region
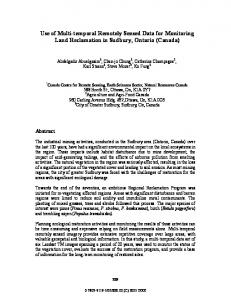
The selected study region extends from 101◦ 460 to 103◦ 310 E and 34◦ 360 to 35◦ 510 N with an area of The selected study region extends from 101°46′ to 103°31′ E and 34°36′ to 35°51′ N with an area about 11,870 km2 (Figure 1). It is occupied by five administrative units (i.e., Linxia City, Linxia County, of about 11,870 km2 (Figure 1). It is occupied by five administrative units (i.e., Linxia City, Linxia Jishishan Autonomous County, Hezheng County, and Xiahe County), which are distributed on one County, Jishishan Autonomous County, Hezheng County, and Xiahe County), which are distributed Landsat Thematic (TM) remotely sensed image. to the to location on theon northeast on one Landsat Mapper Thematic Mapper (TM) remotely sensed Owning image. Owning the location the edgenortheast edge of the Qinghai‐Tibet Plateau, the altitude of the study region rises from 1685 m above of the Qinghai-Tibet Plateau, the altitude of the study region rises from 1685 m above sea level (a.s.l.) in the northeast to 4618 m a.s.l. in the southwest. The river basins define the main drainage sea level (a.s.l.) in the northeast to 4618 m a.s.l. in the southwest. The river basins define the main network of thenetwork study region, dividing it intodividing two main zones:ecological irrigationzones: farmland drainage of the generally study region, generally it ecological into two main irrigation farmland and alpine rangeland. Irrigation farmland is mainly distributed in the northeast and alpine rangeland. Irrigation farmland is mainly distributed in the northeast low altitude region, low in altitude region, whereas southwest of the region where the elevation whereas the southwest part ofin thethe study regionpart where the study elevation it typically upwards ofit more thantypically upwards of more than 2500 m a.s.l., the local climate pattern is cold and relatively humid; 2500 m a.s.l., the local climate pattern is cold and relatively humid; in this region the annual in this region the annual average temperature is less than 0 °C, and the annual precipitation ranges average temperature is less than 0 ◦ C, and the annual precipitation ranges from 350 mm to 620 mm, from 350 mm to 620 mm, which is conducive to the growth of alpine meadow. Located in the which is conducive to the growth of alpine meadow. Located in the ecotone of farming-grazing, which ecotone of farming‐grazing, which is also the transitional region of the sub‐humid region and alpine is also the transitional region of the sub-humid region and alpine zone, Linxia rangeland is a relatively zone, Linxia rangeland is a relatively fragile ecological system and vulnerable to rangeland fragile ecological system and vulnerable to rangeland degradation. degradation.
Figure 1. Location of the study region.
Figure 1. Location of the study region.
Appl. Sci. 2017, 7, 241
3 of 11
2.2. Data and Preprocessing Four Landsat TM (Thematic Mapper) images acquired in 1996, 2001, 2006, and 2011 were selected as the main data sources to analyze the effects before and after the implementation of the two rangeland protection policies; the images were selected for their cloud-free high quality and similar climate condition (Table 1). These images, downloaded from the United States Geological Survey (USGS, http://glovis.usgs.gov), were selected from images obtained during summer and autumn (July–August) when vegetation generally reaches their maximum growth during the region’s growing season [6]. All the study images were rectified to a UTM (Universal Transverse Mercator) projection (Zone 48N, Datum: WGS-84) using at least 45 well-distributed ground control points (GCPs) for each image and cubic convolution resampling [10] with the root mean square errors (RMSEs) less than 0.25 pixels (7.5 m). In addition, the land use map of 1995 and 2000 covering the study region, together with the China-Brazil Earth Resources Satellite CCD (Charge-coupled Device) image on 23 August 2007 (19.5 m spatial resolution) and recorded data in field survey in July 2012 were selected as auxiliary sources information for the four years, respectively. Table 1. Metadata of Landsat Thematic Mapper (TM)/ETM+ (Enhanced Thematic Mapper Plus) images cover the Linxia rangeland, northwest China. Year
Path/Row
Landsat Scene ID
Acquisition Date
Spatial Resolution (m)
1996 2001 2006 2011
131/35 131/35 131/35 131/35
LT51310351994200BJC00 LT51310352001203BJC00 LT51310352006217IKR00 LT51310352011199IKR00
19 July 1996 22 July 2000 6 August 2006 18 July 2011
30 30 30 30
2.3. Rangeland Gradation System Since 1984, multiple governments and organizations have set up various evaluating systems to monitor land use degradation; most of them contain dozens of indicators, which are not compatible with remotely sensed images and can only be derived from field investigation. In this study, combining the characteristics of rangeland and the interpretability of images, vegetation coverage and bare-land rate were selected as the indicators of rangeland degradation. Based on previous indicator studies [6,11–13] and China’s national standard “parameters for degradation, sandification and salification of rangelands” (GB19377–2003), Linxia rangeland was graded into the following four categories: non-degraded rangeland (Non-DR), slightly degraded rangeland (Sl-DR), moderately degraded rangeland (M-DR), and severely degraded rangeland (Se-DR). Combining the rangeland type and conditions of the study region, the remotely sensed gradation system of rangeland degradation was refined, as shown in Table 2. Table 2. Remote sensing derived system of rangeland degradation in the study region. Non-DR, non-degraded rangeland; Sl-DR, slightly degraded rangeland; M-DR, moderately degraded rangeland; and Se-DR, severely degraded rangeland. Type
Vegetation Coverage (%)
Vegetation Pattern
Bare-Land Rate (%)
Bare-Land Pattern
Non-DR
>80
No shrub or inedible grass