Hindawi Publishing Corporation Mathematical Problems in Engineering Volume 2015, Article ID 363056, 18 pages http://dx.doi.org/10.1155/2015/363056
Research Article Multidemand Multisource Order Quantity Allocation with Multiple Transportation Alternatives Jun Gang,1,2 Yan Tu,2,3 and Jiuping Xu2 1
Sichuan Institute of Building Research, Chengdu 610081, China Business School, Sichuan University, Chengdu 610064, China 3 School of Management, Wuhan University of Technology, Wuhan 430070, China 2
Correspondence should be addressed to Jiuping Xu;
[email protected] Received 25 July 2015; Revised 26 September 2015; Accepted 29 September 2015 Academic Editor: Young Hae Lee Copyright © 2015 Jun Gang et al. This is an open access article distributed under the Creative Commons Attribution License, which permits unrestricted use, distribution, and reproduction in any medium, provided the original work is properly cited. This paper focuses on a multidemand multisource order quantity allocation problem with multiple transportation alternatives. To solve this problem, a bilevel multiobjective programming model under a mixed uncertain environment is proposed. Two levels of decision makers are considered in the model. On the upper level, the purchaser aims to allocate order quantity to multiple suppliers for each demand node with the consideration of three objectives: total purchase cost minimization, total delay risk minimization, and total defect risk minimization. On the lower level, each supplier attempts to optimize the transportation alternatives with total transportation and penalty costs minimization as the objective. In contrast to prior studies, considering the information asymmetry in the bilevel decision, random and fuzzy random variables are used to model uncertain parameters of the construction company and the suppliers. To solve the bilevel model, a solution method based on Kuhn-Tucker conditions, sectional genetic algorithm, and fuzzy random simulation is proposed. Finally, the applicability of the proposed model and algorithm is evaluated through a practical case from a large scale construction project. The results show that the proposed model and algorithm are efficient in dealing with practical order quantity allocation problems.
1. Introduction In today’s ever-changing competitive market environment, purchasing strategy is extremely important for each manufacturing company because of the tremendous impact of material costs on profits [1]. This situation is also appropriate for construction companies which are manufacturers of construction projects. In purchasing management, two decisions are mainly involved: supplier selection and order allocation. Supplier selection is a critical task to achieve the different objectives of supply chain because it can help the company to maintain long relationship with few reliable suppliers [2]. To deal with supplier selection, many methodologies have been proposed, including multiattribute decision making techniques, mathematical programming, and artificial intelligence methods [3]. In material purchasing process, after choosing suitable suppliers, order allocation is the next important stage to determine the optimal order quantity allocation scheme, especially in the case of a multiple suppliers
environment. Many models and methods have been proposed to deal with order quantity allocation problems such as linear programming model [4], mixed integer programming model [5, 6], nonlinear programming [7, 8], and artificial intelligence technique [9, 10]. In the above literatures, almost all consider multiple suppliers (i.e., multisource) while only one demand node is included. However, in some large scale companies or construction projects, we often face multiple demand nodes such as multiple production factories or multiple construction sites at the same time. Moreover, it is possible that a supplier provides materials for the multiple demand nodes at the same time. In this situation, we have to allocate order quantity under a multidemand multisource environment. This is a more difficult problem where each supplier has to transport materials to multiple demand nodes. As we know, for most suppliers, there are multiple optional transportation alternatives defined by vehicles, routes, and modes for a type of specific material [11, 12]. However, each alternative often
2 has its own limited capacity. Hence, in the multidemand multisource order allocation problem, once the order quantity is determined for each supplier, they have to optimize their transportation alternatives. In the existing researches, few consider the vital role of the transportation alternatives in the order allocation process although it is significantly important to the supplier evaluation and order allocation decisions. Ghodsypour and O’Brien [5] proposed a mixed integer nonlinear programming model to solve the multisource problem, which took into account the total cost of logistics, including net price, storage, transportation, and ordering costs. Kawtummachai and Hop [13] constructed an orders quantity allocation method to the selected supplier in order to optimize the purchase cost within the acceptable percentage of on-time delivery which is influenced by transportation alternatives to guarantee high service levels to the retailers. Dullaert et al. [14] considered a combinatorial optimization model for determining the optimal mix of transportation alternatives to minimize total logistics costs when goods are shipped from a supplier to a customer. Jafari Songhori et al. [11] first explicitly presented a decision framework which considered different transportation alternatives from suppliers to demander. It should be noted that, in all these papers, the order allocation and transportation alternatives are determined by the same decision maker (i.e., the purchaser). However, in practice, only the price and order quantity are written into agreements in most cases. As for how to transport material or goods, it is often directed by the suppliers. Hence, two decision making processes should be considered. First, the purchaser such as the construction company in a construction project decides how to allocate order quantity among multiple suppliers for multiple demand nodes. Then, based on the allocated order quantity, each supplier will decide how to transport them to demand nodes through multiple transportation alternatives. In this situation, the multidemand multisource order allocation problem should be considered as a bilevel decision making problem. Besides for the bilevel structure, the uncertainty, which is also an important factor, will be considered in this paper. Many papers have paid attention to uncertain supplier selection and order allocation problem. Xu and Nozick [6] proposed a two-stage mixed integer stochastic programming model to optimize supplier selection. Yang et al. [15], J.-L. Zhang and M.-Y. Zhang [16], and Esfandiari and Seifbarghy [17] discussed the supplier selection and order allocation problem with stochastic demand. Kumar et al. [18] studied a multiobjective integer programming vendor selection problem with fuzzy parameters. Amid et al. [19] and NazariShirkouhi et al. [20] applied fuzzy programming theory to deal with the multiobjective supplier selection and order allocation problem. In the researches mentioned above, fuzziness and randomness were often considered separate aspects. But in reality, we may face a hybrid uncertain environment where fuzziness and randomness coexist in a decision making process. For example, transportation cost from one supplier to one demand node is often modeled as a stochastic parameter. However, in a bilevel environment, because of the information asymmetry between the two levels
Mathematical Problems in Engineering of decision makers, the upper decision maker may modify the accuracy of the given transportation cost. As a result, he may modify the uncertain transportation cost using a fuzzy variable. In this situation, the cost is a hybrid of fuzzy and random factors, and the fuzzy random variable, which was first proposed by Kwakernaak [21] and then extended by Puri and Ralescu [22], can be a useful tool to deal with it. Hence, we face a bilevel multidemand multisource order quantity allocation problem under a fuzzy random environment. In the problem, two levels of decision makers must be considered. On the upper level, the purchaser attempts to allocate order quantity among multiple suppliers for multiple demand nodes with the objectives of total purchase cost and total purchase risk minimization. On the lower level, each supplier will select the transportation alternatives from the supplier to demand nodes with the objective of total transportation and penalty costs minimization. Simultaneously, some uncertain parameters in the problem such as demand, transportation cost, and risk coefficients must also be considered. To deal with this problem, a bilevel multiobjective programming model with uncertain coefficients is proposed. Specifically, some uncertain coefficients are modeled as fuzzy random variables. In addition, to search the optimal solution of proposed model, a solution method based on KuhnTucker conditions, sectional genetic algorithm (SGA), and fuzzy random simulation is also proposed. Finally, results and comparison analysis of a case study are presented to demonstrate the practicality and efficiency of the proposed model and algorithm. The remainder of this paper is structured as follows: in Section 2, an introduction to the bilevel multiobjective multidemand multisource order allocation problem is presented along with the motivation for employing uncertain variables in the problem. A bilevel multiobjective programming model under a mixed uncertain environment is established in Section 3. In addition, a solution method is illustrated in Section 4. In Section 5, a case study from a practical example is given to show the validity and efficiency of the proposed model and algorithm. Conclusions and a discussion regarding further research are remarked in Section 6.
2. Key Problem Statement The problem considered in this paper is a bilevel multiobjective multidemand multisource order allocation problem with multiple transportation alternatives under a mixed uncertain environment. In this section, we explain why this problem should be considered a bilevel multiobjective programming model and why the demand, transportation cost, and time are able to be modeled as random or fuzzy random variables. 2.1. Conflict Description for Order Quantity Allocation. In large scale construction projects, many construction materials are consumed in a great deal every day; these materials are often purchased from multiple material suppliers. In addition, because of the big construction ground, it is impossible to store these materials in a storehouse. Hence, there are often multiple demand nodes which serve for
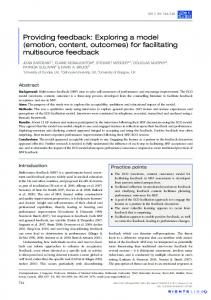
Mathematical Problems in Engineering various construction activities. That is, the purchase problem in construction engineering can be summarized as a multidemand multisource problem. In this problem, two levels of stakeholders should be considered. On one hand, the construction company is the purchaser, who allocates order quantity among multiple suppliers for each demand node. On the other hand, the material suppliers are the vendors, who are in charge of the supply and transportation of construction materials. They can select transportation alternatives from suppliers to demand nodes for each pair. As the purchaser, the construction company plays a leading role in the decision making, which can affect the suppliers’ income with different order allocation planning. Three objectives are often considered in supplier selection and order allocation [23]: total purchase cost minimization, total delay risk minimization, and total defect risk minimization. It should be noted that the second and third objectives on risk are related to transportation alternatives defined by vehicles, routes, and modes. In other words, the decision making of upper level is influenced by lower level’s decision making. In the lower level, material suppliers often aim to seek for transportation alternatives with minimal total transportation and penalty costs when their income order quantities have been determined. However, the transportation alternatives with low cost may lead to high delay risk and defect risk. In this case, the objectives between the construction company and suppliers are in conflict. In the conflict situation, the decision makers pursue to achieve their own goals. The construction company first hopes to reach its own targets by making a better order quantity allocation scheme while considering the possible reactions of the suppliers. Then the suppliers hope to save cost by selecting better transportation alternatives based on the allocated order quantity. Therefore, the considered problem can be abstracted as a bilevel decision making problem. In the bilevel problem, the construction company, which is the upper level decision maker, seeks to allocate order quantity to multiple suppliers for multiple demand nodes with lower cost and lower risk, while material suppliers, who are the lower level decision makers, determine transportation alternatives for each pair from suppliers to demand nodes. In addition, it should also be noted that because of the complexity of the decision system the complete decision making process is conducted in an uncertain environment. In this paper, some uncertain parameters are considered as random or fuzzy random variables. Hence, the considered problem is a bilevel multiobjective order quantity allocation problem under a mixed uncertain environment, and the framework of the bilevel decision making with conflicting objectives is illustrated in Figure 1. 2.2. Uncertainty Description for Order Quantity Allocation. In the order quantity allocation problem of construction projects, as well as the bilevel structure of the model, it is also important to consider the uncertainty of the parameters. In this paper, our main consideration is the uncertainty of demand, transportation cost, delay risk, and defect risk.
3 In the order allocation problem, the demand quantity for each demand node is always uncertain and often considered a stochastic coefficient such as in [15–17], because the decision maker often has enough data to obtain its probability distribution although it is difficult to get the exact value. In this paper, as the decision coefficient of upper level decision maker, it is also reasonable to assume that the decision maker can obtain the probability distribution function of demand quantity for each demand node. Hence, the demand quantity is also assumed to be stochastic in this paper. Different from the demand quantity, the transportation cost from one supplier to one demand node with one specific transportation alternative is a decision coefficient of the lower decision maker. Essentially, it can also be modeled as a random variable just as the demand quantity. Here, we just as well assume the stochastic cost with a normal distribution 𝑐 ∼ 𝑁(𝜇, 𝜎). However, as described above, in the bilevel problem, there are conflicting objectives between the two levels of decision makers. Moreover, the information between them is also asymmetrical. That is, it is impossible that the decision maker on the upper level knows all information of the lower level decision makers. As a result, the lower level decision makers may provide inaccurate information to the upper level decision maker in the trade. Of course, the upper level decision maker may also not trust the obtained information. In this case, we can only just say that “the transportation cost is about 𝑐.” Here, the word “about” is an ambiguous expression which can be modeled using triangular fuzzy variable (𝑐 − 𝑎, 𝑐, 𝑐 + 𝑏), where 𝑐 − 𝑎, 𝑐 and 𝑐 + 𝑏 are the minimum value, the most possible value, and the maximum value of the transportation cost, respectively. It can be seen that the fuzzy transportation cost is a modified value of the random cost in a certain extent. Finally, the transportation cost can be expressed as ̃𝑐 = (𝑐 − 𝑎, 𝑐, 𝑐 + 𝑏), with 𝑐 ∼ 𝑁(𝜇, 𝜎). This is a triangular fuzzy random variable which has been successfully applied to many areas such as inventory problem [24], vehicle routing [25], and water resources allocation [26]. In conclusion, the motivation for employing fuzzy random variables in the bilevel order allocation problem can be illustrated in Figure 2. The cases of delay risk and defect risk are similar with the cost, which are also decision coefficients of the lower model. Hence, they are also modeled as fuzzy random variables in this paper.
3. Modelling In this section, a bilevel multiobjective programming model for the multidemand multisource purchase problem considering fuzziness and randomness is constructed. The mathematical description for the problem is given as follows. 3.1. Assumptions and Notations. Before constructing the model in this paper, the following assumptions are adopted: (1) Only one type of commodity is considered to be purchased in the model at each time. (2) There are multiple suppliers, and a lowest order quantity has been determined in contract for each supplier.
4
Mathematical Problems in Engineering Upper level Order quantity allocation model
Random environment
Decision maker Construction company
Decision variable Order quantity to supplier j for demand node i
Random demand quantity
Objectives
Upper level decision making system
(1) Total purchase cost minimization (2) Total delay risk minimization (3) Total defect risk minimization Two stakeholders
Multiple demands
Demand node 1
Demand node 2
···
Demand node i
Demand node I
Transportation
ity ant qu
Orde
der Or
Transportation
r qua ntity
Conflict of interests
Supplier 1
Supplier 2
Supplier j
···
Supplier J
Bilevel decision model
Multiple sources
Decision variable
Transportation alternative from supplier j to demand node i
Lower level Transportation alternative selection model
Lower level decision making system
Decision maker Suppliers j = 1, 2, . . . , J
Objective Total transportation and penalty costs minimization
Fuzzy random transportation cost, delay risk, and defect risk Fuzzy random environment
Figure 1: The decision framework of the bilevel order quantity allocation problem.
(3) There are multiple demand nodes, and their demand quantities are uncertain which can be modelled as random variables. (4) Each supplier has multiple transportation alternatives, and different transportation alternatives have different transportation cost and risk. (5) The transportation cost, percentage of late delivered units, and percentage of rejected units for each transportation alternative from one supplier to one
demand node are considered fuzzy random variables. The following symbols are used in this paper. Indices. The indices are as follows: 𝑖: demand node, 𝑖 ∈ Ψ = {1, 2, . . . , 𝐼}. 𝑗: supplier (source), 𝑗 ∈ Φ = {1, 2, . . . , 𝐽}. 𝑘: transportation alternative, 𝑘 ∈ Ω = {1, 2, . . . , 𝐾}.
Mathematical Problems in Engineering
5
Transportation cost
Delay risk
(1) Total purchase costs minimization (2) Total delay risk minimization (3) Total defect risk minimization
b
𝜇̃c
1.0 ̃c = (c − a, c, c + b)
Defect risk
Conflict +
Total transportation and penalty costs minimization
Information asymmetry Query Analysis to history statistical data to 2 2 1 c e−(x−𝜇) /2𝜎 𝜑c = √2𝜋𝜎
It is about c c
Lower level DM Suppliers
Confront some uncertain parameters when attempting to optimize their objectives
Objective
Objectives
Upper level DM Purchaser (construction company)
Modify c to ̃c by a and b
a 0
𝜇 c ∼ N(𝜇, 𝜎)
0
x) 𝜑 c(
𝜇̃c
x
Representation of a fuzzy random variable
1.0
c1 c2
a b c3
c1 , c2 , and c3 just represent three possible values in the probability distribution
x∈
R
Fuzzy random transportation cost ̃c = (c − a, c, c + b), with c ∼ N(𝜇, 𝜎) Considering transportation cost
Figure 2: Employing fuzzy random variable to express the transportation cost for bilevel order allocation problem.
Certain Variables. Certain variables are as follows: 𝐵𝑖 : total budget for demand node 𝑖. 𝑆𝑗 : supply capacity of supplier 𝑗. 𝑃𝑗 : unit price in supplier 𝑗. 𝐶𝑖𝑗 : order cost from supplier 𝑗 for demand node 𝑖. MO𝑗 : minimal order quantity for supplier 𝑗. TP𝑗𝑘 : transportation capacity for supplier 𝑗 with transportation alternative 𝑘. CP𝑗 : unit defect penalty cost for supplier 𝑗. 𝑙𝑗max : highest delay rate for supplier 𝑗.
Random Variables 𝑄𝑖 : demand quantity of demand node 𝑖. Fuzzy Random Variables. Fuzzy random variables are as follows: ̃ 𝑙𝑗𝑘 : percentage of late delivered units for supplier 𝑗 with transportation alternative 𝑘. ̃𝑟 : percentage of rejected units for supplier 𝑗 with 𝑗𝑘 transportation alternative 𝑘. ̃𝑐 : unit transportation cost from supplier 𝑗 to 𝑖𝑗𝑘 demand node 𝑖 using transportation alternative 𝑘.
6
Mathematical Problems in Engineering
𝑥𝑖𝑗 : order quantity from supplier 𝑗 to demand node 𝑖.
̃ also be transformed into ∑𝑖∈Ψ ∑𝑗∈Φ ∑𝑘∈Ω 𝐸[𝑙𝑗𝑘 ]𝑦𝑖𝑗𝑘 . Therefore, the second objective for the upper level can be expressed as
𝑦𝑖𝑗𝑘 : transported quantity from supplier 𝑗 to demand node 𝑖 using transportation alternative 𝑘.
̃ min 𝐸 [TL] = ∑ ∑ ∑ 𝐸 [𝑙𝑗𝑘 ] 𝑦𝑖𝑗𝑘 . 𝑥
Decision Variables. Decision variables are as follows:
1, if at least one unit of material is provided by supplier 𝑖 for demand node 𝑗, 𝑧𝑖𝑗 : { 0, otherwise.
The multidemand multisource purchase problem by the purchaser and the transportation alternatives decision making problems by the suppliers are expressed in detail in the following sections, and the relationship between these two decision makers is also discussed, which can be abstracted as a bilevel decision making model. 3.2. Order Quantity Allocation Model. As the upper decision maker, the purchaser will consider how to allocate order quantity among multiple suppliers for multiple demand nodes. The decision variables are the allocated order quantity 𝑥𝑖𝑗 for each pair of supplier and demand node. 3.2.1. Objectives of Construction Company. As mentioned above, in an order quantity allocation problem of a construction project, the purchaser (e.g., the construction company) often has three objectives [20, 23]: total purchase cost minimization, total delay risk minimization, and total defect risk minimization. (1) Total Purchase Cost Minimization. The purchaser first aims to control the total purchase cost, which is made up of purchase price (i.e., ∑𝑖∈Ψ ∑𝑗∈Φ 𝑃𝑗 𝑥𝑖𝑗 ) and order cost (i.e., ∑𝑖∈Ψ ∑𝑗∈Φ 𝐶𝑖𝑗 𝑧𝑖𝑗 ). Therefore the first objective of the upper level can be described as min TC = ∑ ∑ 𝑃𝑗 𝑥𝑖𝑗 + ∑ ∑ 𝐶𝑖𝑗 𝑧𝑖𝑗 . 𝑥 𝑖𝑗
𝑖∈Ψ 𝑗∈Φ
𝑖∈Ψ 𝑗∈Φ
(1)
(2) Total Delay Risk Minimization. In construction projects, project completed time is always discussed in any phase of the construction process. For material transportation, if the material is late delivered, some construction activities may be postponed; as a result, the whole project cannot be finished on time. Hence, the delay risk must be considered in the model. Here, the delay risk is described using the percentage of late delivered units, and the total delay risk can be described as ̃ ∑𝑖∈Ψ ∑𝑗∈Φ ∑𝑘∈Ω 𝑙𝑗𝑘 𝑦𝑖𝑗𝑘 . ̃ Since 𝑙𝑗𝑘 are fuzzy random variables, the total delay risk can be regarded as a special fuzzy random variable. Because of the uncertainty, it is difficult for decision makers to obtain an exact value for the delay risk. Therefore, the decision maker often tends to obtain an expected total delay risk with an expected value operation for the uncertain variables, which ̃ can be denoted as 𝐸[∑𝑖∈Ψ ∑𝑗∈Φ ∑𝑘∈Ω 𝑙𝑗𝑘 𝑦𝑖𝑗𝑘 ] according to the definition of expected value in [27]. The equation above can
𝑖𝑗
𝑖∈Ψ 𝑗∈Φ 𝑘∈Ω
(2)
(3) Total Defect Risk Minimization. The third objective is related to the quality of ordered items. It is described with the number of rejected items, which is a product term of the percentage of rejected units ̃𝑟𝑗𝑘 and the order quantity 𝑦𝑖𝑗𝑘 . For most of construction materials, the percentage of rejected units is closely related to the transportation alternative, because they often have high loss (1%–6%) during transportation, and the loss is mainly affected by the type of material, transportation mode, vehicle, and route. Taking cement, for example, it can be transported by cement canned cars, specialized cement trucks, and common trucks, where the rates of loss during transportation are about 1%, 2%, and 3%, respectively. For the same reason as the second objective, the decision maker also aims to obtain an expected defect risk. Hence, the third objective for the upper level can be described as 𝐸 (TR) = ∑ ∑ ∑ 𝐸 [̃𝑟𝑗𝑘 ] 𝑦𝑖𝑗𝑘 . min 𝑥 𝑖𝑗
𝑖∈Ψ 𝑗∈Φ 𝑘∈Ω
(3)
3.2.2. Constraints on Order Quantity Allocation. There are five main types of constraints on the upper level for the order quantity allocation problem; details of them are explained in the following. (1) Requirement Constraint. The total purchase quantity ∑𝑗∈Φ 𝑥𝑖𝑗 must exceed the demand quantity 𝑄𝑖 for each demand node 𝑖. Technically, it is not possible to strictly ensure ∑𝑗∈Φ 𝑥𝑖𝑗 exceed 𝑄𝑖 because of the uncertain variables 𝑄𝑖 . In a practical problem, the decision makers often ensure the restriction is satisfied to a certain extent. In these cases, chance-constrained operation, which was first introduced by Charnes and Cooper [28], is used to deal with this constraint. In this problem, the upper level decision maker provides a confidence level 𝛼 for the random event; thus we have the following constraint: } { Pr { ∑ 𝑥𝑖𝑗 ≥ 𝑄𝑖 } ≥ 𝛼, ∀𝑖 ∈ Ψ. } {𝑗∈Φ
(4)
(2) Supply Constraint. For each construction material supplier 𝑗, the total order quantity ∑𝑖∈Ψ 𝑥𝑖𝑗 from all demand nodes must be smaller than its supply capacity 𝑆𝑗 , which can be denoted as ∑ 𝑥𝑖𝑗 ≤ 𝑆𝑗 ,
𝑖∈Ψ
∀𝑗 ∈ Φ.
(5)
(3) Minimal Order Quantity Constraint. In construction projects, the demand quantity is often very big for many types of construction materials. In order to maintain
Mathematical Problems in Engineering
7
the contract with the suppliers more effectively, a minimal order quantity is usually set up for each supplier. Hence, we have the following constraint: ∑ 𝑥𝑖𝑗 ≥ MO𝑗 , ∀𝑗 ∈ Φ.
𝑖∈Ψ
(6)
(4) Budget Constraint. In order to control cost, the construction company always determines a cost budget for each construction unit. Thus, for each demand node 𝑖, the total purchase cost ∑𝑗∈Φ 𝑃𝑗 𝑥𝑖𝑗 + ∑𝑗∈Φ 𝐶𝑖𝑗 𝑧𝑖𝑗 must be smaller than the cost budget 𝐵𝑖 for this material purchasing; thus we can obtain the following constraints: ∑ 𝑃𝑗 𝑥𝑖𝑗 + ∑ 𝐶𝑖𝑗 𝑧𝑖𝑗 ≤ 𝐵𝑖 ,
𝑗∈Φ
∀𝑖 ∈ Ψ.
𝑗∈Φ
(7)
(5) Logicality Conditions. If the construction company purchases material from supplier 𝑗 for demand node 𝑖 (i.e., 𝑥𝑖𝑗 > 0), the auxiliary variable 𝑧𝑖𝑗 must take value of 1. Otherwise (i.e., 𝑥𝑖𝑗 = 0), 𝑧𝑖𝑗 has to take value of 0. Let 𝑀 be a great number; then the following constraints are obtained: 𝑥𝑖𝑗 𝑀
≤ 𝑧𝑖𝑗 ≤ 𝑥𝑖𝑗 , ∀𝑖 ∈ Ψ, 𝑗 ∈ Φ.
(8)
From the descriptions above, based on the three objective functions and five types of constraints, we can obtain the order quantity allocation model for the upper level decision maker (i.e., the construction company) as the following: (ULM) 𝑥𝑖𝑗 ,𝑧𝑖𝑗
TC = ∑ ∑ 𝑃𝑗 𝑥𝑖𝑗 + ∑ ∑ 𝐶𝑖𝑗 𝑧𝑖𝑗
𝑥𝑖𝑗 ,𝑧𝑖𝑗
min
̃ 𝐸 [TL] = ∑ ∑ ∑ 𝐸 [𝑙𝑗𝑘 ] 𝑦𝑖𝑗𝑘
min
𝐸 [TR] = ∑ ∑ ∑ 𝐸 [̃𝑟𝑗𝑘 ] 𝑦𝑖𝑗𝑘
min
𝑥𝑖𝑗 ,𝑧𝑖𝑗
s.t.
𝑖∈Ψ 𝑗∈Φ
𝑖∈Ψ 𝑗∈Φ
𝑖∈Ψ 𝑗∈Φ 𝑘∈Ω
∀𝑗 ∈ Φ.
(10)
𝑖∈Ψ 𝑘∈Ω
(9)
∑ 𝑥𝑖𝑗 ≥ MO𝑗 , ∀𝑗 ∈ Φ
𝑖∈Ψ
𝑗∈Φ
𝑖∈Ψ 𝑘∈Ω
+ ∑ ∑ CP𝑗 𝐸 [̃𝑟𝑖𝑗𝑘 ] 𝑦𝑖𝑗𝑘 ,
𝑖∈Ψ
∑ 𝑃𝑗 𝑥𝑖𝑗 + ∑ 𝐶𝑖𝑗 𝑧𝑖𝑗 ≤ 𝐵𝑗 ,
3.3.1. Transportation Alternatives Selection Objectives for Suppliers. For suppliers (i.e., lower level decision makers), they hope to save cost by selecting better transportation alternatives. Therefore, minimizing the costs (including transportation cost and penalty cost) is often their objectives. For each supplier, the transportation cost is associated with the unit transportation cost ̃𝑐𝑖𝑗𝑘 and transportation volume 𝑦𝑖𝑗𝑘 for each transportation alternative. Because the transportation cost ̃𝑐𝑖𝑗𝑘 is fuzzy random variables, the same as the upper level, the suppliers also use expected value operation to deal with the uncertain parameters; the expected transportation cost can be described as ∑𝑖∈Ψ ∑𝑘∈Ω 𝐸[̃𝑐𝑖𝑗𝑘 ]𝑦𝑖𝑗𝑘 . The penalty cost means the loss when the transported units are rejected in the process of examination; it is the product of the unit defect penalty cost, the expected rate of rejected units, and the transportation quantity, that is, CP𝑗 𝐸[̃𝑟𝑖𝑗𝑘 ]𝑦𝑖𝑗𝑘 . Hence the objective function for supplier 𝑗 can be described as 𝑖𝑗𝑘
} { Pr { ∑ 𝑥𝑖𝑗 ≥ 𝑄𝑖 } ≥ 𝛼, ∀𝑖 ∈ Ψ } {𝑗∈Φ ∀𝑗 ∈ Φ
3.3. Transportation Alternatives Selection for Suppliers. As the lower level decision maker, each supplier can choose transportation alternatives independently, which can affect the delay risk and defect risk on the upper level. Each supplier has multiple transportation alternatives, and each alternative has limited transportation volume. Hence, the suppliers have to distribute the allocated orders to these alternatives. Different transportation alternatives mean different transportation routes, transportation vehicles, transportation risks, and transportation costs. The decision variables for suppliers are 𝑦𝑖𝑗𝑘 .
min 𝐸 [𝑇𝑐𝑗 ] = ∑ ∑ 𝐸 [̃𝑐𝑖𝑗𝑘 ] 𝑦𝑖𝑗𝑘 𝑦
𝑖∈Ψ 𝑗∈Φ 𝑘∈Ω
∑ 𝑥𝑖𝑗 ≤ 𝑆𝑗 ,
the lower level decision makers). The construction company has to consider the possible reactions of the suppliers before choosing the optimal decision. The transportation alternatives selection model (i.e., the lower level model) is discussed in the following.
∀𝑖 ∈ Ψ
𝑗∈Φ
𝑥𝑖𝑗
≤ 𝑧𝑖𝑗 ≤ 𝑥𝑖𝑗 , ∀𝑖 ∈ Ψ, 𝑗 ∈ Φ 𝑀 𝑥𝑖𝑗 ≥ 0, 𝑧𝑖𝑗 ∈ {0, 1} , ∀𝑖 ∈ Ψ, 𝑗 ∈ Φ, where 𝑦𝑖𝑗𝑘 is solved in the lower level model. It should be noted that the decision making of the construction company (i.e., the upper level decision maker) is influenced by the decisions made by suppliers (i.e.,
3.3.2. Constraints on Transportation Alternatives Selection. There are three types of constraints for the transportation alternatives selection on the lower level that must be considered. (1) Supply Constraints. For each supplier 𝑗, the total delivered quantity ∑𝑘∈Ω 𝑦𝑖𝑗𝑘 to each demand node 𝑖 from all the alternatives must exceed the allocated order quantity 𝑥𝑖𝑗 for this demand node. If the allocated order quantity 𝑥𝑖𝑗 is 0, then ∑𝑘∈Ω 𝑦𝑖𝑗𝑘 should also be 0; by introducing a great number 𝑀, we can have the following constraints: 𝑥𝑖𝑗 ≤ ∑ 𝑦𝑖𝑗𝑘 ≤ 𝑀𝑥𝑖𝑗 , ∀𝑖 ∈ Ψ, 𝑗 ∈ Φ. 𝑘∈Ω
(11)
(2) Transportation Capacity Constraints. For each supplier 𝑗, the total delivered quantity ∑𝑖∈Ψ 𝑦𝑖𝑗𝑘 of transportation
8
Mathematical Problems in Engineering
alternative 𝑘 to all demand nodes cannot exceed the transportation capacity of transportation alternative 𝑘; thus we have the following constraints: ∑ 𝑦𝑖𝑗𝑘 ≤ TP𝑗𝑘 , ∀𝑗 ∈ Φ, 𝑘 ∈ Ω.
(12)
𝑖∈Ψ
(3) Delay Rate Constraints. In current competitive business world, for sustainable business, each supplier will often set highest delay rate to gain a good performance evaluation. In the considered problem, the average percentage of late delivered units from suppler 𝑗 to demand node 𝑖 cannot ̃ exceed the highest delay rate; that is, ∑𝑘∈Ω 𝐸[𝑙𝑖𝑗𝑘 ]𝑦𝑖𝑗𝑘 /𝑥𝑖𝑗 ≤ max 𝑙𝑗 . However, in this equation, 𝑥𝑖𝑗 may take the value of 0; after conversation, we can get the following constraints: ̃ ∑ 𝐸 [𝑙𝑖𝑗𝑘 ] 𝑦𝑖𝑗𝑘 ≤ 𝑙𝑗max 𝑥𝑖𝑗 , ∀𝑖 ∈ Ψ, 𝑗 ∈ Φ.
𝑘∈Ω
(13)
From the descriptions above, based on the objective of transportation cost minimization, by synthesizing supply constraints, transportation capacity constraints, and delay rate constraints, we can obtain the lower level model (LLM) for suppliers: (LLM) 𝐸 [𝑇𝑐𝑗 ] min 𝑦 𝑖𝑗𝑘
= ∑ ∑ 𝐸 [̃𝑐𝑖𝑗𝑘 ] 𝑦𝑖𝑗𝑘 + ∑ ∑ CP𝑗 𝐸 [̃𝑟𝑖𝑗𝑘 ] 𝑦𝑖𝑗𝑘 , 𝑖∈Ψ 𝑘∈Ω
𝑖∈Ψ 𝑘∈Ω
∀𝑗 ∈ Φ s.t.
𝑥𝑖𝑗 ≤ ∑ 𝑦𝑖𝑗𝑘 ≤ 𝑀𝑥𝑖𝑗 , ∀𝑖 ∈ Ψ, 𝑗 ∈ Φ 𝑘∈Ω
∑ 𝑦𝑖𝑗𝑘 ≤ TP𝑗𝑘 ,
(14)
∀𝑗 ∈ Φ, 𝑘 ∈ Ω
𝑖∈Ψ
̃ ∑ 𝐸 [𝑙𝑖𝑗𝑘 ] 𝑦𝑖𝑗𝑘 ≤ 𝑙𝑗max 𝑥𝑖𝑗 , ∀𝑖 ∈ Ψ, 𝑗 ∈ Φ
𝑘∈Ω
𝑦𝑖𝑗𝑘 ≥ 0,
min
𝑥𝑖𝑗 ,𝑧𝑖𝑗
s.t.
∀𝑖 ∈ Ψ, 𝑗 ∈ Φ, 𝑘 ∈ Ω.
It should be noted that the suppliers’ decision making is based on the decision made by the construction company. Moreover, the suppliers’ decision making also brings influences to the upper level’s decision making because different transportation alternatives mean different risks. 3.4. Global Model for Bilevel Order Quantity Allocation Problem. In the uncertain bilevel multiobjective order quantity allocation problem, there are two levels of decision makers: construction company (purchaser on the upper level) and material suppliers (vendors on the lower level). The construction company on the upper level will allocate order quantity among multiple suppliers for multiple demand nodes with the objectives of total purchase cost minimization, total delay risk minimization, and total defect risk minimization under constraints on requirement, supply capacity, order quantity, budget, and logicality conditions. The suppliers on the lower level select transportation alternatives for each pair from suppliers to demand nodes based on their own transportation and penalty costs objectives under constraints on supply, transportation capacity, and delay rate. Usually, the objectives of decision makers on two levels conflict. The decision maker on the upper level attempts to minimize the delay risk and defect risk. However, both the two types of risks are related to the transportation alternatives which are determined by suppliers on the lower level. Unfortunately, suppliers always take their own minimal costs (including transportation cost and penalty cost) as their objectives instead of considering the risk, and transportation alternatives with low cost may bring high risk. In this situation, the decision maker on the upper level has to consider the possible reactions of decision makers on the lower level before choosing the optimal decision. Thus a bilevel model is proposed. In the model, the decision maker on the upper level first decides on a feasible order quantity allocation scheme, and then the decision makers on the lower level select their transportation alternatives for each pair from suppliers to demand nodes in turn. By means of this method, they hope to obtain an optimal Stackelberg solution. Based on the above equations, (9) and (14), the following global model for the bilevel multiobjective programming can now be formulated for the order quantity allocation problem:
̃ (TC, 𝐸 [TL] , 𝐸 [TR]) = (∑ ∑ 𝑃𝑗 𝑥𝑖𝑗 + ∑ ∑ 𝐶𝑖𝑗 𝑧𝑖𝑗 , ∑ ∑ ∑ 𝐸 [𝑙𝑗𝑘 ] 𝑦𝑖𝑗𝑘 , ∑ ∑ ∑ 𝐸 [̃𝑟𝑗𝑘 ] 𝑦𝑖𝑗𝑘 ) 𝑖∈Ψ 𝑗∈Φ
} { Pr { ∑ 𝑥𝑖𝑗 ≥ 𝑄𝑖 } ≥ 𝛼, ∀𝑖 ∈ Ψ } {𝑗∈Φ ∑ 𝑥𝑖𝑗 ≤ 𝑆𝑗 ,
∀𝑗 ∈ Φ
𝑖∈Ψ
∑ 𝑥𝑖𝑗 ≥ MO𝑗 , ∀𝑗 ∈ Φ
𝑖∈Ψ
∑ 𝑃𝑗 𝑥𝑖𝑗 + ∑ 𝐶𝑖𝑗 𝑧𝑖𝑗 ≤ 𝐵𝑗 ,
𝑗∈Φ
𝑗∈Φ
∀𝑖 ∈ Ψ
𝑖∈Ψ 𝑗∈Φ
𝑖∈Ψ 𝑗∈Φ 𝑘∈Ω
𝑖∈Ψ 𝑗∈Φ 𝑘∈Ω
Mathematical Problems in Engineering 𝑥𝑖𝑗 𝑀
9
≤ 𝑧𝑖𝑗 ≤ 𝑥𝑖𝑗 , ∀𝑖 ∈ Ψ, 𝑗 ∈ Φ
𝑥𝑖𝑗 ≥ 0, 𝑧𝑖𝑗 ∈ {0, 1} , ∀𝑖 ∈ Ψ, 𝑗 ∈ Φ min 𝐸 [𝑇𝑐𝑗 ] = ∑ ∑ 𝐸 [̃𝑐𝑖𝑗𝑘 ] 𝑦𝑖𝑗𝑘 + ∑ ∑ CP𝑗 𝐸 [̃𝑟𝑖𝑗𝑘 ] 𝑦𝑖𝑗𝑘 , 𝑦 𝑖𝑗𝑘
s.t.
𝑖∈Ψ 𝑘∈Ω
∀𝑗 ∈ Φ
𝑖∈Ψ 𝑘∈Ω
𝑥𝑖𝑗 ≤ ∑ 𝑦𝑖𝑗𝑘 ≤ 𝑀𝑥𝑖𝑗 , ∀𝑖 ∈ Ψ, 𝑗 ∈ Φ 𝑘∈Ω
∑ 𝑦𝑖𝑗𝑘 ≤ TP𝑗𝑘 ,
∀𝑗 ∈ Φ, 𝑘 ∈ Ω
𝑖∈Ψ
̃ ∑ 𝐸 [𝑙𝑖𝑗𝑘 ] 𝑦𝑖𝑗𝑘 ≤ 𝑙𝑗max 𝑥𝑖𝑗 , ∀𝑖 ∈ Ψ, 𝑗 ∈ Φ
𝑘∈Ω
𝑦𝑖𝑗𝑘 ≥ 0,
∀𝑖 ∈ Ψ, 𝑗 ∈ Φ, 𝑘 ∈ Ω. (15)
4. Proposed Solution Method In order to obtain Stackelberg solutions to a bilevel programming model, many methods have been proposed. They can be classified roughly into three categories: the vertex enumeration approach, the Kuhn-Tucker approach, and the penalty function approach [29]. Among them, the KuhnTucker approach is most widely used if the objective functions of the lower level model are continuous and differentiable.
min
𝑥𝑖𝑗 ,𝑧𝑖𝑗
s.t.
4.1. Kuhn-Tucker Conditions. In the considered problem, all decision variables on the lower level are continuous and the objective functions are differentiable. Hence, we can use Kuhn-Tucker conditions to transform the lower level model into constraint conditions of the upper level model. In the Kuhn-Tucker approach, the upper level decision maker’s problem with constraints involving the optimality conditions of the lower level decision makers’ problems is solved. By 3 5 , 𝑢𝑖𝑗4 , and 𝑢𝑖𝑗𝑘 , the introducing auxiliary variables 𝑢𝑖𝑗1 , 𝑢𝑖𝑗2 , 𝑢𝑗𝑘 Kuhn-Tucker conditions of model (15) can be shown as follows:
̃ (TC, 𝐸 [TL] , 𝐸 [TR]) = (∑ ∑ 𝑃𝑗 𝑥𝑖𝑗 + ∑ ∑ 𝐶𝑖𝑗 𝑧𝑖𝑗 , ∑ ∑ ∑ 𝐸 [𝑙𝑗𝑘 ] 𝑦𝑖𝑗𝑘 , ∑ ∑ ∑ 𝐸 [̃𝑟𝑗𝑘 ] 𝑦𝑖𝑗𝑘 ) 𝑖∈Ψ 𝑗∈Φ
𝑖∈Ψ 𝑗∈Φ
𝑖∈Ψ 𝑗∈Φ 𝑘∈Ω
𝑖∈Ψ 𝑗∈Φ 𝑘∈Ω
} { Pr { ∑ 𝑥𝑖𝑗 ≥ 𝑄𝑖 } ≥ 𝛼, ∀𝑖 ∈ Ψ } {𝑗∈Φ ∑ 𝑥𝑖𝑗 ≤ 𝑆𝑗 ,
∀𝑗 ∈ Φ
𝑖∈Ψ
∑ 𝑥𝑖𝑗 ≥ MO𝑗 , ∀𝑗 ∈ Φ
𝑖∈Ψ
∑ 𝑃𝑗 𝑥𝑖𝑗 + ∑ 𝐶𝑖𝑗 𝑧𝑖𝑗 ≤ 𝐵𝑗 ,
𝑗∈Φ
𝑥𝑖𝑗 𝑀
∀𝑖 ∈ Ψ
𝑗∈Φ
≤ 𝑧𝑖𝑗 ≤ 𝑥𝑖𝑗 , ∀𝑖 ∈ Ψ, 𝑗 ∈ Φ
3 5 + 𝑢𝑖𝑗4 − 𝑢𝑖𝑗𝑘 = 0, ∀𝑖 ∈ Ψ, 𝑗 ∈ Φ, 𝑘 ∈ Ω 𝐸 [̃𝑐𝑖𝑗𝑘 ] + CP𝑗 𝐸 [̃𝑟𝑖𝑗𝑘 ] − 𝑢𝑖𝑗1 + 𝑢𝑖𝑗2 + 𝑢𝑗𝑘
𝑢𝑖𝑗1 ( ∑ 𝑦𝑖𝑗𝑘 − 𝑥𝑖𝑗 ) = 0,
∀𝑖 ∈ Ψ, 𝑗 ∈ Φ
𝑘∈Ω
𝑢𝑖𝑗2 ( ∑ 𝑦𝑖𝑗𝑘 − 𝑀𝑥𝑖𝑗 ) = 0, 𝑘∈Ω
∀𝑖 ∈ Ψ, 𝑗 ∈ Φ
10
Mathematical Problems in Engineering 3 𝑢𝑗𝑘 (∑ 𝑦𝑖𝑗𝑘 − TP𝑗𝑘 ) = 0, ∀𝑗 ∈ Φ, 𝑘 ∈ Ω 𝑖∈Ψ
̃ 𝑢𝑖𝑗4 ( ∑ 𝐸 [𝑙𝑖𝑗𝑘 ] 𝑦𝑖𝑗𝑘 − 𝑙𝑗max 𝑥𝑖𝑗 ) = 0,
∀𝑖 ∈ Ψ, 𝑗 ∈ Φ
𝑘∈Ω
5 𝑦𝑖𝑗𝑘 = 0, ∀𝑖 ∈ Ψ, 𝑗 ∈ Φ, 𝑘 ∈ Ω 𝑢𝑖𝑗𝑘
𝑥𝑖𝑗 ≤ ∑ 𝑦𝑖𝑗𝑘 ≤ 𝑀𝑥𝑖𝑗 , ∀𝑖 ∈ Ψ, 𝑗 ∈ Φ 𝑘∈Ω
∑ 𝑦𝑖𝑗𝑘 ≤ TP𝑗𝑘 ,
∀𝑗 ∈ Φ, 𝑘 ∈ Ω
𝑖∈Ψ
̃ ∑ 𝐸 [𝑙𝑖𝑗𝑘 ] 𝑦𝑖𝑗𝑘 ≤ 𝑙𝑗max 𝑥𝑖𝑗 , ∀𝑖 ∈ Ψ, 𝑗 ∈ Φ
𝑘∈Ω
3 5 𝑥𝑖𝑗 ≥ 0, 𝑦𝑖𝑗𝑘 ≥ 0, 𝑢𝑖𝑗1 , 𝑢𝑖𝑗2 , 𝑢𝑗𝑘 , 𝑢𝑖𝑗4 , 𝑢𝑖𝑗𝑘 ≥ 0, 𝑧𝑖𝑗 ∈ {0, 1} , ∀𝑖 ∈ Ψ, 𝑗 ∈ Φ, 𝑘 ∈ Ω.
(16)
It can be seen that the bilevel multiobjective model has been transformed into an equivalent single-level multiobjective mathematical programming model through the KuhnTucker approach.
time, taking the weight of each objective into consideration, the goal for the model can be transformed to maximize the weight-sum satisfaction degree, so the above model can be converted into the following satisfaction model: 3
4.2. Satisfaction Function. Although the bilevel model (15) has been transformed into a single model (16) through KuhnTucker conditions, it is still difficult to solve the problem because of the multiple objectives. In order to handle the multiple objective functions and integrate the attitude of decision maker, we propose a weight-sum satisfaction method below. As the three objectives of the upper level of model (16) are minimum problems, for any feasible solution (x, y, z, u) ∈ Λ, the degree of satisfaction for each objective can be calculated using the following equation: 𝑆𝑡 (x, y, z, u) 1, 𝐹𝑡 (x, y, z, u) < 𝐹𝑡min { { { { (17) max { = { 𝐹𝑡 (x, y, z, u) − 𝐹𝑡 , 𝐹min ≤ 𝐹 (x, y, z, u) < 𝐹max 𝑡 𝑡 𝑡 { { 𝐹𝑡min − 𝐹𝑡max { { 0, 𝐹𝑡 (x, y, z, u) ≥ 𝐹𝑡max , {
where 𝐹𝑡 , 𝑡 = 1, 2, 3, each separately represent the three objective functions on the upper level and 𝐹𝑡min , 𝐹𝑡max represent the minimal value and maximal value, respectively. Once a feasible solution is produced, the above equation can be used to calculate degree of satisfaction for each objective. Usually, decision makers will determine lowest satisfaction of each objective in advance, named as 𝑆𝑡min . Then the following constraints must be satisfied when making decision: 𝑆𝑡 (𝐹𝑡 (x, y, z, u)) ≥ 𝑆𝑡min , ∀𝑡 = 1, 2, 3.
(18)
In this situation, decision makers always hope to seek for a solution with maximal satisfaction degree. At the same
max
(x,y,z,u)
s.t.
𝐹 (x, y, z, u) = ∑𝑤𝑡 𝑆𝑡 (𝐹𝑡 (x, y, z, u)) 𝑡=1
𝑆𝑡 (𝐹𝑡 (x, y, z, u)) ≥ 𝑆𝑡min , ∀𝑡 = 1, 2, 3
(19)
(x, y, z, u) ∈ Λ, where 𝑤𝑡 is the weight of the 𝑡th objective which meets 𝑤1 + 𝑤2 + 𝑤3 = 1 and Λ is the feasible region of model (16). It can be seen that, through the operation of satisfaction function, the multiobjective model (16) has been transformed into a single-objective model. 4.3. Sectional Genetic Algorithm Based on Uncertain Simulation. Although model (19) is only a single-objective and single-level model, it is still difficult to solve the problem using a commercial solver because of too many decision variables and constraints. For example, in a decision making process, there are 10 demand nodes, 20 suppliers, and 3 transportation alternatives for each supplier; then 1860 decision variables and 4443 constraints must be considered. Moreover, some nonlinear constraints and uncertain objectives also increase the difficulty to solve the model. In this situation, a sectional genetic algorithm based on fuzzy random simulation is introduced here to solve the model (19). 4.3.1. Uncertain Simulation. In the proposed model, the uncertain operation mainly means the expected value operation of the fuzzy random objective, which actually is a weightsum function and can be described as the following equation: 3
𝑤𝑡 (𝐹𝑡 (x, y, z, u) − 𝐹𝑡max ) , 𝐹𝑡min − 𝐹𝑡max 𝑡=1
𝐹 (x, y, z, u) = ∑
(20)
Mathematical Problems in Engineering Decision variables for upper level
Decision variables for lower level
xij ≥ 0
x11
···
11
Auxiliary variables 3 5 uij1 , uij2 , ujk , uij4 , uijk ≥0
yijk ≥ 0
xIJ y111
1 · · · yIJK u11
···
1 uIJ
2 ··· u11
2 ··· u11
2 uIJ
3 u11
···
3 4 ··· uJK u11
4 uIJ
5 ··· u111
5 uIJK
Figure 3: Real number string structure of floating-point sectional representation.
where 𝐹1
∑𝑖∈Ψ ∑𝑗∈Φ 𝑃𝑗 𝑥𝑖𝑗 + ∑𝑖∈Ψ ∑𝑗∈Φ 𝐶𝑖𝑗 𝑧𝑖𝑗 , 𝐹2 = ̃ and 𝐹3 = ∑𝑖∈Ψ ∑𝑗∈Φ ∑𝑘∈Ω 𝐸[𝑙𝑗𝑘 ]𝑦𝑖𝑗𝑘 ̃ 𝐸[𝑟 ]𝑦 . In the second and third functions, ∑ ∑ ∑ 𝑖∈Ψ
𝑗∈Φ
=
𝑘∈Ω
𝑗𝑘
𝑖𝑗𝑘
the expected values of fuzzy random variables (𝐸[TL] and 𝐸[TR]), which are very difficult to be accurately calculated, are included. Hence the following fuzzy random simulation is proposed. ̃ Step 1. Let 𝑛 = 1, 𝐹min = −∞, 𝑓(𝑙𝑗𝑘 , ̃𝑟𝑗𝑘 ) ∑3𝑡=1 (𝑤𝑡 (𝐹𝑡 (x, y, z, u) − 𝐹𝑡max )/(𝐹𝑡min − 𝐹𝑡max )).
=
Step 2. Generate 𝜔 from Ω according to the probability ̃ measure Pr of the fuzzy random variables 𝑙𝑗𝑘 , ̃𝑟𝑗𝑘 . ̃ Step 3. Generate a determined vector 𝑓(𝑙𝑗𝑘 (𝜔), ̃𝑟𝑗𝑘 (𝜔)) unĩ formly from the 𝛼-cut of fuzzy vector 𝑓(𝑙𝑗𝑘 (𝜔), ̃𝑟𝑗𝑘 (𝜔)). ̃ Step 4. If 𝑓(𝑙𝑗𝑘 (𝜔), ̃𝑟𝑗𝑘 (𝜔)) ≥ 𝐹min𝑛 , then let 𝐹min = ̃ 𝑓(𝑙𝑗𝑘 (𝜔), ̃𝑟𝑗𝑘 (𝜔)). Return to Step 3, and repeat 𝑀 times. Step 5. If 𝑛 = 𝑁, set 𝑁 = 𝛽𝑁 and return the 𝑁 th greatest element in {𝐹min1 , 𝐹min2 , . . . , 𝐹min𝑁} as the fitness value; else go to Step 2, and 𝑛 = 𝑛 + 1. 4.4. Sectional Genetic Algorithm. As mentioned above, the proposed model is a nonlinear programming model. It is always with high time complexity and easy to fall into local optimum using traditional algorithms. Hence, the genetic algorithm, which has good performance in global search, is suggested to solve this model. Moreover, according to the characteristics of the model, a sectional chromosome representation and a sectional evolution operation are also proposed. 4.4.1. Sectional Chromosome Representation. The solution of model (19) consists of four parts (x, y, z, u), where z can be determined in accordance with x. Therefore, the solution can be expressed as (x, y, u). As is known, the x, y, and u have different meanings and value ranges. So we suggest representing the solution using a chromosome with three sections as Figure 3. Thus each gene is expressed as a floatingpoint number since these variables are nonnegative real numbers.
4.4.2. Sectional Crossover and Mutation Operation. For each chromosome consists of three parts, the genetic crossover operations are also divided as three sections. Each section has an independent crossover probability. Let the crossover probabilities for three sections be 𝑝𝑐1 , 𝑝𝑐2 , and 𝑝𝑐3 . It is assumed that 𝑃(𝑠)1 = (x1 , y1 , u1 ), 𝑃(𝑠)2 = (x2 , y2 , u2 ) are two parent chromosomes and 𝐶(𝑠)1 , 𝐶(𝑠)2 are the corresponding offspring chromosomes. Then the crossover operation is as follows: 0} x2 } x1 } { { { } { } { { } { } } { { 1} 1 𝐶 (𝑠) = 𝑎 { 0 } + (1 − 𝑎) { 0 } + 𝑏 {y } } { } { { { } } { } { } 0 0 { } { } {0} 0} 0} { { { { { 2} } } { } + (1 − 𝑏) {y } + 𝑐 { 0 } { { { } } } { 1} 0 { } {u } 0} { { { } } + (1 − 𝑐) { 0 } { } } { 2 {u }
(21)
0} x1 } x2 } { { { { } } { { { } } { 1} } { 2 𝐶 (𝑠) = (1 − 𝑎) { 0 } + 𝑎 { 0 } + (1 − 𝑏) {y } { } } { { { } { } } { } 0 0 { } {0} { } 0} 0} 0} { { { { { { } } } { } { 2} { } + 𝑏 {y } + (1 − 𝑐) { 0 } + 𝑐 { 0 } , { { { } } } { 1} { } { 2} 0 u { } { } {u } where 𝑎, 𝑏, and 𝑐 are random numbers between 0 and 1, which meet the inequalities 𝑎 < 𝑃𝑐1 , 𝑏 < 𝑃𝑐2 , and 𝑐 < 𝑃𝑐3 . Similarly, the chromosome mutation is also carried out with a three-stage operation. Set the three mutation probabilities as 𝑝𝑚1 , 𝑝𝑚2 , and 𝑝𝑚3 , respectively. From left to right, successively produce random numbers 𝑟1 , 𝑟2 , and 𝑟3 (∈ [0, 1]) in each gene position. If 𝑟1 ≤ 𝑝𝑚1 , 𝑟2 ≤ 𝑝𝑚2 , and 𝑟3 ≤ 𝑝𝑚3 , then replace the gene using a new randomly generated gene. 4.4.3. Framework of the Sectional Genetic Algorithm. In summary, the main steps of proposed sectional genetic algorithm are as follows.
12
Mathematical Problems in Engineering Table 1: Parameters of demand nodes. Demand quantity (103 ton) 𝑁(2.24, 0.12) 𝑁(1.56, 0.14) 𝑁(1.42, 0.22) 𝑁(5.58, 0.24) 𝑁(3.24, 0.18) 𝑁(1.36, 0.10) 𝑁(1.24, 0.08)
Nodes Number 1 Number 2 Number 3 Number 4 Number 5 Number 6 Number 7
Total budget (105 CNY) 22.6 16.8 14.7 58.8 28.6 18.6 14.2
Step 1. Initialize the genetic algorithm operation parameters, including population size pop size, crossover probability 𝑝𝑐 = (𝑝𝑐1 , 𝑝𝑐2 , 𝑝𝑐3 ), mutation probability 𝑝𝑚 = (𝑝𝑚1 , 𝑝𝑚2 and 𝑝𝑚3 ), and maximal iterations 𝑆. Step 2. Set 𝑠 = 0, and initialize genetic population 𝑃(𝑠). Step 2.1. Generate x randomly in [0, 𝑥𝑖𝑗 ]. Step 2.2. Generate y randomly in [0, min{𝑥𝑖𝑗 , TP𝑗𝑘 }]. Step 2.3. Generate u randomly in [0, 𝐸[̃𝑐𝑖𝑗𝑘 ]]. Step 2.4. Check whether or not 𝑃(𝑠) meets all constraints; if not, repeat the above operation until all constraints are met. Step 3. Calculate the fitness value of each chromosome using fuzzy random simulation procedures. In this paper, the objective function of model (19) is considered as the fitness function of genetic algorithm. That is, 3
𝑤𝑡 (𝐹𝑡 (x, y, z, u) − 𝐹𝑡max ) . 𝐹𝑡min − 𝐹𝑡max 𝑡=1
Fitness = ∑
(22)
Step 4. Calculate the selection probability po of ℎth chromosome 𝑝ℎ (ℎ = 1, 2, . . . , pop size) and choose the chromosome using wheel selection method to build a new population 𝑃(𝑠) , while 𝑝ℎ is calculated by the following equation: 𝑝ℎ =
Fitness (𝑃ℎ (𝑠)) pop size ∑ℎ=1
fitness (𝑃ℎ (𝑠))
.
(23)
Step 5. Produce offspring chromosomes from parent chromosomes using the sectional crossover and mutation operation. Check whether or not all constraints are met. If not, regenerate offspring chromosomes. Step 6. If 𝑠 > 𝑆, end the process; or set 𝑃(𝑠) = 𝐶(𝑠), 𝑠 = 𝑠 + 1, and return to Step 3.
5. Case Study In the following, a practical example in China is introduced to demonstrate the complete modelling and algorithm process.
Suppliers Numbers 1, 2, 3 Numbers 1, 2, 3 Numbers 4, 5, 6, 7 Numbers 1, 3, 4, 5, 6, 7 Numbers 8, 9, 10, 11, 12 Numbers 8, 9, 10 Numbers 10, 11, 12
Order cost (105 CNY) 1.8, 2.6, 2.2 2.2, 2.1, 2.6 2.2, 2.6, 1.6, 1.5 1.8, 1.6, 2.2, 2.6, 2.2, 1.9 1.8, 2.2, 2.2, 1.9, 2.1 1.4, 2.6, 2.2 1.8, 2.6, 2.2
5.1. Presentation of Case Problem. The Shuibuya hydropower project is located in Badong County in the middle reaches of the Qingjiang River. It is the first cascaded project on the Qingjiang mainstream. At 233 m height and containing 15,640,000 m3 of material, it is the tallest concrete face rockfill dam in the world. For constructing the project, huge amounts of construction material are consumed every day. Taking cement as example, more than 2 thousand tons is used per day on average. Due to the very big demand quantity, it is impossible to purchase the cement from one supplier. Hence, in practice, multiple suppliers have been selected to supply the cement. Meanwhile, for convenience of storage and usage, the construction company has built seven storehouses to store the cement. Hence, there are multiple demand nodes and multiple suppliers for cement purchasing in the construction project. Now, according to the demand information, the construction company needs to purchase about 14 thousand tons’ cement in the next week. Then the problem the construction company currently faces is how to allocate the purchased quantity among multiple suppliers for multiple demand nodes. In this section, we will discuss the order quantity allocation problem of cement in Shuibuya hydropower project. It is assumed that there are 7 demand nodes and 12 suppliers. Each supplier has three types of trucks: light truck, medium truck, and heavy truck. Different types of trucks will lead to different transportation alternatives, transportation costs, and transportation risks. The positions of the demand nodes and the related links between the demand nodes and suppliers are illustrated in Figure 4. The data on demand nodes are shown in Table 1 and the data on suppliers are stated in Table 2. Because of the uncertain environment of order quantity allocation and the information asymmetry between the construction company and cement suppliers, the data on transportation cost, percentage of late delivered units, and percentage of rejected units are modeled as triangular fuzzy random variables. In the considered case, the different transportation alternatives means different transportation vehicles. For each pair from one supplier to one demand node, the unit transportation cost and risk are linearly dependent on the transportation distance. Hence, the coefficients ̃𝑐 can be split into two parts: ̃𝑐 : unit transportation 𝑖𝑗𝑘 𝑗𝑘 cost of supplier 𝑗 using transportation alternative 𝑘 and 𝑑𝑖𝑗 :
Mathematical Problems in Engineering
13 Table 2: Parameters of suppliers (part 1).
Capacity (103 ton) 1.84 2.36 2.65 1.28 1.46 2.24 1.96 1.62 1.48 1.88 1.24 1.53
Suppliers Number 1 Number 2 Number 3 Number 4 Number 5 Number 6 Number 7 Number 8 Number 9 Number 10 Number 11 Number 12
Supplier 1Supplier 2
Price (103 CNY/ton) 0.64 0.60 0.61 0.61 0.62 0.62 0.60 0.62 0.62 0.59 0.62 0.62
Supplier 4 Supplier 6
Supplier 3
Supplier 7 Supplier 5
1
3 7
2
4 5 Supplier 11
6
Supplier 12
Supplier 10 Supplier 8
Demanded node Supplier
Supplier 9
Transportation
Figure 4: Order quantity allocation of cement in Shuibuya hydropower project.
transportation distance from supplier 𝑗 to demand node 𝑖. The detailed data on ̃𝑐𝑗𝑘 are stated in Table 3. 5.2. Computation Results. In order to run the program for the proposed SGA algorithm, the algorithm parameters for the case problem were set as follows: population size pop size = 40; iteration number 𝑆 = 500; three segmental probabilities of crossover 𝑝𝑐1 = 0.7, 𝑝𝑐2 = 0.5, and 𝑝𝑐3 = 0.3; and three mutation probabilities 𝑝𝑚1 = 0.2, 𝑝𝑚2 = 0.1, and 𝑝𝑚3 = 0.05. After 4.574 minutes on average, the optimal solutions of model (16) were determined with fitness value of 0.734. Figure 5 shows the optimal order quantity allocation scheme and selected transportation alternatives. Based on this results, it is easy to calculate the values of the three objectives. The total purchase cost is 12.61 million yuan while the total delay risk and total defect risk are 265 and 325, respectively. From the results, it can be seen that most of demand nodes
Penalty cost (103 CNY/ton) 0.51 0.48 0.49 0.49 0.50 0.51 0.48 0.51 0.52 0.47 0.50 0.50
Minimal order (103 tons) 0.80 1.20 1.80 0.70 0.75 1.20 0.85 0.80 0.60 1.40 0.70 0.40
Maximal late rate (%) 8.4 8.6 8.2 8.6 8.2 8.8 7.6 7.8 8.4 7.8 8.2 8.0
need multiple suppliers to provide material. Meanwhile, some suppliers are also supplying material for multiple demand nodes, which reflects that it is meaningful to consider the transportation alternatives on the lower level. 5.3. Model Analysis. In this paper, we study a multidemand multisource order quantity allocation problem using a bilevel multiobjective programming. Traditionally, the order quantity allocation problem is considered as a single-level model. To test the significance of the proposed model, a comparison between the bilevel model and single-level model is conducted. At the same time, the interactivity between the models and objectives are also considered. The results are shown in Table 4. From the results in Table 4, it can be seen that the solutions of the bilevel and single-level models are very near only if the objective of total cost minimization is considered. However, once we consider the risk objectives, the single-level model can always obtain better objective values for the upper level, which seems like the single-level model is better than the bilevel. Nevertheless it is not true. Let us consider the case of 𝑤1 = 0.5, 𝑤2 = 0.3, and 𝑤3 = 0.2. Compared to the bilevel model, the total cost of the upper level is decreased to 12.47 from 12.61 with a decrement of 0.15. However, at the same time, the total transportation and penalty costs of the lower level are increased to 2.31 from 2.01 with an increment of 0.3. Obviously, relative to the bilevel model, the suppliers have to expend higher costs which even exceeds the increased income of purchaser if the single-level model is used. As a result, the suppliers have to raise the price, which may reduce the stability of the supply chain. Moreover, the administrative cost will also be increased if the purchaser takes charge of the selection of transportation alternatives. Hence, it is meaningful to consider the order quantity allocation problem using a bilevel model. In addition, the relationship among the objectives should also be discussed. Figure 6 describes the trend lines of the three objectives of upper level model and the sum of lower level’s objectives. It can be seen that the delay risk has a positive correlation with defect risk and a negative correlation
14
Mathematical Problems in Engineering
Table 3: Parameters of suppliers (part 2). Supplier
Alternative 1
1
2 3 1
2
2 3 1
3
2 3 1
4
2 3 1
5
2 3 1
6
2 3 1
7
2 3 1
8
2 3
̃𝑐 (CNY/TN⋅KM) 𝑗𝑘 (3.75, 𝑐, 4.22) 𝑐 ∼ N(3.85, 0.05) (4.82, 𝑐, 5.16) 𝑐 ∼ N(4.96, 0.04) (2.75, 𝑐, 3.46) 𝑐 ∼ N(3.22, 0.02) (3.76, 𝑐, 4.59) 𝑐 ∼ N(4.12, 0.04) (3.98, 𝑐, 4.64) 𝑐 ∼ N(4.26, 0.02) (4.50, 𝑐, 4.99) 𝑐 ∼ N(4.82, 0.02) (4.28, 𝑐, 4.75) 𝑐 ∼ N(4.42, 0.02) (4.35, 𝑐, 5.16) 𝑐 ∼ N(4.71, 0.04) (3.62, 𝑐, 4.11) 𝑐 ∼ N(3.80, 0.03) (4.65, 𝑐, 5.34) 𝑐 ∼ N(4.97, 0.05) (3.81, 𝑐, 4.31) 𝑐 ∼ N(3.96, 0.03) (3.02, 𝑐, 3.76) 𝑐 ∼ N(3.38, 0.04) (3.05, 𝑐, 3.90) 𝑐 ∼ N(3.42, 0.08) (3.65, 𝑐, 4.04) 𝑐 ∼ N(3.68, 0.03) (3.47, 𝑐, 4.06) 𝑐 ∼ N(3.66, 0.04) (4.50, 𝑐, 4.86) 𝑐 ∼ N(4.73, 0.02) (4.29, 𝑐, 4.70) 𝑐 ∼ N(4.53, 0.03) (4.15, 𝑐, 4.46) 𝑐 ∼ N(4.30, 0.03) (3.97, 𝑐, 4.64) 𝑐 ∼ N(4.15, 0.05) (4.25, 𝑐, 4.91) 𝑐 ∼ N(4.64, 0.06) (3.38, 𝑐, 3.71) 𝑐 ∼ N(3.44, 0.03) (3.52, 𝑐, 4.21) 𝑐 ∼ N(3.84, 0.06) (3.77, 𝑐, 4.41) 𝑐 ∼ N(4.14, 0.02) (3.61, 𝑐, 3.99) 𝑐 ∼ N(3.80, 0.02)
̃ 𝑙𝑗𝑘 (%) (7.79, 𝑙, 8.47) 𝑙 ∼ N(8.04, 0.12) (7.33, 𝑙, 8.19) 𝑙 ∼ N(7.75, 0.10) (8.07, 𝑙, 9.29) 𝑙 ∼ N(8.54, 0.10) (8.41, 𝑙, 9.57) 𝑙 ∼ N(9.04, 0.10) (8.43, 𝑙, 8.58) 𝑙 ∼ N(8.58, 0.01) (7.20, 𝑙, 7.79) 𝑙 ∼ N(7.48, 0.05) (6.16, 𝑙, 6.73) 𝑙 ∼ N(6.53, 0.04) (8.25, 𝑙, 8.54) 𝑙 ∼ N(8.39, 0.02) (7.50, 𝑙, 8.08) 𝑙 ∼ N(7.88, 0.06) (7.63, 𝑙, 8.47) 𝑙 ∼ N(8.06, 0.1) (9.23, 𝑙, 10.02) 𝑙 ∼ N(9.58, 0.08) (8.39, 𝑙, 9.16) 𝑙 ∼ N(8.68, 0.06) (6.92, 𝑙, 7.62) 𝑙 ∼ N(7.30, 0.05) (6.66, 𝑙, 7.83) 𝑙 ∼ N(7.24, 0.1) (8.25, 𝑙, 9.17) 𝑙 ∼ N(8.74, 0.08) (6.88, 𝑙, 7.82) 𝑙 ∼ N(7.42, 0.10) (6.16, 𝑙, 6.31) 𝑙 ∼ N(6.21, 0.01) (8.89, 𝑙, 9.68) 𝑙 ∼ N(9.12, 0.03) (7.07, 𝑙, 7.83) 𝑙 ∼ N(7.38, 0.03) (7.38, 𝑙, 8.09) 𝑙 ∼ N(7.69, 0.05) (6.92, 𝑙, 7.68) 𝑙 ∼ N(7.26, 0.06) (8.09, 𝑙, 9.38) 𝑙 ∼ N(8.78, 0.10) (5.94, 𝑙, 6.87) 𝑙 ∼ N(6.39, 0.06) (5.82, 𝑙, 6.71) 𝑙 ∼ N(6.26, 0.08)
̃𝑟 (%) 𝑗𝑘 (2.05, 𝑟, 2.34) 𝑟 ∼ N(2.26, 0.02) (2.84, 𝑟, 3.08) 𝑟 ∼ N(2.96, 0.02) (2.45, 𝑟, 2.72) 𝑟 ∼ N(2.61, 0.02) (2.00, 𝑟, 2.32) 𝑟 ∼ N(2.18, 0.01) (2.58, 𝑟, 2.65) 𝑟 ∼ N(2.60, 0.01) (3.45, 𝑟, 3.66) 𝑟 ∼ N(3.57, 0.02) (2.84, 𝑟, 3.08) 𝑟 ∼ N(2.92, 0.02) (3.14, 𝑟, 3.36) 𝑟 ∼ N(3.27, 0.02) (2.81, 𝑟, 3.10) 𝑟 ∼ N(2.94, 0.03) (2.65, 𝑟, 3.02) 𝑟 ∼ N(2.88, 0.04) (3.04, 𝑟, 3.18) 𝑟 ∼ N(3.10, 0.02) (2.65, 𝑟, 2.77) 𝑟 ∼ N(2.71, 0.01) (2.11, 𝑟, 2.56) 𝑟 ∼ N(2.33, 0.03) (1.99, 𝑟, 2.40) 𝑟 ∼ N(2.13, 0.02) (2.36, 𝑟, 2.50) 𝑟 ∼ N(2.43, 0.01) (3.07, 𝑟, 3.48) 𝑟 ∼ N(3.25, 0.03) (3.03, 𝑟, 3.47) 𝑟 ∼ N(3.18, 0.03) (2.03, 𝑟, 2.39) 𝑟 ∼ N(2.24, 0.03) (2.26, 𝑟, 2.65) 𝑟 ∼ N(2.39, 0.02) (2.71, 𝑟, 2.94) 𝑟 ∼ N(2.82, 0.02) (3.09, 𝑟, 3.36) 𝑟 ∼ N(3.17, 0.02) (2.26, 𝑟, 2.43) 𝑟 ∼ N(2.28, 0.02) (2.34, 𝑟, 2.68) 𝑟 ∼ N(2.48, 0.02) (2.50, 𝑟, 2.80) 𝑟 ∼ N(2.65, 0.03)
Mathematical Problems in Engineering
15
Table 4: Comparison analysis to single-level and bilevel model with different objectives. Weight (𝑤1 , 𝑤2 , 𝑤3 ) (1, 0, 0) (0, 1, 0) (0, 0, 1) (0.5, 0.3, 0.2) (0.33, 0.33, 0.33)
Models
Upper level objectives 𝐸[TL] 290 288 240 214 251 236 265 251 263 248
TC 10.53 10.48 14.56 14.43 13.99 13.93 12.61 12.47 13.16 13.01
Bilevel Single-level Bilevel Single-level Bilevel Single-level Bilevel Single-level Bilevel Single-level
0 2 1.85
2 1.85
0.27
1.33
8 1.07
0 0.52
0
0
3 1.86
Index of demanded node 1 Index of supplier 1
1 2.48
0 3 0.64
7 0.65
0.65
0
0.39 0 0 0.64
Purchased quantity
6 1.21
0 0.21
4 6.06
Allocated order quantity for supplier 3
0 1.15
4 1.28
0.86 0.64 0.64 0.8
7 1.31
0 0.60 0.36 0.32
8
0
0
0
0.70
11 0.70
0.65
3 2.01
5 1.46
0
12 0.96
1.0 0.80
1 1.84 1.84
0
0 0.8 0.65 0.22
9 0.87 5 3.60
Transported quantity with 3 alternatives
Lower level objective ∑ 𝐸[Tc𝑗 ] 1.87 1.92 2.31 2.52 2.28 2.47 2.01 2.31 1.95 2.26
𝐸[TR] 343 345 293 274 279 256 325 304 296 278
6 1.56
0
0
0
0.48
10 1.05
0.57 0 0
10 0.83
0 0.66 0.41
0.23
0.55
7 1.40
0 12 0.57
0.9
0.23 0.60 0 0.57
Figure 5: Results on order quantity allocation and transportation alternatives selection.
with the total transportation and penalty costs. The total cost does not specifically relate to any other single objective. The result also shows the necessity to consider multiple objectives, since the other objectives will take very bad values if only a single objective is considered in the model. 5.4. Algorithm Evaluation. To demonstrate the effectiveness and efficiency of the proposed sectional genetic algorithm based on fuzzy random simulation (FRS-SGA), an analysis of
parameter selection and a performance comparison to other algorithms are carried out successively. 5.4.1. Parameter Selection for the FRS-SGA. For genetic algorithm, three types of parameters will observably influence the performance of the algorithm, that is, population size, crossover probability, and mutation probability. Many scholars such as Zouein et al. [30], Dimou and Koumousis [31], and Xu and Yao [32] have given suggestions on the proper
Delay risk Defect risk Total cost Transportation and penalty costs
S(1, 0, 0)
B(1, 0, 0)
B(0.5, 0.3, 0.2)
B(0.33, 0.33, 0.33)
B(0, 0, 1)
S(0.5, 0.3, 0.2)
S(0.33, 0.33, 0.33)
B(0, 1, 0)
S(0, 0, 1)
Mathematical Problems in Engineering
S(0, 1, 0)
16
S: single-level B: bilevel
Figure 6: Relation among the multiple objectives.
Table 5: The parameters selection of the proposed FRS-SGA. pop size 30
40
50
𝑝𝑐1 0.7 0.5 0.3 0.7 0.7 0.5 0.3 0.7 0.7 0.5 0.3 0.7
𝑝𝑐2 0.7 0.5 0.3 0.5 0.7 0.5 0.3 0.5 0.7 0.5 0.3 0.5
𝑝𝑐3 0.7 0.5 0.3 0.3 0.7 0.5 0.3 0.3 0.7 0.5 0.3 0.3
Computing time 4.973 3.592 5.473 3.106 5.933 4.605 4.998 4.574 6.432 5.627 8.283 4.956
Fitness value 0.663 0.679 0.632 0.690 0.671 0.716 0.661 0.734 0.648 0.713 0.659 0.734
parameters. In this paper, the parameters are set from the results of 20 preliminary experiments that were conducted to observe the behavior of the algorithm at different parameter settings. Table 5 shows the experiment result on the parameter of population size and crossover probability. It can be seen that the computing time is extended with the increase of population size. At the same time, compared to the same crossover probability, the proposed sectional one has better performance both in the computing time and in fitness value. We also carried out experiments on the mutation probability and get a similar result to the crossover probability. 5.4.2. Algorithm Comparison. The performances of the proposed FRS-SGA are also compared with the traditional
genetic algorithm based on fuzzy random simulation (FRSGA) and particle swarm optimization based on fuzzy random simulation (FRS-PSO) over 50 experiments using eight different problem sizes. In the experiments, the three algorithms use the same fitness value function which are calculated by fuzzy random simulation in the evolution. The performances of the three algorithms in the experiment are shown in Table 6. In the table, “accuracy” means the frequency to find optimal solution, while “ACT” means the average computing time. From Table 6, it can be seen that (1) all three algorithms are able to obtain the best solution within 50 runs for all the eight problems; (2) SGA algorithm has a higher accuracy than PSO and faster computing speed than GA; (3) SGA algorithm can deal with these problems whose sizes are within 2000 variables while the GA is more efficient to deal with the large scale problem. From this, it can be concluded that the proposed SGA algorithm is efficient to solve the proposed bilevel multidemand multisource order quantity allocation problem in most cases.
6. Conclusions In this paper, we consider a multidemand multisource order quantity allocation problem with multiple transportation alternatives under uncertain environment. In this problem, two levels of decision makers should be considered: the purchaser on the upper level and the suppliers on the lower level. As the decision maker on the upper level, the purchaser hopes to allocate order quantity among multiple suppliers for multiple demand nodes. To minimize the total purchase cost, the total delay risk and the total defect risk are the decision objectives. As the decision makers on the lower level, to reduce the transportation and penalty costs, the suppliers hope to optimize the transportation alternatives. In the decision making process, some uncertain parameters also have to be considered. In order to solve this problem, a bilevel multiobjective programming model with mixed uncertain parameters is established. Then, the bilevel model is transformed into a single model by writing the lower level model with Kuhn-Tucker conditions. Next, a sectional genetic algorithm based on fuzzy random simulation is proposed to deal with the transformed model. Finally, a case study is presented to demonstrate the practicality and efficiency of the model and algorithm. The results show that the bilevel multiobjective order quantity allocation model has a greater ability in maintaining stability of the supply chain than a single-level model. In addition, the proposed sectional genetic algorithm based on fuzzy random simulation is also efficient to deal with the order quantity allocation problems in most cases. In this study, only one type of production or material is considered into the model. In the future, we will focus on the multidemand multisource order quantity allocation problem with multiple productions. In addition, the order quantity allocation problems under other uncertain environments also need to be considered.
Mathematical Problems in Engineering
17
Table 6: Comparison among SGA, GA, and PSO with different problem sizes. Number 1 2 3 4 5 6 7 8
𝐼
Size of tested problem 𝐽 𝐾 Variables
5 5 5 5 10 10 20 20
10 10 20 20 20 20 50 50
2 3 2 3 2 3 2 3
370 480 740 960 1440 1860 7100 9150
FRS-SGA Accuracy ACT 0.98 0.96 0.92 0.80 0.76 0.64 0.22 0.18
Conflict of Interests The authors declare no conflict of interests.
Acknowledgments This research was supported by the National Science Foundation for the Key Program of NSFC (Grant no. 70831005), the National Natural Science Foundation of China (Grant no. 71301109), and the Western and Frontier Region Project of Humanity and Social Sciences Research, Ministry of Education of China (Grant no. 13XJC630018).
References [1] L. de Boer, E. Labro, and P. Morlacchi, “A review of methods supporting supplier selection,” European Journal of Purchasing and Supply Management, vol. 7, no. 2, pp. 75–89, 2001. [2] M. Setak, S. Sharifi, and A. Alimohammadian, “Supplier selection and order allocation models in supply chain management: a review,” World Applied Sciences Journal, vol. 18, no. 1, pp. 55– 72, 2012. [3] Z. Li, W. K. Wong, and C. K. Kwong, “An integrated model of material supplier selection and order allocation using fuzzy extended AHP and multiobjective programming,” Mathematical Problems in Engineering, vol. 2013, Article ID 363718, 14 pages, 2013. [4] S. H. Ghodsypour and C. O’Brien, “A decision support system for supplier selection using an integrated analytic hierarchy process and linear programming,” International Journal of Production Economics, vol. 56-57, pp. 199–212, 1998. [5] S. H. Ghodsypour and C. O’Brien, “The total cost of logistics in supplier selection, under conditions of multiple sourcing, multiple criteria and capacity constraint,” International Journal of Production Economics, vol. 73, no. 1, pp. 15–27, 2001. [6] N. Xu and L. Nozick, “Modeling supplier selection and the use of option contracts for global supply chain design,” Computers and Operations Research, vol. 36, no. 10, pp. 2786–2800, 2009. [7] H. Fazlollahtabar, I. Mahdavi, M. T. Ashoori, S. Kaviani, and N. Mahdavi-Amiri, “A multi-objective decision-making process of supplier selection and order allocation for multi-period scheduling in an electronic market,” International Journal of Advanced Manufacturing Technology, vol. 52, no. 9–12, pp. 1039– 1052, 2011.
1.74 2.71 4.03 4.57 7.96 13.26 49.94 52.68
FRS-GA Accuracy ACT 0.98 0.96 0.90 0.82 0.76 0.68 0.44 0.34
1.89 3.38 5.74 7.64 15.12 28.24 105.34 141.02
FRS-PSO Accuracy ACT 0.94 0.90 0.76 0.56 0.40 0.28 0.12 0.08
0.98 1.74 2.65 3.87 6.38 10.18 23.34 28.25
[8] Y. Tang, Z. Wang, and J.-A. Fang, “Controller design for synchronization of an array of delayed neural networks using a controllable probabilistic PSO,” Information Sciences, vol. 181, no. 20, pp. 4715–4732, 2011. [9] Y. Tang, Z. Wang, and J.-A. Fang, “Feedback learning particle swarm optimization,” Applied Soft Computing Journal, vol. 11, no. 8, pp. 4713–4725, 2011. [10] W. Zhu, Y. Tang, J.-A. Fang, and W. Zhang, “Adaptive population tuning scheme for differential evolution,” Information Sciences, vol. 223, pp. 164–191, 2013. [11] M. Jafari Songhori, M. Tavana, A. Azadeh, and M. H. Khakbaz, “A supplier selection and order allocation model with multiple transportation alternatives,” International Journal of Advanced Manufacturing Technology, vol. 52, no. 1–4, pp. 365–376, 2011. [12] E. Kopytov and D. Abramov, “Multiple-criteria analysis and choice of transportation alternatives in multimodal freight transport system,” Transport and Telecommunication, vol. 13, no. 2, pp. 148–158, 2012. [13] R. Kawtummachai and N. V. Hop, “Order allocation in a multiple-supplier environment,” International Journal of Production Economics, vol. 93-94, pp. 231–238, 2005. [14] W. Dullaert, B. Maes, B. Vernimmen, and F. Witlox, “An evolutionary algorithm for order splitting with multiple transport alternatives,” Expert Systems with Applications, vol. 28, no. 2, pp. 201–208, 2005. [15] P. C. Yang, H. M. Wee, S. Pai, and Y. F. Tseng, “Solving a stochastic demand multi-product supplier selection model with service level and budget constraints using Genetic Algorithm,” Expert Systems with Applications, vol. 38, no. 12, pp. 14773– 14777, 2011. [16] J.-L. Zhang and M.-Y. Zhang, “Supplier selection and purchase problem with fixed cost and constrained order quantities under stochastic demand,” International Journal of Production Economics, vol. 129, no. 1, pp. 1–7, 2011. [17] N. Esfandiari and M. Seifbarghy, “Modeling a stochastic multi-objective supplier quota allocation problem with pricedependent ordering,” Applied Mathematical Modelling, vol. 37, no. 8, pp. 5790–5800, 2013. [18] M. Kumar, P. Vrat, and R. Shankar, “A fuzzy programming approach for vendor selection problem in a supply chain,” International Journal of Production Economics, vol. 101, no. 2, pp. 273–285, 2006. [19] A. Amid, S. H. Ghodsypour, and C. O’Brien, “A weighted maxmin model for fuzzy multi-objective supplier selection in a supply chain,” International Journal of Production Economics, vol. 131, no. 1, pp. 139–145, 2011.
18 [20] S. Nazari-Shirkouhi, H. Shakouri, B. Javadi, and A. Keramati, “Supplier selection and order allocation problem using a two-phase fuzzy multi-objective linear programming,” Applied Mathematical Modelling, vol. 37, no. 22, pp. 9308–9323, 2013. [21] H. Kwakernaak, “Fuzzy random variables-I. Definitions and theorems,” Information Sciences, vol. 15, no. 1, pp. 1–29, 1978. [22] M. L. Puri and D. A. Ralescu, “Fuzzy random variables,” Journal of Mathematical Analysis and Applications, vol. 114, no. 2, pp. 409–422, 1986. [23] C. A. Weber and J. R. Current, “A multiobjective approach to vendor selection,” European Journal of Operational Research, vol. 68, no. 2, pp. 173–184, 1993. [24] J. Xu and Y. Liu, “Multi-objective decision making model under fuzzy random environment and its application to inventory problems,” Information Sciences, vol. 178, no. 14, pp. 2899–2914, 2008. [25] J. Xu, F. Yan, and S. Li, “Vehicle routing optimization with soft time windows in a fuzzy random environment,” Transportation Research Part E: Logistics and Transportation Review, vol. 47, no. 6, pp. 1075–1091, 2011. [26] J. Xu, Y. Tu, and Z. Zeng, “Bilevel optimization of regional water resources allocation problem under fuzzy random environment,” Journal of Water Resources Planning and Management, vol. 139, no. 3, pp. 246–264, 2013. [27] J. Xu and X. Zhou, Fuzzy-Like Multiple Objective Decision Making, Springer, 2011. [28] A. Charnes and W. W. Cooper, “Chance-constrained programming,” Management Science, vol. 6, no. 1, pp. 73–79, 1959. [29] M. Sakawa and I. Nishizaki, Cooperative and Noncooperative Multi-Level Programming, Springer, 2009. [30] P. P. Zouein, H. Harmanani, and A. Hajar, “Genetic algorithm for solving site layout problem with unequal-size and constrained facilities,” Journal of Computing in Civil Engineering, vol. 16, no. 2, pp. 143–151, 2002. [31] C. K. Dimou and V. K. Koumousis, “Genetic algorithms in competitive environments,” Journal of Computing in Civil Engineering, vol. 17, no. 3, pp. 142–149, 2003. [32] J. Xu and L. Yao, Random-Like Multiple Objective Decision Making, Springer, Berlin, Germany, 2011.
Mathematical Problems in Engineering
Advances in
Operations Research Hindawi Publishing Corporation http://www.hindawi.com
Volume 2014
Advances in
Decision Sciences Hindawi Publishing Corporation http://www.hindawi.com
Volume 2014
Journal of
Applied Mathematics
Algebra
Hindawi Publishing Corporation http://www.hindawi.com
Hindawi Publishing Corporation http://www.hindawi.com
Volume 2014
Journal of
Probability and Statistics Volume 2014
The Scientific World Journal Hindawi Publishing Corporation http://www.hindawi.com
Hindawi Publishing Corporation http://www.hindawi.com
Volume 2014
International Journal of
Differential Equations Hindawi Publishing Corporation http://www.hindawi.com
Volume 2014
Volume 2014
Submit your manuscripts at http://www.hindawi.com International Journal of
Advances in
Combinatorics Hindawi Publishing Corporation http://www.hindawi.com
Mathematical Physics Hindawi Publishing Corporation http://www.hindawi.com
Volume 2014
Journal of
Complex Analysis Hindawi Publishing Corporation http://www.hindawi.com
Volume 2014
International Journal of Mathematics and Mathematical Sciences
Mathematical Problems in Engineering
Journal of
Mathematics Hindawi Publishing Corporation http://www.hindawi.com
Volume 2014
Hindawi Publishing Corporation http://www.hindawi.com
Volume 2014
Volume 2014
Hindawi Publishing Corporation http://www.hindawi.com
Volume 2014
Discrete Mathematics
Journal of
Volume 2014
Hindawi Publishing Corporation http://www.hindawi.com
Discrete Dynamics in Nature and Society
Journal of
Function Spaces Hindawi Publishing Corporation http://www.hindawi.com
Abstract and Applied Analysis
Volume 2014
Hindawi Publishing Corporation http://www.hindawi.com
Volume 2014
Hindawi Publishing Corporation http://www.hindawi.com
Volume 2014
International Journal of
Journal of
Stochastic Analysis
Optimization
Hindawi Publishing Corporation http://www.hindawi.com
Hindawi Publishing Corporation http://www.hindawi.com
Volume 2014
Volume 2014