SQM 2008
Multidimensional Software Monitoring Applied to ERP Eric Bouwers Software Improvement Group Amsterdam, The Netherlands Email:
[email protected]
Reinier Vis Software Improvement Group Amsterdam, The Netherlands Email:
[email protected]
Abstract Measuring the quality of software is gaining more and more attention from the industry, since high quality systems generally have a lower total cost of ownership. In order to give both managers and software developers insight in the quality of the software system they develop, a software quality monitoring system is needed. The metrics calculated on the software system need to give a comprehensive, yet meaningful report. The Software Improvement Group has developed the Software Monitor, an analysis and on-line reporting tool for monitoring the quality of a software system during development. In this paper, we discuss the requirements for the Software Monitor and explain why currently existing solutions do not fulfill all the needs. Furthermore, we give an overview of the implementation of the monitor and relate the different aspects to the requirements. To illustrate the implementation, we show a case-study in which we describe a monitor for a commercial ERP-language. Keywords: Software Metrics, Software Quality, Monitoring, OLAP, ERP, SAP, Static Analysis
1
Introduction
At the Software Improvement Group (SIG), we specialize in reviewing and monitoring the quality of software systems. In our experience, most development teams can give a rough estimate of which parts of their system are difficult to maintain, but these estimates are no more than educated guesses. On a management level we see that the demand for a quality-review is often available, but the knowledge to perform such a review is lacking. In order to provide both managers and developers with insight into the quality of their software systems, the SIG has developed a system capable of tracking the characteristics of a project over time by analyzing the source-code of the project. This system is based on facts, meaning that the calculated results are objective and can be verified. By interpreting the results, one can get an insight into the quality of a project [8]. This paper is electronically published in Electronic Notes in Theoretical Computer Science URL: www.elsevier.nl/locate/entcs
Bouwers and Vis
This paper defines the requirements for a Software Monitoring System capable of calculating characteristics of a project based on source-code. We give an overview of the design of such a system and argue that it fulfills these requirements. Furthermore, we discuss a case-study in which we apply our Software Monitor to a system written in a commercial ERP-language.
2
Requirements
A Software Monitoring System has to fulfill a number of requirements, which have come to light during our own experiences in software analysis, during software based risk assessments [8] and portfolio monitoring [5]. The requirements for a Software Monitoring System can be logically divided into two separate stages, the analysis stage and the reporting stage. 2.1
Analysis stage
The following requirements are focused on making the analysis stage both robust and flexible. A1 A company usually deploys multiple projects which are programmed in several programming languages. To support all projects of a company the analysis stage has to support many different languages. A2 To ensure the continuous monitoring of a project, the analysis stage has to handle incomplete, non-compilable systems in a static way. A3 In order to avoid incorrect measurements due to analyzing generated code, the analysis stage has to be able to ignore certain parts of the code-base. A4 The metrics calculated in the analysis stage must be easy to configure and extend for our programmers. This enables us to adapt the metrics towards a specific project, programming language or customer. A5 To calculate trends of the different metrics, it must be possible to run an analysis multiple times on different versions of a code-base. 2.2
Reporting stage
The following requirements focus on making the reporting side useful for managers, developers and our own consultants. R1 In order to give managers an overview of their system, the reporting side must offer a system-level overview of the calculated metrics. R2 To help developers to pinpoint problems in a certain location, the calculated metrics must be available on a code-unit-level. R3 Furthermore, to easily navigate to problematic areas in the code, the reporting side must offer a drill-down functionality. To offer different views on a system this drill-down is preferably available on multiple dimensions, i.e. both over the file-system as well as over a logical (language-specific) hierarchy. For example, we imagine that a Java-project has a package-hierarchy linking levels of package/file/class and methods. 2
Bouwers and Vis
R4 When multiple snapshots of a system are analyzed, the reporting side must be able to show a trend, for example by displaying a metric in a line-chart plotted over time. R5 The specification of which metrics are shown on which level must be easy to configure. Our consultants usually spot a trend and wish to investigate this in more detail by placing certain metrics side-by-side.
3
Software Monitor
Fig. 1. Overview of the structure of the Software Monitoring System
A high-level overview of our Software Monitoring System is shown in Figure 1. From left-to-right we can identify three separate components. Both the component on the left and the component of the right are developed in-house. For the component in the middle, the OLAP part, we use a library [3]. On the left-hand side of Figure 1, the Software Analysis Toolkit (SAT) is shown. This component takes the actual source-code and a configuration file as input for the analysis. Using the configuration, the SAT calculates several metrics and stores the result of these calculations. More details on how the SAT works and the influence of the configuration file will be described in Section 3.2. In the middle of Figure 1, an OLAP-cube is shown. This OLAP-cube acts as a data-store between the analysis stage and the reporting stage, and decouples both stages. The reasons for using an OLAP-cube as data-store are explained in Section 3.1. The right-hand-side of Figure 1 shows the monitor. The monitor uses a configuration file and the OLAP-cube generated by the analysis stage to display the data through a web-browser. Which metrics are shown within the browser depends on the configuration and the request. Section 3.3 gives more information about the interaction of the configuration, the request and the schema-file. 3.1
OLAP-cube
OLAP-cubes are commonly used to store measurements, numeric facts, categorized by dimensions. The usual example is the tracking of sales of different types of products in stores across multiple countries. By keeping track of the sales and the properties of the products, the management of the company is able to get reports of the sales by product, by product-category or by store. Additionally, OLAP-cubes 3
Bouwers and Vis
provide aggregation on each dimension, making it possible to get reports on sales by city, region and the entire country. Furthermore, dimensions and aggregation can be combined in order to generate a report on, for example, the number of items sold within a city grouped by product-color. In our case the measurements are calculated metrics. The dimensions support the storing of metrics in, amongst others, a file-system dimension, a language dimension and language specific dimensions such as the package-dimension for Java. By default, an OLAP-cube has a time-dimension, providing us with an easy way to store metrics of multiple versions in a single location. By using an OLAP-cube as a data-store, the result of multiple calculations is stored in a single place. Because the cube supports aggregation over dimensions, the data can be shown both on the system-level as well as the code-unit level. Furthermore, the ability to combine multiple dimensions at will makes sure that the reporting side can be quite flexible. As hinted in Figure 1 we use the open-source OLAP-server Mondrian [3]. This Java-based library expects a relational database that contains tables which store the measurements and the parent-child relation of the dimensions. The mapping of these tables on the OLAP-cube is described in a schema-file. Both the database tables and the schema-file are structured and relatively easy to understand. This makes both artifacts easy to generate and adapt, a prerequisite to make the analysis side flexible.
3.2
Software Analysis Toolkit
The Software Analysis Toolkit (SAT) takes two artifacts as input, a set of sourcefiles and a configuration file. The configuration file contains references to a database and a schema-file. Furthermore, the file contains one or more input-directories and a list of technologies. For each technology, a source-context and a set of visitors need to be specified. Additionally, a file-filter can be specified which filters out files belonging to that certain technology. In practice, each programming language has its own technology. Each input-directory is used as a single snapshot for a certain system. From the structure of the file-system a graph is constructed from directory-nodes, file-nodes and edges between them. The resulting graph represents the actual file-system. This graph serves as input for the specified source-contexts. Each source-context filters out the file nodes that belong to the technology and creates additional nodes and edges that describe logical units within the language of the source-files. For example, the Java-source-context filters all file-nodes of which the name ends with .java. The Java-source-context knows which parser to use to process the file-node and determines which package a node belongs to. When the node for this package is already in the graph, the node is reused, otherwise a new package node is created. The file-node is linked to this package-node by creating a new edge representing the package-to-file-relation. Furthermore, for each class within the file, a node is created and linked to the file-node. Note that this process is not limited to file-nodes. The Java-source-context also extracts method-nodes from a class-node and links these to the parent class-node. 4
Bouwers and Vis
When the complete graph is constructed, the different nodes are examined by the visitors specified in the configuration file. Each visitor is created to calculate a specific metric, i.e. the number of empty catch-blocks. The visitor visits each node, but only calculates and stores the information in the nodes of which the type indicates that the metric is meaningful. Visitors can either be specific for a language, e.g. the visitor for empty-catch-blocks in Java, or generic, e.g. a visitor counting the number of source-files. After running all the visitors for each source-context the complete graph is stored in a database by storing all nodes and the edges in between the nodes. Furthermore, a separate table is created that stores all the metrics that are stored in the different nodes. Finally, tables containing the parent-child-relation between nodes are generated for all dimensions that are configured. The configuration of dimensions is done within the source-context, in order to differentiate between different languages. A dimension is defined by a name, the type of the root-nodes and the types of the edges to walk over. This definition scheme makes the calculation of parent-child-relations a simple tree-traversal. The last thing that the SAT generates is a schema-file. This schema-file maps the tables that the SAT has generated onto a conceptual OLAP-cube. The schema describes which dimensions are in the cube and which measurements are calculated. 3.3
Software Monitor
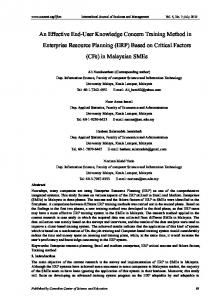
Fig. 2. Screenshot of the software monitor
The two main artifacts that are needed by the Software Monitor are 1) the OLAP-cube generated by the SAT and 2) a configuration file describing the configuration of the monitor. These two artifacts are related to each other such that the configuration file defines which measurements are shown in the monitor, while 5
Bouwers and Vis
the OLAP-cube describes which measurements are available. In other words, the configuration file can only show the metrics and dimensions that are defined within the schema-file. The output of the monitor consists of a set of web-pages. The page that contains the most information is the page holding the metric-table, an example of which is shown in Figure 2. Within the metrics-table, it is possible to traverse down a dimension, filter a certain level of the dimension on the names of the code-artifacts and export the current level of the dimension to an external program. Furthermore, each cell in the metric-table indicates whether the metric is increased or decreased relative to the last snapshot. It is also possible to see the trend of a metric by clicking on the value of a cell. The resulting page shows a line-chart plotting the selected metric for the selected code-artifact over time. Other pages that are available include an overview page showing a selection of the metrics in various chart-formats, and a page explaining the metrics. A configuration for the monitor consists of one main-configuration file and multiple context-specific-configuration files. In the main-configuration, a list of sourcecontexts is specified. Each context contains the name of the technology (Java, C#, . . . ) to use and the dimension (file-system, package, . . . ) to traverse. It is allowed to use the same technology in combination with several dimensions as well as to use the same dimension for several technologies. The restriction that is in place here, is that it is only possible to combine one technology and one dimension per source-context. This is not a problem, because each combination gives us an unique view of the system where adding a third dimension only obfuscates the report. For each combination of technology and dimension, a separate configuration file must be defined. This configuration file needs to specify which metrics need to be shown in the metrics-table on the various levels of the dimension. Furthermore, a set of charts,can be defined on each level, which are shown in the overview-page. In this way, we combine both the high-level overview and the low-level report in a single interface.
3.4
Flexibility
Even though the overview given in Figure 1 suggests that the SAT and the monitor are completely separated, the description of the configuration files in the previous sections indicate otherwise. It is clear to see that the configuration file of the monitor is limited by the data available within the cube. However, the data that will be available in the OLAP-cube is completely specified by the configuration of the SAT. That configuration-file specifies the technologies, and thereby the dimensions, the metrics to be calculated and the available input-files. One could see the configuration-file of the SAT as the recipe for the creation of the generated OLAP-cube. The possibility to simply define the structure of an OLAP-cube in terms of dimensions and metrics, provides us with a large amount of flexibility. Adding new dimensions or new measurements becomes a matter of updating a few configuration files and running the SAT again. 6
Bouwers and Vis
Taking the highly flexible configuration of the SAT into account, we do not see any problems with the fact that the monitor is limited by the OLAP-cube. If a specific view is needed we can adapt the configuration of the SAT and generate a cube that can give this desired view. Although the generation of the cube can be time-consuming, it does not outweigh the amount of time needed to calculate the metrics for each combination of source-context and dimension-levels. 3.5
Satisfaction of Requirements
In this section, we argue that the system which is described in the previous sections fulfills all the requirements for a Software Monitoring System. We describe the functionality of our system and link the specific functionality to a requirement as listed in Section 2. The SAT currently supports well over a dozen programming languages and we continue to add new languages and dialects (A1). Furthermore, the SAT is capable of analyzing incomplete and non-compilable systems, because we analyze and parse the code on a file-by-file basis and do not attempt to compile it (A2). Additionally, the configuration of the SAT allows for multiple input-directories representing different snapshots of a single system (A5). Moreover, the configuration of each technology contains a file-filter to filter out all unwanted files (A3). Finally, the visitors that calculate the metrics can all be listed in a single configuration file in which the properties of the visitors can also be parameterized (A4). Our monitor can provide managers with a high-level overview in both the form of charts showing key-metrics as well as a set of metrics, aggregated towards systemlevel (R1). Furthermore, the developers have the possibility to drill-down in the metric-table on several dimensions to identify problematic code-units in their codebase (R2, R3). Also, metrics can be shown over time on many different levels and code-units (R4). Finally, the configuration of the metrics that are shown resides within a configuration file that can be edited by any normal text-editor (R5).
4
Case Study
In this case study we will show that our Software Monitor is language independent, and that it can be used to analyze systems by showing metrics specific for a target language. Finally, the case study shows that reporting can be targeted towards the target audience; either for managers or for software developers. SAP is one of the most common ERP software systems. SAP software systems claim to provide all features most companies will ever use out of the box. However, SAP allows customization of forms, reports and programs. These can be programmed in the programming language ABAP. Ideally, companies would parameterize/configure the standard SAP forms to suit their needs. However, often companies create their own custom interfaces, which have to be maintained by the companies themselves, rather than relying on the SAP releases which are maintained by SAP. In this section, we will show that the quality of custom code in the SAP ERP system can be measured. We also argue that the Software Monitor has added value over checks provided by the SAP system itself. 7
Bouwers and Vis
Just like software written in any other language, custom ABAP reports and forms have to be maintained. All the pitfalls that apply to development in e.g. Java also apply to ABAP. Maintaining the custom forms in a SAP system should take as little effort as possible. To achieve this, one would need to write ABAP code that is as easy to maintain as possible. Every SAP system is automatically shipped with the code inspector [1] which can verify all programs, forms and reports written for a SAP system. The code inspector is a static analysis tool which can check for errors in the ABAP code. The code inspector has access to meta information about the ABAP programs, and can check whether the code adheres to naming standards, or whether programs are unicode enabled (this allows the programs to be deployed globally) as well as many other checks. The first step in improving the quality of the customized ABAP programs, is to require every changed program to pass all the code inspector tests. This assures that all the programs in the SAP application will be correct. Unfortunately, programmers can tell the code inspector to ignore bad structures in the code, by annotating the ABAP program with exclusion keywords. These keywords suppress any errors or warnings the code inspector generates on the line the keyword appears on. A second drawback of the code inspector is, that it doesn’t give any indication of the size and the complexity of the system as a whole. This indicates that this inspector is targeted towards developers instead of managers. 4.1
Maintainability Model
During the development of the custom SAP modules, the complexity of the system is changing constantly. The complexity, volume and amount of duplication in a system play important roles in influencing the maintainability of the software system. The Maintainability Model (MM) [2] gives us insight in which source code properties of a system attribute to the maintainability of the software system. In this model, the source code properties are all mapped onto the ISO 9126 standard [4]. The main metrics calculated for any software system in the software monitor can be mapped directly on the maintainability model. These metrics, such as volume (lines of code), volume per unit, cyclomatic complexity per unit [6,7] and duplication are always calculated for the systems under analysis. Furthermore, the volume per unit, cyclomatic complexity and duplication are related to the total size of the system, and grouped in bins. This shows for example the percentage of the system that has a McCabe value between 1 and 20, which percentage has a McCabe between 20 and 50, and which percentage has a McCabe of 50 and higher. Similar grouping can be done for the size of the units in the system.
4.2
Language-specific Metrics
Next to the standard metrics, extra language-specific metrics can be calculated on the system. For the ABAP programming language, the first sets of metrics involve hard-coding. These metrics count the number of hard-coded strings and the number of string-constants in a program. While SAP systems are often used at 8
Bouwers and Vis
companies that operate internationally, all forms and reports should be languageindependent. The way to make language-independent reports and forms in SAP, is by using constructs called text-symbols. A text-symbol represents a reference to a SAP table, where different translations of a string can be stored. Complementary to the number of hard-coded strings, the number of text-symbols are also counted and reported in the software monitor. Besides hard-coding, the number of deprecated keywords and statements used in the system are counted. During the development of a SAP system, one expects the number of used deprecated keywords to decrease over time. An increase of this metric shows that developers are still actively using deprecated functionality. The SAT also calculates a number of metrics that count bad practices in the SAP system. One of these metrics counts the number of unstable conditional statements. It counts the number of occurrences where an if-then-else statement contains one or more else-if conditions, but where the final else clause is omitted. Similarly, a switch statement where the default case is omitted, is also labeled as being unstable. A second metric is performance oriented, and counts the number of tables that are joined together in an SQL query. Every query that joins more than 3 tables together is counted by this metric. More performance risks regarding queries are the use of nested select statements, using a select query in a loop, or selecting all columns of a table with select *. Finally, the number of exclusion keywords, which are used by developers to suppress warnings generated by the source code inspector, are counted and reported in the monitor. This metric supplements the requirements from managers that all programs must pass the source code inspector. The language specific metrics are often grouped together, and the results of the metrics in the group summed together. For the ABAP programming language, there would be three groups; one group containing the total number of hard-coding violations, one group containing the total number of deprecated keywords, and a last group containing the sum of bad practices. In the software monitor front-end, a manager only wants to see the trends in the metrics; whether the metrics get better or worse. To create a front-end for a manager, it is often sufficient to report the groups. The manager can view for instance the number of bad practices over the system as a whole, but also for subsystems or packages. A developer on the other hand, is more interested in the detailed metrics. A developer will use the software monitor to locate the source of e.g. the bad practices, and fix these. E.g. if a developer gives fixing ’nested select’ statements a higher priority over ’select *’ statements, he wants to be able to localize the specific violations in the software monitor system. Through the configuration file, a monitor for developers can be created which shows all the net metrics and their values. Also, a monitor for managers can be created by showing a more global overview of the violations in the system. Managers often use the software monitor for impact analysis. When asked to change a certain part of the system, the managers can easily check the complexity of the subsystem in the monitor, and base the estimated development effort on these numbers. 9
Bouwers and Vis
4.3
Validation
In conversations with our customer, we have seen that programs that score bad on different metrics also tend to be the programs that require the most maintenance. This gives us confidence that our monitor is a useful tool to find the complex spots within a system. Unfortunately, we do not have the possibility to relate the metrics between different ABAP systems. This is due to the fact that we have analyzed only a single ABAP system thus far. In the future, we expect to analyze more ABAP systems, and gather more data to relate different ABAP systems against each other.
5
Related Work
In this section, we discuss related solutions for measuring the quality of a software system in terms of metrics. These solutions can roughly be divided into two separate groups. The first group contains the solutions that can serve as a complete replacement for our Software Monitor System. In Section 5.1, we discuss the characteristics of these tools and the reasons for not using them. The second group of tools contains existing front-ends for OLAP-cubes which in theory can be used with the cube that is generated by our SAT. The reasons for building our own front-end instead of using one of these existing solutions are given in Section 5.2. 5.1
Complete Solutions
There exists a large collection of stand-alone programs that is capable of calculating metrics on source-level. A simple search on sites that index open-source programs, for example sourceforge 1 , returns over 100 results. Unfortunately, most of these tools do not support more than three languages. Furthermore, the functionality of calculating metrics on several snapshots and showing the trend of these metrics is usually lacking. Finally, the overall problem with these tools is that they only try to inform the programmer by giving a detailed insight into his code. Although this makes the tools useful on a low level, they ignore managers and therefore violating requirement R1. A second set of solutions that is available is the editor-support for calculating metrics on source-files. This support can either be given by plug-ins or by the editor itself. The problem with this approach is again the lack of system-level overview. Also, the results are usually only available within the editor itself, making it harder to share the results with others. As a last group there exists a set of “collection”-tools. These tools are capable of collecting metrics from several tools and combining them into a single report. An example of this is the dashboard-plugin for Maven 2 , a software project management and comprehension tool. The dashboard plug-in is capable of storing the metrics of different snapshots and displaying the results via a website. Furthermore, aggregation to system-level is available for several metrics. Unfortunately, the set of available metrics for a collection-tool is relatively small. Also, because of the 1 2
http://www.sourceforge.net http://maven.apache.org/
10
Bouwers and Vis
dependency on external tools to calculate the metrics the collection-tools are usually harder to deploy and set-up. Finally, a collection-tool is less flexible in general because it has to take into account all the requirements that are imposed by the external programs. Even though there is a large set of tools available that can calculate and show metrics, we were not able to find any tool that could satisfy all requirements listed in Section 2. The biggest problem we see is that the tools are designed to only inform the programmer about the state of the project, leaving out the manager. This issue is addressed by the collection-tools, but these tools lack the flexibility to view the quality of a system from different angles. 5.2
OLAP-frontends
Since the analysis component and the reporting component are completely separated, we could have sufficed with one of the many existing front-ends for OLAPcubes. We have examined several different BI-suites that are capable of displaying charts and metrics similar to our own monitor. Furthermore, more generic pivottables are available that enables the user to go through an OLAP-cube without limitations. The fact that existing solutions are completely flexible in the way they represent the data is not a bad thing. Expert users usually want to have complete control over what they see because they know which data is relevant and which data is not. The first problem we saw with existing solutions is that they provide too much flexibility. Our users are usually not an expert in the field of software metrics and are therefore less capable of filtering out important patterns. With our current monitor we can filter out the patterns and only present the data that is relevant. The second problem that we have seen with existing solutions is that the OLAPcube that is generated by our analysis is not fixed. Dimensions and measurements that are available within one cube are not necessarily available within another cube. This makes it very important that the configuration of the front-end can be adapted on a cube-by-cube basis, without touching the configuration of the system as a whole. Unfortunately, we have not found an existing solution that fulfills this requirement.
6
Future Work
Currently, a single interface for every user of the monitor is deployed. However, we imagine that different users are interested in different views on the system. Also, more experienced users could benefit from a more dynamic and interactive interface. Because of this, we are exploring the possibilities to differentiate the functionality of the monitor based on the role of the user. Furthermore, for most of the calculated metrics, the semantics on different levels can be defined by a relation to the numbers on lower levels. For example, the number of lines of code for a module is simply the sum of the lines of code of each file in the module. However, there are some metrics, such as the fan-in, that must be 11
Bouwers and Vis
calculated differently based on the level in the dimension. Currently, this type of metric is only available in a separate report instead of in the monitor. Also, we are exploring the possibility to add several non-source-code related metrics to the monitor. Metrics such as the number of fixed issues, the amount of money spent, and the number of hours worked on the project can help to put the trend of the metrics into a different perspective. Finally, the relation between a project and other similar projects can also help to better interpret the results of the monitor. In order to support this we are building a benchmark application capable of relating the characteristics of several similar projects. Finding out which metrics are relevant in this context is still work in progress.
7
Conclusion
In this paper, we have described the requirements for a Software Monitoring System. These requirements focus on making the Software Monitoring System useful for different kinds of users, without losing the flexibility of configuration. We have discussed the implementation of such a Software Monitoring System which is being used by the Software Improvement Group. Furthermore, we have shown a case study where our Software Monitor is applied to the ABAP programming language; the programming language used in SAP ERP systems. The software monitor is highly valued by our customers. It is used to track the quality of software during development as well as following the progress of the software during maintenance. Customers acknowledge that using the Software Monitor during development results in a better maintainable system. Currently, the monitor is in use in various industries, including logistics, banking, insurance and embedded systems. This shows that the interest in the quality of systems is universal. As we continue to improve our Software Monitoring System, we hope to see that more and more developers acknowledge the importance of good quality of software.
Acknowledgements We would like to thank all our colleagues at the SIG for their comments and lively discussions regarding the contents of this paper.
References [1] R. Eilenberger and A.S. Schmitt. Evaluating the Quality of Your ABAP Programs and Other Repository Objects with the Code Inspector. SAP Professional Journal, pages 3–30, 2003. [2] Ilja Heitlager, Tobias Kuipers, and Joost Visser. A practical model for measuring maintainability. pages 30–39. Software Improvement Group, 2007. [3] J. Hyde et al. Mondrian OLAP Server, a Java-based ROLAP engine running over existing relational databases. http://mondrian.sourceforge.net/. [4] IEC ISO. ISO 9126/ISO, IEC (Hrsg.): International Standard ISO/IEC 9126: Information TechnologySoftware Product Evaluation. Quality Characteristics and Guidelines for their use., pages 12–15, 1991.
12
Bouwers and Vis [5] T. Kuipers and J. Visser. A tool-based methodology for software portfolio monitoring. In Mario Piattini and Manuel Serrano, editors, Software Audit and Metrics, Proceedings of the 1st International Workshop on Software Audit and Metrics, SAM 2004, In conjunction with ICEIS 2004, Porto, Portugal, April 2004, pages 118–128. INSTICC Press, 2004. [6] Thomas J. McCabe and Charles W. Butler. Design Complexity Measurement and Testing. Communications of the ACM 32, 12 (December 1989): 1415-1425. [7] Thomas J. McCabe and Arthur H. Watson. Software complexity. In Crosstalk, Journal of Defense Software Engineering 7, 12, pages 5–9, (December 1994). [8] A. van Deursen and T. Kuipers. Source-based software risk assessment. Software Maintenance, 2003. ICSM 2003. Proceedings. International Conference on, pages 385–388, 2003.
13