PHYSICAL REVIEW B 73, 235318 共2006兲
Multiexponential photoluminescence decay in indirect-gap semiconductor nanocrystals C. Delerue* and G. Allan Institut d’Electronique et de Microélectronique du Nord (UMR CNRS 8520), Département ISEN, 41 boulevard Vauban, F-59046 Lille Cedex, France
C. Reynaud and O. Guillois Laboratoire Francis Perrin (URA CEA-CNRS 2453), Service des Photons, Atomes et Molécules, DSM/DRECAM CEA-Saclay, F-91191 Gif/ Yvette Cedex, France
G. Ledoux LPCML, UMR CNRS 5620, Université Claude Bernard Lyon I, Villeurbanne, France
F. Huisken Institute of Solid State Physics, University of Jena and MPI for Astronomy, Heidelberg, Germany 共Received 20 December 2005; revised manuscript received 24 April 2006; published 9 June 2006兲 The origin of the multiexponential photoluminescence 共PL兲 decay of Si quantum dots 共QDs兲 has been debated for a long time. We present studies combining time-resolved PL experiments and tight binding calculations of phonon-assisted optical transitions showing that the distribution of lifetimes and its wavelength dependence are quantitatively predictable and can be interpreted as intrinsic properties of the QDs due to the indirect nature of the Si bandgap. This result can be generalized to QD ensembles of any indirect gap semiconductor. DOI: 10.1103/PhysRevB.73.235318
PACS number共s兲: 73.22.⫺f, 78.67.Bf
Semiconductor nanocrystals and quantum dots 共QDs兲 have unique optical properties which are strongly size dependent due to quantum confinement of the excitons. One remarkable property of these systems is that their photoluminescence 共PL兲 usually exhibits multiexponential decay,1 the number of experimental studies reporting mono-exponential decay2–4 being very limited. Nonexponential decay is observed not only in ensembles of QDs5–8 but also from single colloidal QDs.1,9 The origin of this complex dynamics is not yet well understood. In III–V and II–VI colloidal QDs, recent studies suggest that it could be due to fluctuations of the nonradiative decay channels9 or to variations of the electrostatic environment surrounding the QDs.1,10 Multiexponential decay is also observed in ensembles of Si QDs.7,8,11–13 In porous Si, it is often explained by the hopping of the photoexcited carriers between neighboring localized states in the silicon skeleton.14,15 However, this interpretation remains a highly controversial subject.16 Therefore, in all of these systems, the multiexponential decay is attributed to external factors which are not well defined. Even if there are numerical simulations showing that a nonexponential decay could be induced by variations in the local environment,17,18 there are presently no microscopic models and theoretical calculations capable to predict quantitatively the lifetime distribution. The aim of this paper is to show that, in the case of noninteracting silicon QDs, the decay dynamics can be quantitatively explained by an intrinsic mechanism which arises from the indirect nature of the semiconductor bandgap. We also show that there is no need to invoke extrinsic factors as in the case of III–V and II–VI QDs and we explain why this intrinsic mechanism is likely to occur in all indirect gap semiconductor QDs. Our conclusions are based on combined experimental and theoretical studies and on a careful comparison of their results. On the experimental side, time1098-0121/2006/73共23兲/235318共4兲
resolved PL measurements are performed on size-selected silicon QDs taking care to avoid interactions between the QDs. The PL decay is analyzed as a function of the emission energy and the lifetime distributions are derived using numerical treatment of the data. On the theoretical side, the radiative recombination lifetime is calculated including phonon-assisted processes which are known to be dominant in indirect gap semiconductor QDs,19,20 at least in a wide range of sizes. We show that theory and experiment agree on all the important aspects characterizing the PL decay: The value of the average lifetime, its variation with emission energy, the amplitude and the asymmetry of the distribution of lifetimes with respect to its average value. The silicon QDs studied in this work are synthesized by laser pyrolysis of silane in a gas flow reactor. The fabrication technique and the experimental PL setup have been described in detail earlier.21,22 The approach allows to produce high-quality silicon QDs which are extracted from the reaction zone to form a molecular beam of noninteracting nanoparticles. As the velocity of the nanoparticles in the beam is mass-dependent, size-selection can be achieved with a chopper properly synchronized to the pulsed pyrolysis laser.23 Using time-of-flight mass spectrometry, the size distribution of the nanoparticles can be determined in situ. The QDs are deposited on fused quartz substrates. After sample preparation, the QDs are passivated in air so that they are finally covered by a shell of SiO2 whose thickness is about 1 / 10 of the total particle diameter. The fourth harmonic 共266 nm兲 of a pulsed Nd:YAG laser was used to excite the QDs. All measurements were carried out at low laser fluence to avoid saturation effects.24 In our recent study,7 it was shown that the PL properties are independent of the density of the QDs on the substrate. In particular, the decay remains nonexponential even if the
235318-1
©2006 The American Physical Society
PHYSICAL REVIEW B 73, 235318 共2006兲
DELERUE et al.
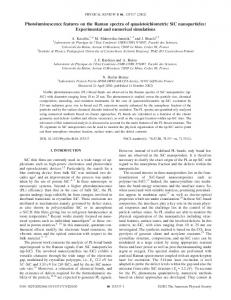
FIG. 1. 共Color online兲 PL decay curves of Si QDs measured at different wavelengths 共dots兲 and plotted together with calculated curves that were fitted to the data points using a set of 100 time constants.
nanoparticles are completely isolated from each other. This suggests that the complex decay dynamics is an intrinsic property of the silicon QDs. In order to obtain further information on the origin of this behavior, we present here new PL measurements that have been performed on the sample described as sample D in our previous report.7 This sample is a deposit of 3-nm-diam silicon QDs on a quartz substrate with a density of 3.8⫻ 1012 particles/ cm2. With a laser spot size of 0.3 mm,7 we excite and observe the PL of approximately 2.7⫻ 109 particles. The oxidation in air is not uniform among the nanoparticles giving rise to an inhomogeneous broadening of the PL spectrum 关the full width at half maximum 共FWHM兲 is 325 meV兴. Thus we have measured the PL response at different emission energies allowing to address groups of nanoparticles with similar core structure. Compared to the earlier study,7 we have used a more sensitive photon-counting technique and we have measured the PL decay curves on a much longer time scale, namely up to 3 ms. While, in the earlier study, the measured decay curves were fitted by stretched exponentials, here we are using an approach which is physically more meaningful. The PL decay curves measured at different emission wavelengths are shown in Fig. 1. For each wavelength, the curves exhibit a strong multiexponential behavior. From these data, we have extracted the lifetime distributions using a fitting procedure based on the maximum entropy method of data analysis.25 Defining G共兲 as the probability of encountering a QD with lifetime , the total PL intensity, I共t兲, is given by I共t兲 = const ⫻
冕
⬁
−1G共兲exp共− t/兲d .
共1兲
0
Here we assume that the absorption cross section is the same for all QDs. Based on Eq. 共1兲, the decay curves are fitted by a sum of simple exponentials with time constant j. More explicitly, we replace the integral 共1兲 by the sum I共t兲 = 兺 j−1 j A j exp共−t / j兲 and determine the amplitudes A j for a set of 100 time constants j. Because the lifetimes are dis-
FIG. 2. Normalized lifetime distributions derived from the experimental PL decay curves shown in Fig. 1. The dashed lines indicate the median values of the corresponding distributions 共see text兲.
tributed over several orders of magnitude we chose the grid points j such that they are equally spaced between ln共i兲 and ln共 f 兲 where i = 1 s and f = 2 ms, respectively. The lifetime distributions determined in this way for the six emission energies are displayed in Fig. 2. As is seen in Fig. 1, the fits yield very good agreement with the experiment. In order to interpret these results, we use a fully microscopic approach to calculate the radiative recombination rates including electron-phonon coupling.20,26 We compute the electronic structure of the QDs using a tight binding technique and we determine the phonon modes using a valence force field model. Then, for each mode of vibration, we calculate the matrix elements of the electron-phonon coupling and of the optical transitions in the dipolar approximation. Details on the method are given in Ref. 20. But, with respect to this previous work, we had to take into account the dielectric environment around the QDs which are covered by a SiO2 shell and are deposited on a quartz surface. Thus we introduce in the recombination rate a so-called local field factor26 which simulates this complex situation, writing the ratio Ein / Eout between the electric field inside and outside the QD as 3⑀out / 共2⑀out + ⑀in兲 where ⑀in is the size-dependent dielectric constant of the silicon core26 and ⑀out = 2 describes the dielectric constant in the surrounding medium. We have performed the calculations in a wide range of QD sizes and we have also considered two QD shapes, spherical or slightly ellipsoidal 共211兲, to see its influence on the results. For each dot, we have calculated the total radiative recombination rate k = −1 as the sum of all 共varying兲 radiative recombination rates corresponding to zero-phonon and phonon-assisted processes.27 Figure 3 presents the values of k plotted versus the zero-phonon emission energy. Compared to the results presented in Ref. 20, we obtain here lower rates due to the influence of the local field factor. The results for the two shapes are very similar when we plot the recombination rates versus the photon energy. Thus, taking into account that experimentally the shape of the QDs is always very close to a sphere, we can compare these results with the experiment. The calculated recombination rates are scattered over several orders of magnitude for reasons dis-
235318-2
PHYSICAL REVIEW B 73, 235318 共2006兲
MULTIEXPONENTIAL PHOTOLUMINESCENCE DECAY IN¼
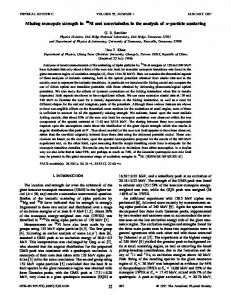
FIG. 3. Calculated recombination rates for spherical 共+兲 and ellipsoidal 共⫻兲 silicon QDs as a function of the emission energy E. The rates include the sum over all phonon-assisted processes at room temperature. The vertical bars indicate the dispersion of the experimental values around their median. The solid line represents a fit to the theoretical data yielding the average rate 1 /¯.
cussed in the following, but the average value 共defined hereafter by 1 /¯兲 has a clear evolution with the energy E. A fit of the average value in the range between 1.5 and 2.5 eV is given by 1 /¯共E兲 = A exp共E / E0兲 with A = 20.55 s−1 and E0 = 0.31 eV. To account for the large dispersion of the recombination rates, we took the average of their logarithm. The comparison between theory and experiment requires some care, in particular to define the dispersion of lifetimes. Since the calculated lifetimes are scattered over several orders of magnitude, the average of the distribution is not a meaningful quantity. Thus we prefer to define the median lifetime med as follows. We calculate the integral of G共兲 and, after renormalization, we obtain the function N共兲 giving the percentage of recombination channels characterized by a lifetime smaller than . The median lifetime is given by N共med兲 = 50%. We plot in Fig. 4 the normalized lifetime distribution with respect to / med which allows to compare directly the curves obtained at different wavelengths. In fact, we plot G共兲 versus the logarithmic time scale, since G共兲d = G共兲d共ln 兲.12 The dispersion of the lifetimes with respect to the median value is almost independent on the emission energy. We also see that the dispersion is asymmetric, with a much longer tail towards the smaller lifetimes. We compare the theoretical and experimental recombination rates in Fig. 3. The experimental values are shown as vertical bars indicating 50% of the distribution around the median value, i.e., corresponding to the range going from N共兲 = 25% to N共兲 = 75%. Even if the theoretical values are slightly lower than the experimental ones, the agreement is excellent. The absolute value is well reproduced, and the overall evolution of the recombination rates with emission energy is in very good correspondence. We immediately see that the amplitude of the dispersion is also in excellent agreement, since 50% of the theoretical points must lie within the experimental bars. To check this important point in detail, we plot in Fig. 4 the dispersion of the theoretical lifetimes. Since it is not possible to define such a distribution at a given gap
FIG. 4. Lifetime distributions G共兲. Lines: Experiment. At each emission wavelength , the distribution is plotted versus logarithmic time scale normalized with respect to the median lifetime med 共solid line: = 600 nm, med = 38.4 s; dotted line: = 700 nm, med = 90.5 s; dashed line: = 800 nm, med = 175.5 s兲. Bars: Theory. We plot here the distribution of the calculated values with respect to their average value ¯共E兲 in the 1.5–2.5 eV energy range.
energy 共the number of points being too small兲, we consider all the points in the energy range 1.5–2.5 eV and we calculate the dispersion of the lifetimes with respect to the average value ¯共E兲 defined previously. Such a procedure is justified since the experimental distribution of lifetimes does not depend on the energy. Figure 4 shows that the agreement between theory and experiment is once again very good. In particular, the width of the curve, its asymmetry and its longer tail towards smaller lifetimes are well reproduced. Now we can discuss the physics behind these results. Silicon is an indirect gap semiconductor and, in the bulk, the direct radiative recombination of electron-hole pairs is forbidden. The recombination is only possible with the assistance of phonons with wave-vectors joining the minimum of the conduction band in the Brillouin zone with the maximum of the valence band at k = 0. In QDs, direct no-phonon transitions become slightly allowed due to the fact that a confinement in real space leads to a spread of the wave functions in k-space.19,20,26 Thus each optical matrix element is a function of the overlap in k-space between the electron and hole wave functions and this overlap contains strongly oscillating factors with respect to the system size. These oscillations are still present when phonon-assisted transitions are more efficient than no-phonon ones,19,20,26 which is the case in the energy range considered here. The quantum confinement also breaks the selection rules for phonon-assisted transitions: Many phonon modes are involved in the transitions since the wave-vector is no longer a good quantum number. The distribution of radiative lifetimes reveals in a subtle manner the dispersion of the momentum according to the uncertainty principle. Another source of dispersion comes from intervalley splittings: Electron states arising from degenerate valleys of the conduction band are coupled and their couplings are oscillatory functions of the QD size.27 All these processes are consequences of the indirect gap of silicon. Therefore, the observation of multiexponential PL decay in nanostructures of indirect gap semiconductors must be considered as a general rule. It is important to note that, in the absence of external fluctuations, the PL decay of a single QD of an indirect gap semiconductor remains a single exponential since all the
235318-3
PHYSICAL REVIEW B 73, 235318 共2006兲
DELERUE et al.
channels 共phonon-assisted or not兲 are accessible at any time for the recombination of the electron-hole pair and the corresponding recombination rate is just the sum over all the possible channels. It is only because the decay rate strongly varies between QDs which emit at the same energy that the PL decay of an ensemble of QDs becomes multiexponential. The excellent agreement between theory and experiment also reveals the nature of the exciton recombination in our silicon QDs. It suggests that Si-SiO2 interface defects28–31 have a small influence on the radiative recombination in our samples, at least in the energy range considered here, confirming our previous conclusions.23 It also tells us that the measured lifetimes can be reduced to their radiative contribution. Therefore, the observation of a PL yield of 9% reported before7 has to be understood in the framework of a model originally proposed to explain the PL in porous silicon:16,32 The ensemble of silicon QDs must be divided in two groups: 共1兲 those which contain a nonradiative center and which are not luminescent; 共2兲 those—9% in our case— which are well passivated and which emit light. The great
similarity between the PL of porous silicon and of isolated QDs7 also supports this model. In conclusion, we have shown that the PL decay in an ensemble of indirect gap semiconductor QDs must be multiexponential. This behavior is an intrinsic property of the particles whereas in III–V and II–VI 共direct gap兲 QDs it can be only explained by fluctuations in the local environment. In the case of silicon QDs, even if the influence of these external factors cannot be totally excluded and could be involved in the blinking of the PL from single QDs,33 we have shown that they are not necessary to interpret the observed distributions of lifetimes as they can be predicted quantitatively by theoretical calculations of the radiative lifetimes for phononassisted processes.
*Electronic address:
[email protected]
3392 共1998兲; S. D. Baranovskii, ibid. 81, 3804 共1998兲; I. Mihalcescu, J. C. Vial, and R. Romestain, ibid. 81, 3805 共1998兲. 17 R. Chen, J. Lumin. 102-103, 510 共2003兲. 18 D. L. Huber, J. Lumin. 86, 95 共2000兲. 19 M. S. Hybertsen, Phys. Rev. Lett. 72, 1514 共1994兲. 20 C. Delerue, G. Allan, and M. Lannoo, Phys. Rev. B 64, 193402 共2001兲. 21 M. Ehbrecht and F. Huisken, Phys. Rev. B 59, 2975 共1999兲. 22 G. Ledoux, O. Guillois, D. Porterat, C. Reynaud, F. Huisken, B. Kohn, and V. Paillard, Phys. Rev. B 62, 15942 共2000兲. 23 G. Ledoux, J. Gong, F. Huisken, O. Guillois, and C. Reynaud, Appl. Phys. Lett. 80, 4834 共2002兲. 24 D. Amans, O. Guillois, G. Ledoux, D. Porterat, and C. Reynaud, J. Appl. Phys. 91, 5334 共2002兲. 25 S. Kumazawa, Y. Kubota, M. Takata, M. Sakata, and Y. Ishibashi, J. Appl. Crystallogr. 26, 453 共1993兲. 26 C. Delerue and M. Lannoo, Nanostructures—Theory and Modelling 共Springer-Verlag, Berlin, Heidelberg, 2004兲. 27 G. Allan, C. Delerue, and Y. M. Niquet, Phys. Rev. B 63, 205301 共2001兲. 28 M. V. Wolkin, J. Jorne, P. M. Fauchet, G. Allan, and C. Delerue, Phys. Rev. Lett. 82, 197 共1999兲. 29 I. Sychugov, R. Juhasz, J. Valenta, and J. Linnros, Phys. Rev. Lett. 94, 087405 共2005兲. 30 A. Puzder, A. J. Williamson, J. C. Grossman, and G. Galli, Phys. Rev. Lett. 88, 097401 共2002兲. 31 Z. Zhou, L. Brus, and R. Friesner, Nano Lett. 3, 163 共2003兲. 32 J. C. Vial, A. Bsiesy, F. Gaspard, R. Hérino, M. Ligeon, F. Muller, R. Romestain, and R. M. Macfarlane, Phys. Rev. B 45, 14171 共1992兲. 33 J. Valenta, N. Lalic, and J. Linnros, Appl. Phys. Lett. 84, 1459 共2004兲.
1
B. R. Fisher, H.-J. Eisler, N. E. Stott, and M. G. Bawendi, J. Phys. Chem. B 108, 143 共2004兲. 2 U. Woggon, O. Wind, F. Gindele, E. Tsitsishvili, and M. Müller, J. Lumin. 70, 269 共1996兲. 3 S. F. Wuister, C. de Mello Donegá, and A. Meijerink, J. Chem. Phys. 121, 4310 共2004兲. 4 A. F. van Driel, G. Allan, C. Delerue, P. Lodahl, W. L. Vos, and D. Vanmaekelbergh, Phys. Rev. Lett. 95, 236804 共2005兲. 5 M. G. Bawendi, P. J. Carroll, W. L. Wilson, and L. E. Brus, J. Chem. Phys. 96, 946 共1991兲. 6 A. M. Kapitonov, A. P. Stupak, S. V. Gaponenko, E. P. Petrov, A. L. Rogach, and A. Eychmüller, J. Phys. Chem. 103, 10109 共1999兲. 7 O. Guillois, N. Herlin-Boime, C. Reynaud, G. Ledoux, and F. Huisken, J. Appl. Phys. 95, 3677 共2004兲. 8 X. Chen, B. Henderson, and K. P. O’Donnell, Appl. Phys. Lett. 60, 2672 共1992兲. 9 G. Schlegel, J. Bohnenberger, I. Potapova, and A. Mews, Phys. Rev. Lett. 88, 137401 共2002兲. 10 R. G. Neuhauser, K. T. Shimizu, W. K. Woo, S. A. Empedocles, and M. G. Bawendi, Phys. Rev. Lett. 85, 3301 共2000兲. 11 E. Bustarret, I. Mihalcescu, M. Ligeon, R. Romestain, J. C. Vial, and F. Madéore, J. Lumin. 57, 105 共1993兲. 12 G. Mauckner, K. Thonke, T. Baier, T. Walter, and R. Sauer, J. Appl. Phys. 75, 4167 共1994兲. 13 J. Linnros, N. Lalic, A. Galeckas, and V. Grivickas, J. Appl. Phys. 86, 6128 共1999兲. 14 L. Pavesi and M. Ceschini, Phys. Rev. B 48, 17625 共1993兲. 15 P. J. Ventura, M. C. do Carmo, and K. P. O’Donnell, J. Appl. Phys. 77, 323 共1995兲. 16 I. Mihalcescu, J. C. Vial, and R. Romestain, Phys. Rev. Lett. 80,
The authors are grateful to Jörg Martin for providing the computer code that performs the multiexponential fit by the maximum entropy formalism. This work was supported by PROCOPE, a bilateral cooperation between France and Germany.
235318-4