Phosphatidylinositol (PI). Phosphatidylethanolamine (PE). 0.04848. 0.3456. 0.931. 0.018. 0.0003879. 0.01237. 0.2382. 0.5065. 0.004986. 0.02895. L1 p-value.
Cell Reports, Volume 20
Supplemental Information
Multilayered Reprogramming in Response to Persistent DNA Damage in C. elegans Diletta Edifizi, Hendrik Nolte, Vipin Babu, Laia Castells-Roca, Michael M. Mueller, Susanne Brodesser, Marcus Krüger, and Björn Schumacher
Supplemental Figures and Tables:
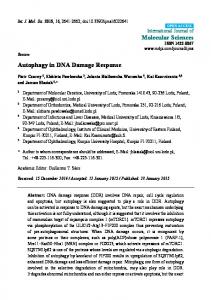
Figure S1, related to Figure 1 (A) Comparison between the three biological replicates of each treatment (untreated, UV treated and starvation). The figure shows a correlation matrix of the proteome dataset from xpc-1;csb-1 double mutants using Pearson correlation coefficients. Clustering dendrogram was calculated by Euclidean distance in complete mode. Almost linear correlation was observed for biological replicates. (B) Scatter plot showing the variability of untreated, starved and UV treated data.
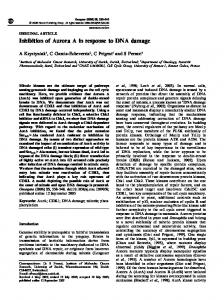
UP-regulated proteins (510)
DOWN-regulated proteins (488)
C. elegans
7,8%
20,8%
66%
7,2% 4,3%
Unclassified (337 out of a total of 3261 detected) Endoplasmic reticulum (4 out of a total of 140 detected) Peroxisome ( - out of a total of 13 detected) Extracellular (22 out of a total of 109 detected) Cytoskeleton (6 out of a total of 38 detected) Plasma membrane (37 out of a total of 193 detected) Mitochondria (3 out of a total of 146 detected) Cytoplasm (100 out of a total of 1370 detected) Nucleus (40 out of a total of 412 detected)
Unclassified (326 out of a total of 3261 detected)
5,7%
28%
67%
2,2
%
1,2
%
5,1%
Endoplasmic reticulum (25 out of a total of 140 detected) Peroxisome (6 out of a total of 13 detected) Extracellular (5 out of a total of 109 detected) Cytoskeleton (1 out of a total of 38 detected) Plasma membrane (4 out of a total of 193 detected) Mitochondria (11 out of a total of 146 detected) Cytoplasm (135 out of a total of 1370 detected) Nucleus (28 out of a total of 412 detected)
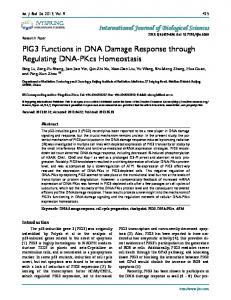
Human
45,7%
7%
6%
%
5%
19%
4,7
6,
32,8%
17%
63,3%
%
4,7
7,6%
44%
12%
2% 5,5 %
13%
Unclassified (224 out of a total of 1932 detected) Endoplasmic reticulum (36 out of a total of 444 detected) Peroxisome (3 out of a total of 25 detected) Extracellular (34 out of a total of 247 detected) Cytoskeleton (25 out of a total of 167 detected) Plasma membrane (96 out of a total of 643 detected) Mitochondria (24 out of a total of 409 detected) Cytoplasm (233 out of a total of 2830 detected) Nucleus (65 out of a total of 674 detected)
Unclassified (160 out of a total of 1932 detected) Endoplasmic reticulum (82 out of a total of 444 detected) Peroxisome (6 out of a total of 25 detected) Extracellular (23 out of a total of 247 detected) Cytoskeleton (10 out of a total of 167 detected) Plasma membrane (27 out of a total of 643 detected) Mitochondria (37 out of a total of 409 detected) Cytoplasm (309 out of a total of 2830 detected) Nucleus (58 out of a total of 674 detected)
Edifizi et al.
Figure S2, related to Figure 1 Pie charts representing the distribution of Gene Ontology categories of significant up and downregulated proteins in xpc-1;csb-1 double mutants upon UV treatment (FDR