889
ARTICLE Multilevel performance management framework for small to medium sized water utilities in Canada Can. J. Civ. Eng. Downloaded from www.nrcresearchpress.com by University of British Columbia on 10/20/15 For personal use only.
Husnain Haider, Rehan Sadiq, and Solomon Tesfamariam
Abstract: In Canada, small to medium sized water utilities (SMWU) do not often participate in National Water and Wastewater Benchmarking Initiative due to lesser economies of scale, lack of resources, and data limitations. Consequently, such SMWU are managing their functional components (i.e., environmental, personnel, operational, physical assets, customer satisfaction, public health, and financial) without quantitatively assessing and knowing if they are meeting their performance objectives. A multilevel performance management framework, consisting of five modules has been developed and implemented for SMWU in BC, Canada. The framework provides an approach to identify and select the suitable performance indicators for SMWU, and to use them for inter-utility performance benchmarking under limited data. The subsequent modules can be used for detailed performance management at utility, system, and sub-component levels. The utility managers can effectively employ this framework to identify the underperforming functional components and can rationally take corrective actions, and address customer satisfaction with efficient inventory management and data analyses. Key words: sustainable utilities, small to medium sized water utilities, performance indicators, performance benchmarking, performance management, customer satisfaction. Résumé : Au Canada, les services d’eau de petite a` moyenne taille (SEPMT) ne participent pas souvent a` la National Water and Wastewater Benchmarking Initiative en raison d’une réduction des économies d’échelle et d’un manque de ressources et de données disponibles. En conséquence, ces SEPMT gèrent leurs composantes fonctionnelles (c.-a`-d. celles liées a` l’environnement, au personnel, aux activités, aux biens matériels, a` la satisfaction de la clientèle, a` la santé publique et aux finances) sans évaluer quantitativement leurs performances et sans savoir s’ils atteignent leurs objectifs de performance. Un modèle de gestion des performances a` plusieurs niveaux, comportant cinq modules, a été conçu, puis utilisé dans des SEPMT situées en ColombieBritannique, au Canada. Ce modèle offre une méthode permettant d’identifier et de sélectionner des indicateurs de performance qui conviennent aux SEPMT et de les utiliser pour réaliser une analyse comparative des performances des différents services d’eau lorsqu’on dispose de peu de données. Les modules suivants peuvent être utilisés pour la gestion détaillée des performances au niveau d’un service d’eau, d’un système ou d’une sous-composante. Les directeurs de service d’eau peuvent utiliser ce modèle de manière efficace pour identifier les composantes fonctionnelles non performantes et peuvent prendre, d’une manière rationnelle, des mesures correctives et résoudre les problèmes de satisfaction de la clientèle en s’appuyant sur une gestion efficace des stocks et des analyses de données. [Traduit par la Rédaction] Mots-clés : services d’eau écoresponsables, services d’eau de petite a` moyenne taille, indicateur de performance, analyse comparative des performances, gestion des performances, satisfaction de la clientèle.
Introduction Access to safe drinking water in sufficient quantity at an affordable cost is a basic human right, irrespective of the geographical location and size of their community (WHO 2012). Like all other infrastructure systems, the water supply systems (WSSs) face a number of unique challenges in the 21st century, including rapid population growth, uncertain climate, socio-environmental issues, limited water resources, and ongoing economic crises (Berg and Danilenko 2011). Water utilities are mandated to provide a reliable, responsive, and affordable service to the public (USEPA 2003). The core of a water utility’s business deals with managing physical assets and related services, which can be divided into functional components of water resource management and environmental stewardship, operational practices, personnel productivity, physical infrastructure, customer service, water quality and public health, socio-economic issues, and financial viability. Each one of these components may consist of several sub-components, e.g., personnel productivity may include staff adequacy, produc-
tivity ratio, health and safety, as well as working environment. Moreover, a water utility may consist of one or more WSSs. A utility will only attain high sustainability objectives, when all of its WSSs, functional components and sub-components are performing efficiently. Alegre and Coelho (2012) define asset management for urban water utilities as “the set of processes that utilities need to have in place to ensure the performance of the asset in line with the service targets over time, that risks are adequately managed, and that the corresponding costs, in a lifetime cost perspective, are as low as possible”. The first step towards effective asset management is assessing the performance of above stated components of a water utility. Subsequently, based on the performance benchmarking results, the utility management can establish desirable level of service with defined acceptable risk, and can develop future financial plans. Even small water utilities can adopt sustainable asset management strategies to enhance their effective service life (Brown 2004).
Received 17 May 2015. Accepted 29 July 2015. H. Haider, R. Sadiq, and S. Tesfamariam. School of Engineering, University of British Columbia Okanagan, Kelowna, BC V1V 1V7, Canada. Corresponding author: Husnain Haider (e-mails:
[email protected],
[email protected]). Can. J. Civ. Eng. 42: 889–900 (2015) dx.doi.org/10.1139/cjce-2015-0227
Published at www.nrcresearchpress.com/cjce on 17 August 2015.
890
Can. J. Civ. Eng. Vol. 42, 2015
Can. J. Civ. Eng. Downloaded from www.nrcresearchpress.com by University of British Columbia on 10/20/15 For personal use only.
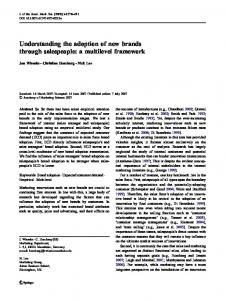
Fig. 1. Distribution of PIs in different functional components by various agencies.
The water utilities have been commonly classified as small, medium, and large based on the volume of supplied water, number of connections, and population served (Lambert and Taylor 2010; Corton and Berg 2009). In general, the utilities having population greater than 50 000, number of connections greater than 10 000, and demand higher than 50 million gallons per day (MGD) have been considered as the large ones (Haider et al. 2014; USEPA 2005; AWWA 2004). National Water and Wastewater Benchmarking Initiative (NWWBI), Canada was established in 1997. As per the recent public report published in 2013 (stated performance of water, wastewater and storm water utilities FY 2011), the wastewater and water utilities have been participating in NWWBI since 2003 and 2005, respectively. However, most of them are large water utilities with populations of more than 50 000, which covers approximately 50% of the Canadian utilities and more than 60% of the population. So far, the participation of small and medium sized water utilities (SMWU) has been negligible in NWWBI (AECOM 2013). A possible reason seems to be that there is no well-structured performance benchmarking framework available for such utilities which is simple (though comprehensive) that can be implemented under technical and financial resource constraints, and data scarcity. Secondly, due to lesser economies of scale, SMWU might be avoiding to participate with large utilities which may delineate deficiency performance. Consequently, in Canada, SMWU are mainly relying on emergency response in case of structural failures (e.g., water main break, hydrant failure, etc.) or customer complaints (e.g., colored water, bad taste, low pressure, no water, etc.). Moreover, without having a rational benchmarking procedure, such SMWU cannot quantitatively assess whether they are meeting their primary performance objectives or not. Generally SMWU are facing several technical, socio-economic, and environmental challenges to meet regulatory guidelines. For example, according to Water Canada (2013), water utilities in British Columbia have gone through highest number of boil water advisories as compared to other provinces, and most of them are SMWU with population of less than 50 000. Interior Health Canada (2013) has reported various reasons for these advisories, such as source water contamination, improper flushing of hydrants, construction, repair and maintenance works, equipment failure, and inadequate treatment, etc. Around the world, various agencies have developed systems for inter-utility performance benchmarking based on the performance indicators (PIs) (Coelho 1997; Alegre et al. 2006; Berg and Danilenko 2011; National Water Commission (NWC 2012); American Water Works Association (AWWA 2004); Office of Water Services (OFWAT 2012); National Research Council (NRC 2010); Canadian Standards Association (CSA 2010); Asian Development Bank (ADB 2012). Haider et al. (2014) carried out a state-of-the-art review of these systems of PIs. CSA (2010) Technical Committee
reviewed and recommended the International Organization for Standardization (ISO) Standards guidelines (CAN/CSA-Z24510) for improvement of service to users for Canadian water utilities in 2007; however, its application has not been reported for SMWU, so far. A summary of distribution of PIs for all functional components of a water utility is shown in Fig. 1. Literature review revealed that most of the systems developed by various organizations encompassed the PIs for the specific requirements of the region under study (e.g., NWC included over exhaustive list of water resources PIs due to the current water crises in Australia), or the organization itself (e.g., funding agencies like ADB and World Bank focus on financial indicators). Figure 1 shows that the PI system developed by International Water Association seems to be more balanced with a maximum number (170) of total PIs (Alegre et al. 2006); however, such large number of PIs need extensive data which is certainly not available with SMWU, particularly to initiate the performance management process. Large water utilities are fundamentally different than SMWU as these utilities are well-established in terms of procedures and processes, contain much larger and expansive physical infrastructure, and such utilities have to satisfy a large number of concerned and responsive customers. Also, the performance related issues (e.g., extensive energy requirements, widespread environmental impacts, large pipe bursts, and loss of amenities during vandalism) in larger utilities were recognized decades ago (Stone et al. 2002). In result, most of the existing performance benchmarking systems have primarily been developed, (i) for large water utilities, (ii) to address specific issues associated with geographical characteristics, or (iii) global objectives of the agency developed the system. The SMWU, however, have some advantages over large water utilities; for example, they have: (i) relatively less complex and newer physical infrastructures, (ii) simple organizational structures which provide more opportunity for change management, and (iii) less impacts on natural systems due to less withdrawals, and have less ecological footprint. Hence, SMWU cannot adopt the existing systems of PIs as such with limited data. According to European Project (COST Action C18: Performance assessment of urban infrastructure services), there is an urgent need for comprehensive research to improve performance management in SMWU (Alegre 2010). In NWWBI (2013) public report, the calculated values of different PIs are just compared with minimum, average, and maximum values of the participating utilities (i.e., essentially larger ones). Such simple comparison of individual PIs does not provide information about the overall performance of a water utility. Secondly, all these benchmarks are available for larger utilities, due to inherent less economies of scale in SMWU, the application of these benchmarks for inter-utility benchmarking of SMWU needs extensive efforts. The benchmarking process needs to be practical using relevant and measurable PIs, besides being comprehensive Published by NRC Research Press
Haider et al.
891
Can. J. Civ. Eng. Downloaded from www.nrcresearchpress.com by University of British Columbia on 10/20/15 For personal use only.
Fig. 2. Relative performance of water utilities in terms of performance gap between the calculated PI values and benchmarks using performance score.
enough to cover all the functional components. When one or more functional components are underperforming, the decision making can be improved by honing in the sub-components and processes. Such analysis needs to be performed at intra-utility to evaluate the performance of different WSSs operating within a utility. Presently, there are no frameworks available for both the inter-utility benchmarking and intra-utility performance management; also, the research gap exists in terms of addressing specific performance related issues (at component level) in SMWU. For example, in SMWU, customer satisfaction is a primary objective of a water utility to provide reliable services. Existing methods based on customer interviews might not be practically possible for smaller utilities; therefore the operational personnel strive hard to respond to the complaints without any management strategy. As a result, there is no structured mechanism available to evaluate the risk of customer dissatisfaction. A comprehensive assessment of the SMWU over their entire lifecycles (i.e., continuous benchmarking), responding to the research gaps followed by effective asset management plans, can help the utilities for attaining sustainability (Fig. 2). There are several models, guidelines and decision support tools proposed and developed by various agencies and organizations around the world to serve this purpose. Most of these tools are based on extensive, long-term, and expansive (requiring large human and financial resources) database, which is presently not available for SMWU in Canada. A comprehensive performance management can help the utility to achieve its overall sustainability objectives, such as: (i) optimization of human and financial resources, (ii) conservation of water resources, (iii) protection of environment, (iv) provision of safe and productive working environment for personnel, (v) protection of public health, (vi) provision of safe drinking water for the community, and (vii) achieving customers’ reliability through efficient operations and response to their complaints. The overall goal of this research is to develop a comprehensive performance management framework for SMWU. The specific objectives of this research are to develop modules for: (i) identifying the comprehensive potential PIs; (ii) selecting the most suitable PIs for SMWU based on their, applicability, measurability, understandability, and comparability; (iii) establishing inter-utility performance benchmarking; (iv) conducting intra-utility performance management; (v) developing a system for customer satisfaction management; and (vi) providing a proof-of-concept, by implementing these modules for a case study of Okanagan Basin, BC, Canada.
Performance management framework for SMWU A multilevel framework is developed for performance management of SMWU consisting for five stand-alone modules. The first two modules identify and select the PIs for SMWU. The third module benchmarks the cross-utility performance based on the estimated value of the selected PIs. The PIs in this module are calculated using data variables that are essentially the numerators and denominators in the PIs’ formulae, e.g., the PI of ‘pressure complaints’ has been calculated in terms of “[(number of pressure complaints)/(total population served)]”. In the fourth module the utility managers can manage the performance of different sub-components within a functional component in terms of performance measures that are estimated by aggregating the relevant PIs for each performance measure. In the last module customer satisfaction is evaluated through a detailed analysis of the record of customer complaints that have already been obtained as data variables for cross-utility benchmarking in the third module. A comprehensive list of data variables, performance indicators, performance measures, process parameters, and decision variables is presented in Table 1. The framework showing the interactions between all the five modules is presented in Fig. 3. Figure 3 shows the integrated framework that processes the information at different levels and can estimate the performance; it also shows the interaction among different modules, and describes the possible changes and (or) improvements, inputs, process, outputs, and outcomes of each module systematically. A brief description of the modules is given below. Details of the modeling results and application of individual modules can be seen in Haider (2015) and Haider et al. (2014, 2015a, 2015b). Module I: Identification of PIs As described earlier that the existing systems of PIs are either too exhaustive or sometimes focused on a specific component due to geographical limitations (refer to Fig. 1). For instance, International Water Association suggested more than 45 PIs to evaluate the financial viability of a water utility, such large number of PIs require extensive data which is certainly not the case of SMWU. Also, due to overall less operating costs and number of customers, SMWU can be evaluated with fewer PIs, particularly to initiate the performance management process. Therefore, in this module, a comprehensive review of the literature has been carried out to rationally assess the suitability of reported PIs systems for SMWU in terms of their simplicity (easy and simple data requirements) and comprehensiveness (i.e., covering all the components) (Fig. 3) (Haider et al. 2014). On the basis of this detailed review, suitable Published by NRC Research Press
Module I Functional component Water resources and environmental sustainability
Personnel productivity
Module II & III
Identified PIs1 Selected PIs 9
•
22
•
WE1- No. of days of water restriction • WE2–Residential water consumption (Total 6 PIs)
PE1: Field FTEs2– Distribution systems • PE2: Field FTEs–Metering (Total 12 PIs)
Physical assets efficacy
12
•
Operational Integrity
22
•
Public health safety
12
PH1: Metering level • PH2: Degree of automation (Total 7 PIs) OP1: Pipe breaks OP2: Pipes replaced (Total 12 PIs)
•
•
WP1: Boil water advisories • WP2: Average turbidity in distribution (Total 9 PIs)
Module IV Additional process parameters •
Module V Performance measure
WE6: Implementation Primary measures • Source water of water conservation plan protection • Water resources and • Environmental catchment protection and three management personnel secondary measures (L23) • FE7: Non-revenue water (L2) • PE12: Staff Productivity Primary measures • PE13: Implementation • Personnel adequacy • Personnel health and of health and safety plan safety • Working environment efficacy and 6 secondary measures • WE2: Residential water Primary measures • Storage and treatment consumption (L2) • WE6: Implementation systems capacity • Monitoring system level of WCP4 (L2) • FE1: Water rates (L35) Integrity and one secondary measure • OP11: Network Primary measures • Distribution system efficiency • OP12: Customer density integrity • P13: Average pipe age • Distribution system • OP14: Implementation performance • Distribution network level of risk based pipes' rehabilitation productivity and five and replacement plan secondary measures — Primary measures • Public health safety • Water quality adequacy and two secondary measures
Process parameters Decisions for risk Data/decision variable (Categorized complaints) reduction A1: Average annual demand A3: Average daily demand C5: Total capacity of treated water storage reservoirs (Total 17 variables)
•
Source water characteristics
•
Improve and (or) change source
•
A1: Average annual demand • A9: Treated water supplied • B1: Total personnel (Total 20 variables) • A1: Average annual demand • A3: Average daily demand (Total 10 variables)
•
Personnel productivity
•
•
Degree of automation
•
Hire additional staff for new inspection plans Optimize personnel productivity in result of automation Improve degree of automation
•
C6: Total number of service connections • C12: Total number of hydrants (Total 17 variables)
•
Water mains breaks Hydrant flushing
•
Improve flushing frequency
•
•
Boil water advisories Water quality compliance Water quality parameters Water mains flushing
•
Reduce boil water advisories Control water quality parameters through improved treatment
D17: Population affected by BWAs • D18: Turbidity in distribution system (Total 12 variables)
•
•
• • •
•
Can. J. Civ. Eng. Vol. 42, 2015
Published by NRC Research Press
Can. J. Civ. Eng. Downloaded from www.nrcresearchpress.com by University of British Columbia on 10/20/15 For personal use only.
892
Table 1. Functional components, performance measures, performance indicators, process parameters, and data and decision variables.
Need of willingness to pay surveys for major improvements •
Complaints related to pressure, structural failure, water quality, and general (Total 63 modes of failures) • Water rates
•
Regular service connection inspection program Avoid unplanned maintenance •
893
D25: Unplanned interruptions • D26: Unplanned maintenance hours (Total 17 variables) • G3: Total O&M cost of water treatment • G4: Total annual operational revenues (Total 13 variables)
•
Primary measure • Customer service reliability • Customer satisfaction level and 4 secondary measures Primary measures • Economic stability • Revenue collection efficiency • Operational cost compliance and two secondary measures •
FE1: Water rates FE2: O&M Cost per Km of water mains (Total 7 PIs) •
16 Economic and financial viability
•
•
•
QS6: Time of response to complaints QS10: Microbiological tests compliance QS11: Physico-chemical tests compliance FE8: Affordability •
QS1: Billing complaints • QS2: Pressure complaints (Total 9 PIs) 16
•
PIs have been identified and grouped as start-up-additional and advanced (depending on their relative importance) for all the functional components for SMWU. Keeping in view the technical constraints (i.e., less trained, motivated and aware personnel for planned performance management process), the first level consists of the most significant and easy to measure PIs, and moving to a relatively complex set of PIs depending on the availability of resources and specific operating conditions. Additional PIs can be included through continuing the literature review in this list to meet future needs for SMWU, e.g., technological advances, improved data management systems, implementation of more stringent water conservation and environmental protection regulations, etc. Module II: Selection of key performance indicators The potential PIs identified in Module I are evaluated against applicability, understandability, measurability, and comparability criteria using the multicriteria decision analysis (MCDA) which have been defined as the following:
Quality of service reliability
Process parameters Decisions for risk Data/decision variable (Categorized complaints) reduction Additional process parameters Identified PIs1 Selected PIs Functional component
Table 1 (concluded).
Module I
Module II & III
Module IV
Performance measure
Module V
Can. J. Civ. Eng. Downloaded from www.nrcresearchpress.com by University of British Columbia on 10/20/15 For personal use only.
Haider et al.
Applicability: how much an indicator is applicable and relevant for the performance benchmarking of SMWU? It is related to the overall technical, environmental, and socio-economic relevance of the indicator. Understandability: how much an indicator is understandable to both the public and the utility personnel? It is related to the type of data the PI involves and interpretability of the indicator. Measurability: how much the indicator is measurable? It is related to the availability, accuracy, and frequency of monitoring data required for the calculation of the indicator. Comparability: how much the calculated value of indicator is comparable with the other similar utilities in the region and (or) national or international level? It is important to select an appropriate method of MCDM for ranking and selection of PIs which should, (i) provide an opportunity to the utility managers to encompass the ranked PIs based on the data available and the existing needs of their utility, and (ii) not completely discard the remaining PIs initially identified in Module I, as they might be useful in future with the improvement in benchmarking process and data availability. The criteria weights and scoring of key PIs have been carried out through group decision making by involving utility managers, technical field staff, and researchers from academia. The ranking system was defined on ordinal scales to rank on a 5-point system translated as 1 as ‘Very Low’; 2 as ‘Low’; 3 as ‘Average’; 4 as ‘High’; and 5 as ‘Very High’; and the weights were determined using Analytical Hierarchical Process based on pair-wise comparison. The details of this module can be seen in Haider et al. (2015a). Module III: Inter-utility performance benchmarking (IU-PBM) The performance improvement process in any water utility initiates with an effective performance benchmarking, i.e., comparing the utility performance with other similar utilities (in size and geographical location) and with the standards established by various regulatory agencies (Marques and De Witte 2010; Alegre et al. 2006). It is essential to consider the relative performance of SMWU by calculating the performance gap from the benchmark; this concept is explained in Fig. 2. Any participating utility performing better than the other one but performing slightly less than the benchmark could be motivated to further improve its performance for the coming years. Likewise, the best performing participating utility should also be rationally compared with the benchmark, i.e., it is possible that the best one itself is just approaching the benchmark. Also, the best utility will need to maintain its performance with an even higher value than the benchmark. Such comparison can be made with the help of a Published by NRC Research Press
894
Can. J. Civ. Eng. Vol. 42, 2015
Can. J. Civ. Eng. Downloaded from www.nrcresearchpress.com by University of British Columbia on 10/20/15 For personal use only.
Fig. 3. Integrated framework for performance management of SMWU.
benchmarking approach (with limited data) which can cover the entire variation of performance shown in Fig. 2. In Module III, the selected PIs in Module II are used to develop an inter-utility performance benchmarking model (IU-PBM) for SMWU. The IU-PBM accommodates all the possibilities for utilities: (i) performing much worse than the established benchmarks, (ii) performing close (e.g., slightly higher or lower) to the benchmark, and (iii) which have been performing equal or better than the benchmarks (see Fig. 2). Calculating performance levels by simply comparing the calculated value of PI from the best and worst performing utilities in benchmarking might be misleading because, this approach does not consider the average performing utilities in the evaluation process. The nonlinear approach used in IU-PBM sufficiently addresses this issue. Subsequently, linear, exponential, logarithmic, and polynomial benchmarking transformation functions
(BTFs) have been established to translate the calculated PIs into performance levels between 10 and 100, which is based on literature, NWWBI reports (i.e., benchmarking data for large utilities), and expert judgment. The adjustment of reported values in NWWBI reports and literature can be explained with an example of the ‘per capita water consumption’ (a water resources indicator). As per NWWBI public report, the per capita median value of this PI is just over 200 with a maximum value of 593 L/day for large water utilities. While, this could be an average value in SMWU; the value of this PI can go up to 900 L/day (AECOM 2014). Therefore, the values have been tweaked, keeping in view relatively higher residential water usage practices (due to lower treatment levels, less population, less awareness about water conservation, etc.) in SMWU. Similarly, for other PIs the NWWBI values have been rationally adjusted to develop BTFs for SMWU. Published by NRC Research Press
Can. J. Civ. Eng. Downloaded from www.nrcresearchpress.com by University of British Columbia on 10/20/15 For personal use only.
Haider et al.
The performance levels of individual PIs obtained from BTFs might not be desirable by the senior managers and decision makers. In general, utility managers are more interested in developing composite indices to save their time and efforts which are required to evaluate the individual PI (Galar et al. 2014). A performance index combines information obtained by calculating several PIs into one final performance score; it consists of a weighting process and an aggregation process. The weighting process is required to determine the importance weights of all the PIs under each component; and the aggregation process is finally applied to combine the performance level with their respective weights. The weights are estimated using Simos’ method from the ranking of the selected PIs by different smaller water utilities in the Okanagan basin, British Columbia, Canada, and the opinion of experts working in water infrastructure management. Finally, the performance indices have been established by aggregating the transformed performance levels to appreciate the concept shown in Fig. 2. The IU-PBM results presented in the form of a web diagram demonstrate the utility’s performance to the top level management for pragmatic decision making. The IU-PBM accommodates wide variations in the calculated values of PIs, being mindful of the smaller economies of scale in SMWU as compared to larger water utilities. Details of the transformation functions and the model development can be seen in Haider et al. (2015b). Module IV: Intra-utility performance management (In-UPM) If the results of IU-PBM (Module III) show that all of the functional components are not performing ‘High’; this shows that there is a need for further investigations at utility level. In Module IV, an intra-utility performance management model (In-UPM) is developed to hone in the sub-components of each component to evaluate the functional processes in more detail. A top-down hierarchical based approach is used; starting from overall sustainability performance objectives of the functional components at the top, followed by primary and secondary performance measures of the sub-components, and indicators (basic building blocks) receiving inputs from data and decision variables at the bottom. For example, ‘quality of service reliability’ is one of the sustainability objectives. ‘Customer information level’ and ‘customer satisfaction level’ are the two primary level performance measures under quality of service reliability. At subsequent level, ‘customer information level’ and ‘responses to the complaints’ are the secondary level performance measures under the subcomponent of ‘customer satisfaction level’ (i.e., a primary level measure). These secondary level performance measures are inferred from the corresponding PIs, e.g., unplanned interruptions, total response to reported complaints, time of response, etc. Generally, SMWU lack in data collection and inventory management, and thus the decisions are made in an uncertain environment. The issues related to data scarcity are addressed by utilizing benchmarking data from larger utilities, peer-reviewed literature, and expert elicitation from local municipalities. In-UPM is robust enough to deal with temporal and spatial variations, i.e., it can assess the performance of a water utility as a whole and (or) different WSSs operating within a utility for a given assessment period. System level assessment is required when one or more functional components or sub-components are either performing ‘Medium’ or ‘Low’. A sub-model to perform sensitivity analyses has also been developed to rank the PIs based on their percent contribution to each functional component (Haider 2015). Module V: Customer satisfaction management in SMWU Unlike other products, customers do not necessarily have the same flexibility in selecting their water supplier (KWR 2008). Due to this constraint, for acceptable quality of service, the utility managers should maintain and operate their infrastructure to ensure safe and adequate water supply to the consumers. In addition, the utility should respond efficiently to the complaints, fail-
895
ure to do so may result in dissatisfaction of customers. After evaluating the performance of a utility at system and component level using Module IV, the utility managers also need to assess their customers’ satisfaction before finalizing the major decision actions. In other words, in case of dissatisfaction of their customers, they should rationally optimize their decisions to improve underperforming systems and components in such a way that the ultimate objective (i.e., customer satisfaction) of the utility shall also be achieved. In this regard, a customer satisfaction management framework is developed in Module V. The conventional methods for assessing CS are based on performance benchmarking and customer interviews. Former has already been evaluated in terms of quality of service using Modules III & IV; such results only guide about the general performance and cannot be used for detailed evaluation of improvement actions. Latter requires extensive human and financial resources and might not be sustainable for SMWU. A risk-based model is developed in Module V primarily based on the evaluation of customer complaints, and experience of the operational staff to support decision making for effective improvement actions. Module V evaluates the customer dissatisfaction in terms of risk of customer satisfaction, which starts when a customer reports a complaint to the utility; however, the complete evaluation process includes the duration between the time of the report and response up to the complete resolution of the complaint. The inherent assumption of the proposed approach is that if a utility receives fewer complaints, it implies that the customers are satisfied with the utility’s performance. This module evaluates the risk under each category of complaints and compares the cumulative risk with the acceptable risk. Keeping in view the limitations of resources, the estimated risks associated with different causes are prioritized for effective decision making. To achieve reliable customer service, the mitigation actions should continue to apply until both the risk from individual failure cause and the cumulative risk approach equal to or less than the acceptable risk.
Study area The Okanagan basin is a 200 km long narrow strip spanning over 8000 km2 from Armstrong (BC, Canada) to the United States Border. The basin consists of four cities (i.e., Vernon, Kelowna, Penticton, and Osoyoos) having one or more small to medium water utilities serving populations of less than 50 000 (OBWB 2014). Like most of the SMWU in Canada, these utilities have not been regularly participating in NWWBI so far, and face challenges to meet desired level of service. Furthermore, the basin possesses lowest per person water supply in Canada, on average an individual consumes 675 L/day, which is more than double the Canadian average (OBWB 2014). Most of the utilities in Okanagan Basin are facing water quality problems due to inadequate treatment (i.e., primarily disinfection); it is evident from the highest number of boil water advisories in BC in comparison to other provinces (Interior Health Canada 2013). With these and other performance related issues and having no comprehensive and structured performance management framework, the SMWU in Okanagan Basin are primarily relying on emergency response instead of planned improvement actions. Therefore, the framework presented in Fig. 4 has been implemented for a medium sized water utility serving 16 000 residents in the Okanagan Basin to evaluate its practicality. The land use of the study area (i.e., utility service area) is mixed, including residential, agricultural, commercial, public, and industrial. The height of the service area is approximately 400 m from mean sea level and the terrain is rolling to hilly with medium to steep grades. Three WSSs consisting of 150 km of water mains are serving more than 6000 customers. All of the WSSs relying on separate water sources (i.e., creek water, lake, partial Published by NRC Research Press
896
Can. J. Civ. Eng. Vol. 42, 2015
Can. J. Civ. Eng. Downloaded from www.nrcresearchpress.com by University of British Columbia on 10/20/15 For personal use only.
Fig. 4. Implementation results of the integrated framework for the Case Study of Okanagan Basin: WEI, water resources and environmental sustainability index; PEI, personnel adequacy index; PHI, physical assets efficacy index; OPI, operational integrity index; WPI, water quality and public health safety index; QSI, quality of service index; EFI, economic and financial viability index; CSI, complains about system integrity (complaints related to pressure and service connection repairs); RTC, response to complaints; WQC, water quality compliance; CIL, customers information level; CSL, customer satisfaction level; CSR, customer service reliability.
groundwater augmentation). For all three systems, the source water is being distributed after disinfection either through UV radiation followed by chlorination or chlorination as the primary treatment, without conventional surface water filtration. The water mains with an average age of less than 25 years vary between 50 mm and 900 mm in diameter. Although, some older pipes up to
80 years of age are still in service; in the past, the utility has not experienced frequent pipe breaks.
Results and discussions The results after implementing the proposed framework on the study area are shown in Fig. 4. The major findings are useful to Published by NRC Research Press
Can. J. Civ. Eng. Downloaded from www.nrcresearchpress.com by University of British Columbia on 10/20/15 For personal use only.
Haider et al.
evaluate the practicality of the framework at utility level management for SMWU utilities. In Module I, a total of 580 PIs covering different functional components of water utilities (Fig. 1) were evaluated, out of these, 109 potential PIs for SMWU were identified through a checklist and experts opinion keeping in view the data limitations (Fig. 4). It can be observed from Table 1 that relatively more complex functional components such as personnel productivity and operational integrity needs larger number of PIs for evaluation. Therefore, the primary objective of the screening process was to identify the most suitable nevertheless comprehensive list of PIs to evaluate the performance of all the functional components. Due to growing challenges of 21st century (i.e., global climate change, water resources limitations, population growth, etc.) and technological advances, development of new PIs can certainly be expected in future. In this regard, SMWU should continue the review process to include the state-of-the-art PIs, which should be further investigated using the detailed selection method described in Module I. In Module II, 109 PIs identified in Module I have been evaluated against the applicability, understandability, measurability and comparability criteria using ELECTRE outranking method. Utility managers, field personnel, and experienced academicians were involved in the group decision making process to obtain the criteria weights and scoring of PIs. This method presents the results in the form of network maps, which provide an opportunity to the utility managers to encompass the ranked PIs based on the data available and the existing needs of their utility. ELECTRE method was used, because: (i) distinct outranking relations between different PIs can be established, (ii) due to small differences of evaluations, establishing preferences between various PIs is not evident, and (iii) the PIs that might not be important for a specific utility or in view of decision makes will still be available in the network diagrams. For an instance, the example of water resources and environmental indicators is shown in Fig. 4, where the decision makers selected top 6 PIs (WE1 to WE6) to initiate the performance benchmarking process depending on the above mentioned criteria; however, the remaining three previously identified PIs in screening process are still present and can be included later (by revising the decision maker’s boundary) in the benchmarking process. A total of 62 PIs were finally selected; detailed numbers of PIs for each functional group are given in Table 1. The selected PIs are then used for the performance benchmarking of SMWU in Module III. An inter-utility performance benchmarking model (IU-PBM) for SMWU has been developed. Conventionally, a linear comparison of a particular utility’s performance has been made with the best and worst performing utilities to calculate a performance score. Such an approach can be misleading when the best performing utility either itself is not meeting required level of service or performing exceptionally high in comparison to the average performing utilities in the benchmarking process. Therefore, in the absence of an existing benchmarking data, rational transformation functions (i.e., polynomial, linear, exponential, and logarithmic) have been established to convert the calculated PIs into the performance scores with the help of NWWBI-PR, literature, and expert opinion. These BTFs transform the calculated value of all the 47 PIs into performance level between 10 and 100, with 10 being very poor and 100 being very good. To develop the aggregated performance indices, the PIs are ranked by different utilities’ managers and experts. The weights of the PIs between 0 and 1 were estimated with the help of Simos’ method depending on their relative importance under each functional component. Subsequently, the transformed performance levels were aggregated using the Technique for Order Preference by Similarity to Ideal Solution (TOPSIS) method, which is based on the concept of similarity (i.e., relative closeness) to the positive-
897
Fig. 5. Sensitivity analysis for the quality of service component.
ideal solution (PIS) and the remoteness from the negative-ideal solution (NIS) (Yoon and Hwang 1995). The benchmarking concept presented in Fig. 2 has been well addressed with TOPSIS application as it considers that how much the performance level of a PI is close to or away from the established level of service (i.e., benchmarks or standards). The results are shown in Fig. 4 in the form of a web diagram. It is expected that with the participation of SMWU in the benchmarking process, the level of service will be improved (Fig. 4). This improvement should be appreciated by recalibrating the transformation functions established in this research. If all the functional components are performing ‘High’, it can be assumed that the utility will obtain the ‘High’ performance form In-UPM simulations as well. In this situation, the utility manager needs to directly move to Module V to check the risk of customer satisfaction. If one or more functional components of the utility are not performing ‘High’, the managers need to evaluate the performance of the underperforming functional components and sub-components at utility level using In-UPM developed in Module IV (see performance measures column in Table 1 for subcomponents). Due to the limited performance benchmarking data, the evaluation criteria have been established using data of NWWBI public reports, published literature, and expert knowledge. To deal with the inherent uncertainties, fuzzy set theory has been used for performance inferencing. The fuzzy set theory was first developed by Zadeh (1978) to methodically incorporate human reasoning in decision making. The linguistically defined performance criteria (Low, Medium, High) and the corresponding suggestions (Revise, Improve, Maintain) have been analyzed and inferred with the qualitative and imprecise and uncertain knowledge in the form of if-then rules (Mamdani 1977). As an example, the results of In-UPM simulations for subcomponents under the functional component of quality of service reveals that water quality compliance (WQC) is low and needs to be revised through detailed investigations at system level. Subsequently, three WSSs operating within the utility are evaluated to identify the underperforming system for effective decision making. In Fig. 4, In-UPM results at system level show that the WQC in WSS I&III is low. The utility managers can take rational decisions accordingly, e.g., change source, improve treatment level, mains flushing etc. Sensitivity analyses results presented in Fig. 5 reveals that PIs for WQC have significant contribution to quality of service component. In the present case study, the water quality improvements achieved by changing the source for underperforming WSSs are presented in Fig. 6. Likewise, performance improvements can be achieved for other functional components. As a result of regular performance benchmarking process, the level of service can be revised and new PIs and PMs can also be included. In-UPM can also be used to predict the improvement in performance as a result of an improvement action. Once a decision action is selected based on the predicted simulations results for the future scenario after improvement action, there is a need Published by NRC Research Press
898
Can. J. Civ. Eng. Vol. 42, 2015
Can. J. Civ. Eng. Downloaded from www.nrcresearchpress.com by University of British Columbia on 10/20/15 For personal use only.
Fig. 6. In-UPM results showing overall performance of the utility after the implementation of improvement action (i.e., source water change).
of checking its impact on the customer satisfaction. Customer satisfaction is one of the most important objectives of any water utility. Therefore, it is desirable to assess the satisfaction level of customers to evaluate the viability of the major decision actions before practical implementation. This is also important due to the fact that major infrastructure improvements may increase water rates, which can also increase customer dissatisfaction. It is important for the utility managers to take rational decisions with optimal utilization of their human and financial resources to reduce cumulative risk of customer satisfaction up to the acceptable level. These decision actions may range from simple inspection and maintenance measures to expansive and large-scale infrastructure improvements. In this regard, a risk based customer satisfaction model is developed as Module V based on the record of customer complaints (work orders). The risk can be quantified with the help of failure mode effect analysis (FMEA) in terms of risk priority number (RPN) as a product of probability of occurrence of failure (P), the consequence of the failure (C), and detectability (D). Once the complaint has been reported, the ‘C’ in terms of customer satisfaction, depends on several factors, including the type of complaint, response time, and time to resolve the complaint. An efficient response time can be defined as the time in which the complaint was responded to with an acceptable satisfaction level. For example, response to an emergency leak should be immediate, within 2 to 4 h and a nonemergency leak within 24 h. The third factor ‘D’ is defined as the implementation level of risk mitigation measures. Traditionally, FMEA determines the criticality of a FM in terms of RP ranging between 1 and 1000 (Abdelgawad and Fayek 2010). Different categories of complaints are identified from an exhaustive record of customer complaints for SMWU, including pressure, structural, water quality, and general. All possible modes of failures are identified using root cause analysis in Fig. 7; and the detailed risk of customer satisfaction is assessed with the help of FMEA. To deal with inherent uncertainties associated with data limitations and expert opinion, fuzzy set theory is integrated with FMEA. The model results are shown in Fig. 4. For existing scenario ‘No Action’, the risk of customer satisfaction in terms of RPN is much higher than the acceptable value (i.e., 150), which shows that improvement actions are needed. If this value is within the acceptable risk value without any action, this means that customer complaints are either very low in numbers or they are not of a significant nature (e.g., water quality complaints). In this case, the
utility managers need to carefully evaluate their decisions which they have planned as a result of Module IV simulations. These decision actions may range from simple inspection and maintenance measures to expansive and large-scale infrastructure improvements. In this case study, the managers needed to take four actions: (i) automation of booster stations, (ii) a planned service connection inspection program, (iii) source water improvement, and (iv) a conventional water treatment facility. The reduction in RPN values in result of these actions are shown in Fig. 4. Once the cumulative RPN value approaches an acceptable level of risk and all the functional components, sub-components and WSSs are performing ‘High’, the framework terminates.
Summary and conclusions The participation of small to medium sized water utilities in the NWWBI is almost negligible in Canada, possibly due to less awareness and motivation, inefficient data management systems; moreover, due to lesser economies of scale, SMWU might be avoiding to participate with large utilities which may delineate deficiency performance. This research will help water utility managers across Canada and other parts of the world to enhance performance management in SMWU. The integrated performance management framework can be effectively used for future planning and decision making for optimal utilization of limited resources in SMWU. The results also advocate the implementation of this framework through strategic and policy level decision making processes in Canada to improve the performance management procedures for SMWU. Due to non-participation of SMWU in benchmarking process, the data are not available to establish benchmarks for cross-utility comparisons. The inter-utility performance benchmarking model (IU-PBM) provides the basis to initiate the benchmarking process amongst SMWU with existing data limitation at provincial level or across Canada. Certainly, the benchmarking relationships proposed in this work can never replace the actual benchmarking processes involving similar sized utilities in the same region, and need to be re-calibrated through a continuous benchmarking process. The weights of different PIs are always influenced by the site specific characteristics of the participating utilities; therefore, the weights established here can also be revised by involving larger number of SMWU in a region. IU-PBM is also recommended to be Published by NRC Research Press
899
Published by NRC Research Press
Can. J. Civ. Eng. Downloaded from www.nrcresearchpress.com by University of British Columbia on 10/20/15 For personal use only.
Haider et al.
Fig. 7. Root cause analysis (RCA) for customer complaints in small to medium sized water utilities.
Can. J. Civ. Eng. Downloaded from www.nrcresearchpress.com by University of British Columbia on 10/20/15 For personal use only.
900
enhanced for handling the uncertainties associated with data variables and expert opinion. Without comparing the performance before and after the implementation of decision actions, the utility cannot assess the impacts of improvement actions on performance, and thus unable to rationally justify the benefits of their spending. In general, the managers in smaller utilities take decisions without performing a detailed performance assessment; they undoubtedly need a quantitative rationale for their actions geared towards improvements in decision making process. The results of the intra-utility performance management model (In-UPM) can help the utility managers at strategic level in obtaining financial approvals from government agencies and can satisfy their customers and general public as well. Moreover, such quantitatively demonstrated results showing the processes with high performance shall motivate the managers for consistent efforts. The proposed hierarchical framework of In-UPM is flexible to include additional performance factors. It is recommended that with expected changes in infrastructure, availability of additional data and increased participation of SMWU in national benchmarking processes in the future, additional data and decisions variables, PIs, and performance measures should be included to further facilitate the decision making process. The PIs identified and selected provides guidelines to initiate and (or) improve the performance assessment process of the SMWU using appropriate PIs. Consistent review and improvement of the selected PIs is recommended over time as per the site specific requirements of the utilities under study, changes in international standards and environmental protocols, and increasing customer expectations. The results of customer satisfaction module reveal that about half of the cumulative risk can be reduced with the help of affordable interventions such as inspection and maintenance actions, while remaining risk reduction requires large-scale improvements in the infrastructure facilities. If sufficient resources are available, the surveys based on customer interviews should never be overlooked. Such surveys might be inevitable, particularly to determine customers willingness to pay for the improvement actions which can drastically increase water rates, e.g., installation of conventional water treatment plants.
Acknowledgements The financial support through NSERC Collaborative Research and Development Grant (Number: CRDPJ 434629-12) is acknowledged.
References Abdelgawad, M., and Fayek, A.R. 2010. Risk management in the construction industry using combined fuzzy FMEA and fuzzy AHP. Journal of Construction Engineering and Management, 136: 1028–1036. doi:10.1061/(ASCE)CO.19437862.0000210. ADB. 2012. Handbook for selecting performance indicators for ADB-funded projects in the PRC. Asian Development Bank, Manila, Phillipines. Available from http://www.adb.org/countries/prc/main [accessed July 2012]. AECOM. 2013. National water and wastewater benchmarking initiative - 2013 Public Report. Available from http://nationalbenchmarking.ca/old-site/. AECOM. 2014. Water utility master plan. Final report, District of West Kelowna, Kelowna, BC. Available from http://www.districtofwestkelowna.ca/287/ Water-Utility-Master-Plan [accessed 17 July 2014]. Alegre, H. 2010. Is strategic asset management applicable to small and medium utilities? Water Science & Technology, 62(9): 2051–2058. doi:10.2166/wst.2010. 509. Alegre, H., and Coelho, S.T. 2012. Infrastructure asset management of urban water systems. Chap. 3. In Water supply system analysis – selected topics. Edited by Avi Ostfeld. InTech, Rijeka, Croatia. doi:10.5772/52377. Alegre, H., Bapista, J.M., Cabrera, E., Jr., Cubillo, F., Duarte, P., Hirner, W., et al. 2006. Performance indicators for water supply services. In Manual of best practice series. IWA Publishing, London, UK.
Can. J. Civ. Eng. Vol. 42, 2015
AWWA. 2004. Selection and definition of performance indicators for water and wastewater utilities: water stats 2002 distribution survey. American Water Works Association, Denver, CO. Berg, C., and Danilenko, A. 2011. The IBNET water supply and sanitation performance blue book. In The international benchmarking network for water and sanitation utilities data book. Water and Sanitation Program, The World Bank, Washington, D.C. Brown, C.E. 2004. Making small water systems strong. Journal of Contemporary Water Research & Education, 128: 27–30. doi:10.1111/j.1936-704X.2004. mp128001005.x. Coelho, S.T. 1997. Performance in water distribution – a system approach. John Wiley and Sons Inc., New York. Corton, M.L., and Berg, S.V. 2009. Benchmarking Central American water utilities. Utilities Policy, 17(3–4): 267–275. doi:10.1016/j.jup.2008.11.001. CSA. 2010. CAN/CSA-Z24512-10 (R2014) - activities relating to drinking water and wastewater services - guidelines for the management of drinking water utilities and for the assessment of drinking water services. Canadian Standards Association, Toronto, ON. Galar, D., Berges, L., Sandborn, P., and Kumar, U. 2014. The need for aggregated indicators in performance asset management. Eksploatacja I Niezawodnosc – Maintenance and Reliability, 16(1): 120–127. Haider, H. 2015. Performance management framework for small to medium sized water utilities: conceptualization to development and implementation. Ph.D. Thesis, University of British Columbia, Vancouver, BC. Haider, H., Sadiq, R., and Tesfamariam, S. 2014. Performance indicators for small- and medium-sized water supply systems: a review. Environmental Reviews, 22(1): 1–40. doi:10.1139/er-2013-0013. Haider, H., Sadiq, R., and Tesfamariam, S. 2015a. Selecting performance indicators for small and medium sized water utilities: multi-criteria analysis using ELECTRE method. Urban water Journal, 12(4): 305–327. doi:10.1080/1573062X. 2014.900089. Haider, H., Sadiq, R., and Tesfamariam, S. 2015b. Inter-utility performance benchmarking model for small to medium sized water utilities: aggregated performance indices. Journal of Water Resources Planning and Management. In press. doi:10.1061/(ASCE)WR.1943-5452.0000552. Interior Health Canada. 2013. Water notifications. http://www.interiorhealth.ca/ YourEnvironment/InspectionReports/Pages/WaterNotifications.aspx [accessed 28 June 2013]. Interior Health Canada, Kelowna, BC. KWR. 2008. Consumer satisfaction, preference and acceptance regarding drinking water services: an overview of literature findings and assessment methods. Kiwa Water Research, The Netherlands. Lambert, A., and Taylor, R. 2010. Water loss guidelines. Water New Zealand, New Zealand Water and Wastes Association, Wairoa, New Zealand. Mamdani, E.H. 1977. Application of fuzzy logic to approximate reasoning using linguistic systems. Fuzzy Set Systems, C-26: 1182–1191. doi:10.1109/TC.1977. 1674779. Marques, R.C., and De Witte, K. 2010. Towards a benchmarking paradigm in European water utilities. Public Money & Management, 30(1): 42–48. doi:10. 1080/09540960903492364. NRC. 2010. Framework for assessment of state, performance and management of Canada’s core public infrastructure. Final Report B5332.5, National Research Council, Ottawa, ON. NWC. 2012. National performance report 2010-2011: urban water utilities. National Water Commission, Australian Government, Canberra, Australia. OBWB. 2014. Okanagan board water basin, cited on 2nd December 2014, http:// www.obwb.ca/wsd/about/state-of-the-basin. OFWAT. 2012. Key performance indicators – guidance. http://www.ofwat.gov.uk/ publications/guidance/gud_pro1203kpi.pdf [accessed August 2012]. OFWAT, Birmingham, UK. Stone, S., Dzuray, E.J., Meisegeier, D., Dahlborg, A.S., and Erickson, M. 2002. Decision-support tools for predicting the performance of water distribution and wastewater collection systems. U.S. Environmental Protection Agency, Washington, D.C. USEPA. 2003. Analysis and findings of the Gallup organization’s drinking water customer satisfaction survey. Office of Groundwater and Drinking Water, U.S. Environmental Protection Agency, Washington, D.C. USEPA. 2005. Drinking water infrastructure needs survey and assessment. EPA816-R-05-001, Office of Groundwater and Drinking Water, U.S. Environmental Protection Agency, Washington, D.C. Water Canada. 2013. Available from http://watercanada.net/ [accessed September 2013]. WHO. 2012. UN-water global annual assessment of sanitation and drinking water (GLASS) 2012 report: the changes of extending sustaining services. UN Water Report 2012, Switzerland. Yoon, K.P., and Hwang, C. 1995. Multiple attribute decision making-an introduction. SAGE Publications, CA. Zadeh, L.A. 1978. Fuzzy sets as a basis for a theory of possibility. Fuzzy Set and Systems, 1: 3–28. doi:10.1016/0165-0114(78)90029-5.
Published by NRC Research Press
This article has been cited by:
Can. J. Civ. Eng. Downloaded from www.nrcresearchpress.com by University of British Columbia on 10/20/15 For personal use only.
1. Sangjong Han, Hwankook Hwang, Seonghoon Kim, Gyu Baek, Joonhong Park. 2015. Sustainable Water Infrastructure Asset Management: A Gap Analysis of Customer and Service Provider Perspectives. Sustainability 7, 13334-13350. [CrossRef]