Multilingual Summarization: Dimensionality Reduction and a Step Towards Optimal Term Coverage John M. Conroy IDA / Center for Computing Sciences
[email protected]
Sashka T. Davis IDA / Center for Computing Sciences
[email protected]
Jeff Kubina Yi-Kai Liu Department of Defense National Institute of Standards and Technology
[email protected] [email protected] Dianne P. O’Leary University of Maryland and NIST
[email protected] Abstract
Judith D. Schlesinger IDA/Center for Computing Sciences
[email protected] al. (2012) for multi-document summarization, and apply it to both single and multi-document multilingual document summarization. Our extractive multi-document summarization performs the following steps:
In this paper we present three term weighting approaches for multi-lingual document summarization and give results on the DUC 2002 data as well as on the 2013 Multilingual Wikipedia feature articles data set. We introduce a new intervalbounded nonnegative matrix factorization. We use this new method, latent semantic analysis (LSA), and latent Dirichlet allocation (LDA) to give three term-weighting methods for multi-document multi-lingual summarization. Results on DUC and TAC data, as well as on the MultiLing 2013 data, demonstrate that these methods are very promising, since they achieve oracle coverage scores in the range of humans for 6 of the 10 test languages. Finally, we present three term weighting approaches for the MultiLing13 single document summarization task on the Wikipedia featured articles. Our submissions significantly outperformed the baseline in 19 out of 41 languages.
1
1. Sentence boundary detection; 2. Tokenization and term identification; 3. Term-sentence matrix generation; 4. Term weight determination; 5. Sentence selection; 6. Sentence ordering. Sentence boundary detection and tokenization are language dependent, while steps (3)-(6) are language independent. We briefly discuss each of these steps. We use a rule based sentence splitter FASSTE (very Fast, very Accurate Sentence Splitter for Text – English) (Conroy et al., 2009) and its multilingual extensions (Conroy et al., 2011) for determining the boundary of individual sentences. Proper tokenization improves the quality of the summary and may include stemming and also morphological analysis to disambiguate compound words in languages such as Arabic. Tokenization may also include stop word removal. The result of this step is that each sentence is represented as a sequence of terms, where a term can be a single word, a sequence of words, or character n-grams. The specifics of tokenization are discussed in Section 2. Matrix generation (the vector space model) was pioneered by Salton (1991). Later Dumais (1994) introduced dimensionality reduction in document retrieval systems, and this approach has also been
Our Approach to Single and Multi-Document Summarization
The past 20 years of research have yielded a bounty of successful methods for single document summarization (SDS) and multi-document summarization (MDS). Techniques from statistics, machine learning, numerical optimization, graph theory, and combinatorics are generally languageindependent and have been applied both to single and multi-document extractive summarization of multi-lingual data. In this paper we extend the work of our research group, most recently discussed in Davis et 55
Proceedings of the MultiLing 2013 Workshop on Multilingual Multi-document Summarization, pages 55–63, c Sofia, Bulgaria, August 9 2013. 2013 Association for Computational Linguistics
themes of the document(s), minimize redundancy, and satisfy the bound on the length of the summary. We discuss our OCCAMS V sentence selection algorithm in Section 5. Sentence ordering is performed using an approximate traveling salesperson algorithm (Conroy et al., 2009). Three term weighting variants were used to generate summaries for each of the 10 languages in the MultiLing 2013 multi-document summarization task. The target summary length was set to be 250 words for all languages except Chinese, where 700 characters were generated. We now present the details of our improvements to our algorithms and results of our experiments.
used by many researchers for document summarization. (In addition to our own work, see, for example Steinberger and Jezek (2009).) We construct a single term-sentence matrix A = (ai,j ), where i = 1, . . . , m ranges over all terms, and j = 1, . . . , n ranges over all sentences, for either a single document, when we perform SDS, or for a collection of documents for MDS. The row labels of the term-sentence matrix are the terms T = (t1 , . . . , tm ) determined after tokenization. The column labels are the sentences S1 , . . . , Sn of the document(s). The entries of the matrix A are defined by ai,j = `i,j gi , Here, `i,j is the local weight, which is 1 when term i appears in sentence j and 0 otherwise. The global weight gi should be proportional to the contribution of the term in describing the major themes of the document. While the global weight could be used as a term weight in a sentence selection scheme, it may be beneficial to perform dimensionality reduction on the matrix A and compute term weights based on the lower dimensional matrix. In this work we seek to find strong term weights for both single- and and multi-document summarization. These cases are handled separately, as we found that multi-document summarization benefits a lot from dimensionality reduction while single document summarization does not. Our previous multi-document summarization algorithm, OCCAMS (Davis et al., 2012), used the linear algebraic technique of Latent Semantic Analysis (LSA) to determine term weights and used techniques from combinatorial optimization for sentence selection. In our CLASSY algorithms (e.g., (Conroy et al., 2011)), we used both a language model and machine learning as two alternative approaches to assign term weights. CLASSY then used linear algebraic techniques or an integer linear program for sentence selection. Section 3 describes the term weights we use when we summarize single documents. In Section 4 we present three different dimensionality reduction techniques for the term-sentence matrix A. Once term weight learning has assigned weights for each term of the document(s) and dimensionality reduction has been applied (if desired), the next step, sentence selection, chooses a set of sentences of maximal length L for the extract summary. These sentences should cover the major
2
From Text to Term-Sentence Matrix
After sentence boundaries are determined, we used one of three simple tokenization methods and then one of two term-creation methods, as summarized in Table 1. Languages were divided into three categories: English, non-English languages with space delimited words, and ideographic languages (Chinese for MDS and Chinese, Japanese, and Thai for the SDS pilot task). For non-ideographic languages, tokens are formed based on a regular expression. For English, tokens are defined as contiguous sequences of upper or lower case letters and numbers. For other nonideographic languages, tokens were defined similarly, and the regular expression describes what characters are used to break the tokens. These characters include white space and most punctuation except the apostrophe. For English, Porter stemming was used for both SDS and MDS, with a stop list of approximately 600 words for SDS. For English and other word-based languages, lowercased bi-tokens were used in MDS and lowercased tokens for SDS. For all languages, and both SDS and MDS, Dunning’s mutual information statistic (Dunning, 1993) is used to select terms, using the other documents as background. The pvalue (rejection threshold), initially set at 5.0e-4, is repeatedly doubled until the number of terms is at least twice the length of the target summary (250 for MDS, 150 words or 500 characters for SDS). Note that these terms are high confidence signature terms (Lin and Hovy, 2000) i.e., the pvalue is small. We describe our terms as high mutual information (HMI), since Dunning’s statistic is equivalent to mutual information as defined by 56
Language English
Tokens [ˆA-Za-z0-9]
Terms for MDS HMI bi-tokens
Non-English Ideographic
[\s.?,";:˜![](){}&*=+@#$] 4-byte grams
HMI bi-tokens HMI tokens
Terms for SDS HMI non-stop-word tokens HMI tokens HMI tokens
Table 1: Term and token definition as a function of language and task.
Cover and Thomas (1991).
3
a term based personalized TextRank (TermRank), which we call PTR. The personalization vector we choose is simply the normalized frequency, and the Markov chain is defined by the transition matrix 1 1 M = LLT D + peT 2 2 where X pi = fi / (fi ),
Determining Term Weights for Single Document Summarization
For SDS we consider three term weighting methods. The first is global entropy as proposed by Dumais et al. for information retrieval (Dumais, 1994) (Rehder et al., 1997) and by Steinberger and Jezek for document summarization (Steinberger and Jezek, 2009). Global entropy weighting is given by P j pi,j · log pi,j (GE) wi =1− , log n
i
L is the incidence term-sentence matrix. The elements of L are previously defined local weights, `ij . The vector e is all 1’s and D is a diagonal matrix chosen to make the column sums equal to one. The estimated weight vector used by OCCAMS V, w(PTR) , is computed using 5 iterations of the power method to approximate the stationary vector of this matrix. Note, there is no need to form the matrix M since the applications of M to a vector may be achieved by vector operations and matrix-vector multiplies by L and LT . We test the performance of these three term weighting methods on two data sets: DUC 2002 English single-document data and the Wikipedia Pilot at MultiLing 2013.
where n is the number of sentences, pi,j = tij /fi , tij is the number of times term i appears in sentence j, and fi is the total number of times term i appears in all sentences.1 The second term weighting is simply the logarithm of frequency of the term in all the sentences: (LF)
wi
= 1 + log(fi ).
Log frequency is motivated by the fact that the sum of the term scores for a given sentence is (up to an affine transformation) the log probability of generating that sentence by sampling terms independently at random, where the probability of each term is estimated by maximum likelihood from the observed frequencies fi . The third method is a personalized variant of TextRank, which was first proposed by Mihalcea (2005) and motivated by PageRank (Page et al., 1999). The personalized version smooths the Markov chain used in TextRank (PageRank) with term (page) preferences. Previously, a sentence based version of personalization has been used for summarization; see, for example, Zhao et al. (2009). Our current work may be the first use of
3.1
Results for DUC 2002 Data
The DUC 2002 English single-document data contains 567 newswire documents for which there are one or two human-generated summaries. In addition to computing ROUGE-2 scores, we also compute an oracle coverage score (Conroy et al., 2006). At TAC 2011 (Conroy et al., 2011) (Rankel et al., 2012) bigram coverage was shown to be a useful feature for predicting the performance of automated summarization systems relative to a human summarizer. Oracle unigram coverage score is defined by X C1 (X) = f1 (i), i∈T
where T is the set of terms and f1 (i) is the fraction of humans who included the ith term in the
1
We make the usual convenient definition that pi log pi = 0 when pi = 0.
57
Term Weight PTR LF GE
ROUGE-2 0.194 0.192 0.190
C1 19.1 18.7 18.6
Group 1 2 2
dered in the order selected by OCCAMS V. Thus, sentences covering the largest number of relevant terms, as measured by the term-weighting scheme, will appear first. Results of this pilot study will be presented in detail in the overview workshop paper, but we note here that, as measured by ROUGE-1, in 19 of the 40 languages, at least one of our three submitted methods significantly outperformed the leadsummary baseline.
Table 2: ROUGE-2 and Coverage bi-grams Scores summary. More generally, we define Cn in similar way for n-gram oracle coverage scores. Coverage scores differ from ROUGE scores since the score is not affected by the number of times that a given human or machine-generated summary uses the term, but only whether or not the term is included in the machine summary and the estimated fraction of humans that would use this term. We note that this score can be modified to compute scores for human summarizers using the analogous jackknife procedure employed by ROUGE. Table 2 gives a summary of the results. We ran a Wilcoxon test to check for statistical distinguishability in the performance of the different term-weighting methods. Methods were placed in the same group if they produced results in coverage (C1 ) that were indistinguishable. More precisely, we used the null hypothesis that the difference between the vector of scores for two methods has median 0. If the p-value of two consecutive entries in the table was less than 0.05, the group label was increased and is shown in the last column. Log frequency (LF) and global entropy (GE) are correlated. For the DUC 2002 data they perform comparably. Personalized term rank (PTR) weighting is statistically stronger than the other two approaches, as measured by the oracle term coverage score. For these data the definition of term for the purposes of the computation of the oracle coverage score is non-stop word stemmed (unigram) tokens. 3.2
4
Dimensionality Reduction
The goal of dimensionality reduction is to identify the major factors of the term-sentence matrix A and to throw away those factors which are “irrelevant” for summarization. Here we survey three algorithms: the well-known LSA, the more recent latent Dirichlet allocation (LDA), and the new interval-bounded nonnegative matrix factorization. 4.1
Latent Semantic Analysis
Davis et al. (2012) successfully used an approximation to A, computed using the singular value decomposition (SVD) A = U SV T . They used the first 200 columns U200 of the singular vector matrix U and the corresponding part of the singular value matrix S. They eliminated negative entries in U200 by taking absolute values. The term weights were computed as the L1 norm (sum of the entries) in the rows of W = |U200 |S200 . Our method is similar, except that we use 250 columns and form them in a slightly different way. Observe that in the SVD, if ui is a column of U and viT is a row of V , then they can be replaced by −ui and −viT . This is true since if D is any diagonal matrix with entries +1 and −1, then A = U SV T = (U D)S(DV T ). Therefore, we propose choosing D so that the sum of the positive entries in each column of U is maxˆ by setting each negative imized. Then we form U ˆ250 S250 . entry of U D to zero and form W = U
Results for the Wikipedia Pilot at MultiLing 2013
This task involves single-document summarization for 1200 Wikipedia feature articles: 30 documents in each of 40 languages. For each document, the organizers generated a baseline lead summary consisting of the first portion of the feature article following the “hidden summary.” Summary lengths were approximately 150 words for all non-ideograph languages and 500 characters for the ideograph languages. Sentences were or-
4.2
Latent Dirichlet Allocation
We use the term-sentence matrix to train a simple generative topic model based on LDA (Blei et al., 2003). This model is described by the following parameters: the number of terms m; the number of topics k; a vector w representing a probability distribution over topics; and an m × k matrix A in 58
We simplify this problem by noting that for any W = XY , the entries of the optimal Z are `ij , wij ≤ `ij , wij , `ij ≤ wij ≤ uij , zij = uij , uij ≤ wij .
which each column represents a probability distribution over terms. In this model, sentences are generated independently. We use the “pure-topic” LDA model and assume, for simplicity, that the length of the sentence is fixed a priori. First, a topic i ∈ {1, . . . , k} is chosen from the probability distribution w. Then, terms are generated by sampling independently from the distribution specified by the ith column of the matrix A. We train this model using a recently-developed spectral algorithm based on third-order tensor decompositions (Anandkumar et al., 2012a; Anandkumar et al., 2012b). This algorithm is guaranteed to recover the parameters of the LDA model, provided that the columns of the matrix A are linearly independent. For our experiments, we used a Matlab implementation from Hsu (2012). 4.3
We solve our minimization problem by an alternating algorithm, iterating by fixing X and determining the optimal Y and then fixing Y and determining the optimal X. Either non-negativity is imposed during the solution to the subproblems, making each step more expensive, or negative entries of the updated matrices are set to zero, ruining theoretical convergence properties but yielding a more practical algorithm. Each iteration reduces the distance to the term matrix, but setting negative values to zero increases it again. For our summarization system we chose r = 50 and α = 1000. We scaled the rows of the matrix using global entropy weights and used L = 0.9A and U = 1.1A.
Interval Bounded Nonnegative Matrix Factorization (IBNMF)
We also use a new method for dimensionality reduction, a nonnegative matrix factorization algorithm that handles uncertainty in a new way (O’Leary and et al., In preparation). Since the term-sentence matrix A is not known with certainty, let’s suppose that we are given upper and lower bound matrices U and L so that L ≤ A ≤ U . We compute a sparse nonnegative low-rank approximation to A of the form XY , where X is nonnegative (i.e., X ≥ 0) and has r columns and Y is nonnegative and has r rows. This gives us an approximate nonnegative factorization of A of rank at most r. We choose to measure closeness of two matrices using the Frobenius norm-squared, where kZk2F denotes the sum of the squares of the entries of Z. Since A is sparse, we also want X and Y to be sparse. We use the common trick of forcing this by minimizing the sum of the entries of the matrices, denoted by sum(X) + sum(Y ). This leads us to determine X and Y by choosing a weighting constant α and solving min
X,Y,Z
4.4
A natural term weighting can be obtained by computing the row sums of the dimension-reduced approximation to the term-sentence matrix. For LSA, the resulting term weights are the sum of ˆ250 S250 . For the entries in the rows of W = U the LDA method the initial matrix is the matrix of counts. The model has three components similar to that of the SVD in LSA, and the term weights are computed analogously. For IBNMF, the term weights are the sum of the entries in the rows of the optimal XY . Each of the three dimensionality reduction methods require us to specify the dimension of the “topic space.” We explored this question using the DUC 2005-2007 and the TAC 2011 data. Tables 3, 4, 5, and 6 give the average ROUGE-2, ROUGE4, and bi-gram coverage scores, with confidence intervals, for the dimension that gave the best coverage. The optimal ranks were 250 for LSA, 5 for LDA, and 50 for IBNMF. We emphasize the these results are very strong despite the fact that no use of the topic descriptions or the guided summary aspects for the TAC 2010 and 2011 are used. Thus, we treat these data as if the task were to generate a generic summary, as is the case in the MultiLing 2013 task. 2
α kXY − Zk2F + sum(X) + sum(Y )
subject to the constraints L ≤ Z ≤ U, X ≥ 0, Y
Term Weighting and Dimension Choice for Multi-Document Summarization
≥ 0.
2
59
We note that some of the coverage (C2 ), and ROUGE-
System A C E F B D I H J G LSA250 IBNMF50 LDA5
R2 0.117 ( 0.106,0.129) 0.118 ( 0.105,0.131) 0.105 ( 0.092,0.120) 0.100 ( 0.089,0.111) 0.100 ( 0.086,0.115) 0.100 ( 0.089,0.113) 0.099 ( 0.085,0.116) 0.088 ( 0.077,0.101) 0.100 ( 0.090,0.111) 0.097 ( 0.085,0.108) 0.085 ( 0.076,0.093) 0.079 ( 0.068,0.089) 0.077 ( 0.074,0.080)
R4 0.016 ( 0.011, 0.021) 0.016 ( 0.012, 0.022) 0.016 ( 0.010, 0.022) 0.014 ( 0.010, 0.019) 0.013 ( 0.008, 0.019) 0.012 ( 0.007, 0.017) 0.010 ( 0.007, 0.014) 0.011 ( 0.007, 0.016) 0.010 ( 0.007, 0.013) 0.012 ( 0.008, 0.017) 0.008 ( 0.006, 0.009) 0.007 ( 0.005, 0.009) 0.008 ( 0.007, 0.009)
C2 26.333 (23.849,28.962) 25.882 (23.086,28.710) 23.625 (18.938,28.573) 23.500 (19.319,27.806) 23.118 (20.129,26.285) 22.957 (20.387,25.742) 21.806 (17.722,26.250) 20.972 (17.389,24.750) 20.472 (17.167,24.389) 20.111 (16.694,24.000) 17.950 (17.072,18.838) 17.730 (16.843,18.614) 17.165 (16.320,18.024)
Table 3: DUC 2005 System C D B G H F I J A E LDA5 IBNMF50 LSA250
R2 0.133 ( 0.116,0.152) 0.124 ( 0.108,0.140) 0.118 ( 0.105,0.134) 0.113 ( 0.102,0.124) 0.108 ( 0.098,0.117) 0.109 ( 0.093,0.128) 0.106 ( 0.096,0.116) 0.107 ( 0.093,0.125) 0.104 ( 0.093,0.116) 0.104 ( 0.089,0.119) 0.103 ( 0.099,0.107) 0.095 ( 0.091,0.099) 0.099 ( 0.096,0.103)
R4 0.025 ( 0.018, 0.033) 0.017 ( 0.011, 0.023) 0.015 ( 0.012, 0.020) 0.016 ( 0.011, 0.022) 0.013 ( 0.010, 0.016) 0.016 ( 0.010, 0.023) 0.012 ( 0.008, 0.015) 0.015 ( 0.010, 0.022) 0.015 ( 0.010, 0.022) 0.014 ( 0.010, 0.020) 0.012 ( 0.011, 0.013) 0.010 ( 0.009, 0.011) 0.012 ( 0.011, 0.013)
C2 30.517 (26.750,34.908) 27.283 (23.567,31.050) 25.933 (23.333,29.033) 25.717 (23.342,28.017) 24.767 (22.433,27.067) 24.183 (20.650,28.292) 24.133 (22.133,26.283) 23.933 (20.908,27.233) 23.283 (20.483,26.283) 22.950 (19.833,26.450) 22.620 (21.772,23.450) 22.400 (21.615,23.177) 22.335 (21.497,23.200)
Table 4: DUC 2006 System D C E J B I G F A H IBNMF50 LSA250 LDA5
R2 0.175 ( 0.157,0.196) 0.151 ( 0.134,0.169) 0.139 ( 0.125,0.154) 0.139 ( 0.120,0.160) 0.140 ( 0.116,0.163) 0.136 ( 0.113,0.159) 0.134 ( 0.118,0.150) 0.134 ( 0.120,0.149) 0.133 ( 0.117,0.149) 0.130 ( 0.117,0.143) 0.140 ( 0.122,0.158) 0.125 ( 0.120,0.130) 0.124 ( 0.118,0.129)
R4 0.038 ( 0.029, 0.050) 0.035 ( 0.024, 0.049) 0.025 ( 0.020, 0.030) 0.028 ( 0.019, 0.038) 0.027 ( 0.019, 0.036) 0.022 ( 0.014, 0.030) 0.027 ( 0.018, 0.035) 0.024 ( 0.017, 0.033) 0.024 ( 0.016, 0.033) 0.020 ( 0.015, 0.027) 0.023 ( 0.017, 0.031) 0.022 ( 0.020, 0.024) 0.021 ( 0.019, 0.023)
Table 5: DUC 2007
60
C2 39.481 (34.907,44.546) 34.148 (29.870,38.926) 30.907 (27.426,34.574) 30.759 (25.593,36.389) 30.537 (25.815,35.537) 30.537 (25.806,35.241) 30.259 (26.509,33.926) 29.944 (26.481,33.870) 29.315 (25.685,33.093) 28.815 (25.537,32.185) 28.350 (27.092,29.567) 28.144 (26.893,29.344) 27.722 (26.556,28.893)
System IBNMF50 D LSA250 A LDA5 E H B F C G
R2 0.132 ( 0.124,0.140) 0.128 ( 0.110,0.146) 0.128 ( 0.120,0.136) 0.119 ( 0.099,0.138) 0.120 ( 0.112,0.128) 0.118 ( 0.099,0.138) 0.115 ( 0.097,0.132) 0.111 ( 0.099,0.125) 0.109 ( 0.090,0.128) 0.110 ( 0.095,0.126) 0.110 ( 0.092,0.127)
R4 0.033 ( 0.029, 0.038) 0.024 ( 0.017, 0.032) 0.030 ( 0.025, 0.034) 0.024 ( 0.016, 0.033) 0.028 ( 0.024, 0.033) 0.025 ( 0.016, 0.035) 0.020 ( 0.014, 0.027) 0.018 ( 0.013, 0.023) 0.017 ( 0.010, 0.025) 0.015 ( 0.010, 0.021) 0.016 ( 0.010, 0.023)
C2 12.585 (11.806,13.402) 12.212 (10.394,14.045) 12.210 (11.441,12.975) 11.591 ( 9.758,13.455) 11.409 (10.678,12.159) 11.288 ( 9.409,13.258) 11.212 ( 9.439,12.955) 10.591 ( 9.379,11.864) 10.530 ( 8.515,12.500) 10.379 ( 8.939,11.924) 10.258 ( 8.682,11.894)
Table 6: TAC 2011
5
Sentence Selection
chooses the one with maximal coverage weight. The first three candidate sets were used in the OCCAMS algorithm (Davis et al., 2012). The set K1 is determined using the Greedy BMC heuristic of Khuller et al. (1999) to maximize the sum of weights corresponding to terms in the summary sentences. The set K2 is determined the same way, but the sentence that has the best sum of weights is forced to be included. The third candidate K3 is determined by applying a fully polynomial-time approximation scheme (FPTAS) dynamic programming algorithm, denoted by KS, to the knapsack problem using sentences chosen by the Greedy BMC heuristic, asking for a length of 5L. The fourth candidate K4 is similar, but the sentence with the best sum of weights is forced to be included in the input to KS. OCCAMS V guarantees an approximation ratio of (1 − e−1/2 ) for the result because the quality of the solution chosen is no worse than the approximation ratio achieved by the OCCAMS algorithm.
Our sentence selection algorithm, OCCAMS V, is an extension of the one used in (Davis et al., 2012), which uses the (1 − e−1/2 )-approximation scheme for the Budgeted Maximal Coverage (BMC) problem and the Dynamic Programming based FPTAS for the knapsack problem. Algorithm OCCAMS V (T, D, W, c, L) 1. K1 = Greedy BMC(T, D, W, c, L) 0 0 0 , L0 )), 2. K2 = Smax ∪ Greedy BMC(T n P , D , W, c o where Smax = argmax{Si ∈D} tj ∈Si w(tj ) and T 0 , D0 , W, c0 , L0 represent quantities updated by deleting sentence Smax from the collection. 3. K3 = KS(Greedy BMC(T, D, W, c, 5L), L); 4. K4 = KS(K40 , L), where 0 , D 0 , W, C 0 , 5L0 )); K40 = Smax ∪ Greedy BMC(T o nP 5. K = argmaxk=1,2,3,4 T (Ki ) w(ti ) where T (Ki ) is the set of terms covered by Ki .
This algorithm selects minimally overlapping sentences, thus reducing redundancy, while maximizing term coverage. The algorithm guarantees a (1 − e−1/2 ) approximation ratio for BMC. We use the m terms T = {t1 , . . . , tm } and their corresponding weights W = {w1 , . . . , wm }. We also use the n sentences D = {S1 , . . . , Sn }, where each Si is the set of terms in the ith sentence, so that Si ⊆ T . We define c to be a vector whose components are the lengths of each sentence. Our algorithm, OCCAMS V, determines four candidate sets of summary sentences and then
6
Coverage Results for MultiLing 2013
We defined a term oracle coverage score in Section 3.1, an automatic summarization evaluation score that computes the expected number of n-grams that a summary will have in common with a human summary selected at random, assuming that humans select terms independently. As reported in (Davis et al., 2012), the 2-gram oracle coverage correlates as well with human evaluations of English summaries as ROUGE-2 does for English newswire summaries.3 It is natural then to ask to what extent oracle coverage scores can predict a summary’s quality for other languages.
2 scores reported in (Davis et al., 2012), where a rank 200 approximation and a large background corpus were used, are higher than the ones reported here, where a small selfbackground and a rank 250 approximation is used.
3
61
Here a term is defined as a stemmed 2-gram token.
7
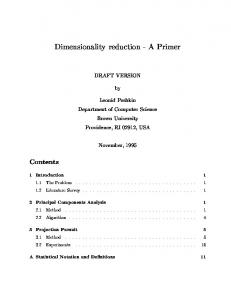
For each of the 10 MultiLing 2013 languages we can tokenize and generate bigrams (or character n-grams for Chinese) for the human-generated summaries and the machine-generated summaries. Table 7 gives the average oracle term (bi-gram) coverage score (C2 ) for the lowest-scoring human and for each of the dimensionality reduction algorithms described in Section 4.
In this paper we presented three term weighting approaches for single document multi-lingual summarization. These approaches were tested on the DUC 2002 data and on a submission to the MultiLing 2013 single document pilot task for all 40 languages. Automatic evaluation of these summaries with ROUGE-1 indicates that the strongest of the approaches significantly outperformed the lead baseline. The Wikipedia feature articles pose a challenge due to their variable summary size and genre. Further analysis of the results as well as human evaluation of the submitted summaries would deepen our understanding. A new nonnegative matrix factorization method, interval bounded nonnegative matrix factorization (IBNMF), was used. This method allows specifying interval bounds, which give an intuitive way to express uncertainty in the term-sentence matrix. For MDS we presented a variation of a LSA term-weighting for OCCAMS V as well as novel use of both of the IBNMF and an LDA model. Based on automatic evaluation using coverage, it appears that the LSA method and the IBNMF term-weighting give rise to competitive summaries with term coverage scores approaching that of humans for 6 of the 10 languages. The automatic evaluation of these summaries, which should soon be finished, will be illuminating.
In all but four of the languages (Romanian, Hindi, Spanish, and Chinese), at least one of our methods scored higher than the lowest scoring human. As with the DUC and TAC testing, the LDA method of term-weighting was the weakest of the three. In fact, in eight of the languages one or both of OCCAMS V(LSA) and OCCAMS V(IBNMF) (indicated in boldface in the table) scored significantly higher than OCCAMS V(LDA) (p-value < 0.05 using a paired Wilcoxon test). The human coverage scores for three of the languages (Romanian, Hindi, and Chinese) are surprisingly high. Examining these data more closely indicates that a large number of the summaries are nearly identical. As an example, in one of the Romanian document sets, there were 266 bi-grams in the union of the three summaries, and the summary length was 250. Document sets similar to this are the major cause of the anomalously high scores for humans in these languages. Language english arabic czech french greek hebrew hindi spanish romanian chinese
Human 37 22 22 28 19 16 64 47 118 68
LSA 38 29 34 38 25 19 20 40 31 23
IBNMF 37 28 35 38 25 22 20 44 28 24
Conclusions and Future Work
LDA 34 23 33 34 24 19 18 36 29 18
Note: Contributions to this article by NIST, an agency of the US government, are not subject to US copyright. Any mention of commercial products is for information only, and does not imply recommendation or endorsement by NIST.
References Anima Anandkumar, Dean P. Foster, Daniel Hsu, Sham Kakade, and Yi-Kai Liu. 2012a. A spectral algorithm for latent dirichlet allocation. In Peter L. Bartlett, Fernando C. N. Pereira, Christopher J. C. Burges, L´eon Bottou, and Kilian Q. Weinberger, editors, NIPS, pages 926–934.
Table 7: MultiLing 2013 Coverage Results
Human evaluation of the multi-lingual multidocument summaries is currently under way. These evaluations will be extremely informative and will help measure to what extent ROUGE, coverage, and character n-gram based methods such as MeMoG (Giannakopoulos et al., 2010), are effective in predicting performance.
Anima Anandkumar, Rong Ge, Daniel Hsu, Sham M. Kakade, and Matus Telgarsky. 2012b. Tensor decompositions for learning latent variable models. CoRR, abs/1210.7559. David M. Blei, Andrew Y. Ng, and Michael I. Jordan. 2003. Latent dirichlet allocation. Journal of Machine Learning Research, 3:993–1022.
62
John M. Conroy, Judith D. Schlesinger, and Dianne P. O’Leary. 2006. Topic-focused multi-document summarization using an approximate oracle score. In Proceedings of the ACL’06/COLING’06 Conferences, pages 152–159, Sydney, Australia, July.
Lawrence Page, Sergey Brin, Rajeev Motwani, and Terry Winograd. 1999. The pagerank citation ranking: Bringing order to the web. Technical Report 1999-66, Stanford InfoLab, November. Previous number = SIDL-WP-1999-0120.
John M Conroy, Judith D Schlesinger, and Dianne P O’leary. 2009. Classy 2009: summarization and metrics. Proceedings of the text analysis conference (TAC).
Peter A. Rankel, John M. Conroy, and Judith D. Schlesinger. 2012. Better metrics to automatically predict the quality of a text summary. Algorithms, 5(4):398–420.
John M Conroy, Judith D Schlesinger, Jeff Kubina, Peter A Rankel, and Dianne P O’Leary. 2011. Classy 2011 at tac: Guided and multi-lingual summaries and evaluation metrics. Proceedings of the Text Analysis Conference.
Bob Rehder, Michael L. Littman, Susan T. Dumais, and Thomas K. Landauer. 1997. Automatic 3-language cross-language information retrieval with latent semantic indexing. In TREC, pages 233–239. Gerard Salton. 1991. The smart information retrieval system after 30 years - panel. In Abraham Bookstein, Yves Chiaramella, Gerard Salton, and Vijay V. Raghavan, editors, SIGIR, pages 356–358. ACM.
Thomas M. Cover and Joy A. Thomas. 1991. Elements of information theory. Wiley-Interscience, New York, NY, USA.
Josef Steinberger and Karel Jezek. 2009. Update summarization based on novel topic distribution. In ACM Symposium on Document Engineering, pages 205–213.
Sashka T. Davis, John M. Conroy, and Judith D. Schlesinger. 2012. Occams - an optimal combinatorial covering algorithm for multi-document summarization. In Jilles Vreeken, Charles Ling, Mohammed Javeed Zaki, Arno Siebes, Jeffrey Xu Yu, Bart Goethals, Geoffrey I. Webb, and Xindong Wu, editors, ICDM Workshops, pages 454–463. IEEE Computer Society.
Lin Zhao, Lide Wu, and Xuanjing Huang. 2009. Using query expansion in graph-based approach for queryfocused multi-document summarization. Information Processing & Management, 45(1):35 – 41.
Susan T. Dumais. 1994. Latent semantic indexing (lsi): Trec-3 report. In TREC, pages 105–115. Ted Dunning. 1993. Accurate methods for the statistics of surprise and coincidence. Computational Linguistics, 19(1):61–74. George Giannakopoulos, George A. Vouros, and Vangelis Karkaletsis. 2010. Mudos-ng: Multidocument summaries using n-gram graphs (tech report). CoRR, abs/1012.2042. Daniel Hsu. 2012. Estimating a simple topic model. http://cseweb.ucsd.edu/˜djhsu/ code/learn_topics.m. Samir Khuller, Anna Moss, and Joseph Naor. 1999. The Budgeted Maximum Coverage Problem. Inf. Process. Lett., 70(1):39–45. Chin-Yew Lin and Eduard Hovy. 2000. The automated acquisition of topic signatures for text summarization. In Proceedings of the 18th conference on Computational linguistics, pages 495–501, Morristown, NJ, USA. Association for Computational Linguistics. Rada Mihalcea. 2005. Language independent extractive summarization. In Proceedings of ACL 2005, Ann Arbor, MI, USA. Dianne P. O’Leary and et al. In preparation. An interval bounded nonnegative matrix factorization. Technical report.
63