Multimedia at Work
Editors: Tiziana Catarci and Thomas D.C. Little
Evaluating Web Page Color and Layout Adaptations David C. Brown, Esteban Burbano, and Joel Minski Worcester Polytechnic Institute
Isabel F. Cruz University of Illinois at Chicago
A
n adaptive Web site molds itself to the user, creating a unique interaction, providing a more enjoyable experience, and increasing the success of an interaction.1 We studied the effect of Web page adaptations on information-finding tasks.2 Although many user interface components, such as page content and Web links, can be altered to produce adaptations, we limited our work exclusively to altering color and layout. The hypothesis we studied in our research was that these adaptations would let users complete tasks in a shorter time and that this effect would occur whether the adaptations were used individually or together. We designed a Web-based experiment that required each subject to answer three questions. The subjects could find the answer for each by searching through a local copy of a portion of IBM’s 2000 Sydney Olympics Web site. Our experiments involved 128 student participants from WPI. To focus on the effects of the adaptations, we used predetermined adaptations, creating a set of static Web sites containing all the adaptations we planned to study. To reduce the potential effects of learning and to compensate for adaptation order, we kept the experiment brief and used a balanced experimental design. Statistical analysis suggests that there’s significant support from the experimental data for the hypothesis.
System design and implementation When an interface uses well-known content and relationships, users tend to anticipate what the site will offer and concentrate on the experimental task. The 2000 Sydney Olympics Web site appealed to us for that reason and several others: ❚ an experienced group of IBM developers developed it, ❚ it uses easy-to-understand language,
2
1070-986X/02/$17.00 © 2002 IEEE
❚ its content is nontechnical, ❚ its content is recognizable, and ❚ it is well structured as a wide tree of nodes.3 The interface for our experiment presents the user with a set of tasks to complete. We used several static Web page hierarchies that represent the results of the possible adaptations, their combinations, as well as no adaptation. The interface design has two frames. The upper one contains a question that defines the current task and a set of possible answers. In the lower frame, the subject can traverse a local partial copy of the Olympics site to locate the answer.
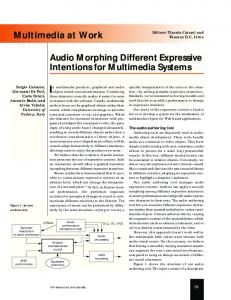
Experiment design Color adaptations are easy to implement, and important for conveying information such as order, grouping, and magnitude. Page layout adaptations, while not as easily implemented, can make specific information more accessible to the user. Both types of adaptations can emphasize importance and order when dealing with large amounts of information. Layout and color adaptations have the advantage that designers can use them alone or together. Figure 1 shows a sample Web page with both adaptations. In contrast to a page without adaptations, the countries are alphabetically sorted (layout) and color coded to match the continents on the map (color). Experiments must account for variation by testing a substantial number of subjects. Our Web-based approach let subjects visit our experiment from anywhere and at anytime. This helped to increase the sample size and let us keep accurate records and measurements online. Web-based experiments also allow large samples that can differ demographically from the usual, available subjects.4
We reduced the effects of learning in our experiment by limiting subjects’ interaction with the system. Each subject only had three tasks, which kept their completion time to about nine minutes. Four stages User interaction with our system consisted of four stages. First, an experiment briefing gave the subjects the overall details they needed to know before starting the experiment. This included what the site is about and the preferred browser. In the second stage, we provided a tutorial to help speed up initial use. The tutorial included a sample screen capture from an actual exper- Figure 1. A sample Web page with both layout and color adaptations. iment with the important interface elements labeled. Next, the subjects completed a demographics tasks so that finding the answers could be form, recording their age, college major, user enhanced by some adaptation. name, citizenship, Internet experience, and Olympic knowledge. Experiment’s form In the fourth and final stage (the experiment), Each question was associated with a different the subjects searched the Olympics site in the adaptation of the Web site. For each question, the lower frame to find the answer for each question. subjects saw either no adaptation (N), a color We recorded every link-click as well as the time adaptation (C), a layout adaptation (L), or a comfrom question-prompt to question-finish. bination of both color and layout adaptations (B). Here is a sample question for use with the layThe dependent variables were the mean overout and color adaptation: In the men’s marathon, all task time and the mean number of mouse what was Kenya’s position in relationship to that clicks, while the independent variable was adapof Ethiopia? The answer choices were Same, Bet- tation. Each subject was exposed to one of four ter, In between, and Worse. In between was the paths between N and B—that is, BCN, BLN, NCB, correct answer. or NLB. Dynamically at the time of browser use, Once the subjects finished their last task, we we randomly assigned subjects into one of the thanked them for their time and informed them four groups that corresponds to these four paths. that the information had been saved. Saving the This counterbalancing approach compensates for statistical information at this point prevented the potential effects of presentation order.5 recording any incomplete data for a user.
Results One hundred and twenty-eight subjects participated in the experiment. From the demographics forms, we know that all the subjects were between 18 and 23 years old. We also know that 73 percent of the subjects were computer science students; 58 percent were intermediate Internet users, 38 percent experts, and 3 percent beginners; and 57 percent had beginning Olympics knowledge, 30 percent intermediate, and 9 percent expert knowledge. As for Internet experience, the more knowledgeable users in this field might have had an advantage, allowing faster task completion. We
January–March 2002
Web site modifications The 2000 Sydney Olympics Web site that we used had to be modified to reduce its complexity. We aimed for a broad, shallow tree to reduce the chance of users becoming lost or disoriented and to ensure better productivity.3 To reduce user learning effects, we selected tasks so that the answer to each question was located in a distinctly different area of the Web site. In addition, tasks had to be challenging for the users and require them to actually browse to answer correctly. It was also important to select
3
Multimedia at Work
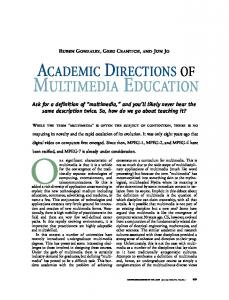
Figure 2. Mean overall task time for B, C, and N.
68.26563
70
Time (seconds)
60 50 38.14063
40 30
24.26563
20 10 0 Both
Color
None
Adaptation
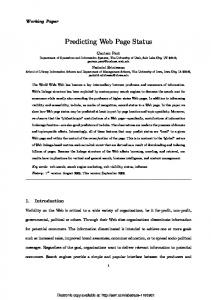
Figure 3. Mean overall task time for B, L, and N.
70
64.125
Time (seconds)
60 46.10938
50 40 30
22.67188
20 10 0 Both
Layout
None
Adaptation
IEEE MultiMedia
made no analysis based on the demographic data. We conducted one analysis of the data for subjects who worked with the Both–Color–None set of adaptations and another for the Both–Layout– None set. A one-way repeated measures analysis of variance was conducted for time and number of clicks. Results were significant at p < 0.0005. These results indicate that significant differences exist between the effects of each adaptation. First, we analyzed the overall effects of the two Both–Color–None groups (BCN and NCB) and how each adaptation affected users’ performance with respect to time (see Figure 2). We graphed the adaptation as a function of its mean time value. Sixty-four subjects account for the data. The B adaptation has a reduced task completion time of slightly less than half that of N and is a significant reduction compared to C alone. The p level in this analysis is less than 0.0000001, making these results strongly significant. Analysis of the Both–Layout–None group (BLN and NLB) of 64 subjects also shows how each
4
adaptation affected users’ performance with respect to time (see Figure 3). The B adaptation again correlated with a speedier task completion, being slightly twice as fast as L and nearly three times faster than N. The p level here was less than 0.000006, again greatly significant. We also analyzed the users’ behavior in terms of number of clicks, with similarly significant results. The strongest adaptation continued to be B, yielding half as many clicks as C and nearly one third of the clicks for N. We used a planned-comparisons analysis to identify significant differences between individual adaptations. For the Both–Color–None subjects, B was faster than C with a significance of 0.00038. It was faster than N with a p level of 0. For Both–Layout–None, B was faster than L with a p level of 0.0017, and was better than N with a p level of 0.00011. Because we didn’t expose any users to both C and L adaptations alone, it would have been inaccurate to compare these adaptations since the data we used didn’t correspond to the same context or users. However, we can see in the graphs that the color adaptation generated faster task completion than the layout adaptation. However, this might have been caused by the complexity of the tasks or the degree of adaptation used.
Conclusion The results from our study support the hypothesis that adaptations let users complete tasks in a shorter time and that this effect occurs whether we use the adaptations individually or together. Users achieved their task goals faster when adaptations were present. Color or layout adaptations by themselves reduced average times and number of clicks compared to when there was no adaptation. Even faster task completion occurred when we combined color and layout adaptations. Our study suggests that changes in color or layout tend to be more effective when the previous task was completed with no adaptation. Future studies should categorize both layout and color adaptations and more systematically vary them in experimental situations, correlating the results with the type of task and with user preferences and characteristics. In addition, these adaptation categories should be matched with techniques for accomplishing the adaptations dynamically. Our results extend basic human–computer interaction results and place them in the context of adaptive systems. They strongly suggest that in
addition to the larger scale adaptations currently being experimented with,1 there’s an important role for small-scale adaptations in the development of effective and efficient adaptive Web sites. MM
Acknowledgment Isabel Cruz’s research work, performed in part at WPI, was supported in part by the Advanced Research and Development Activity and the National Imagery and Mapping Agency (NIMA) under Award Number NMA201-01-1-2001, and by the National Science Foundation under Award EIA-0091489. The views and conclusions in this article are those of the authors and shouldn’t be interpreted as necessarily representing the official policies or endorsements, either expressed or implied, of NIMA or the US Government.
References 1. P. Brusilovsky, “Methods and Techniques of Adaptive Hypermedia,” Adaptive Hypertext and Hypermedia, P. Brusilovsky, A. Kobsa, and J. Vassileva, eds., Kluwer, New York, 1998, pp. 1-43. 2. E. Burbano and J. Minski, Qualitative Analysis of Web Site Color and Layout Adaptations, Major Qualifying Project, Computer Science Dept., WPI, Worcester, Mass., Apr. 2001, http://www.cs.wpi.edu/~dcb/ MQPs/MinskiBurbano/. 3. B. Shneiderman, Strategies for Effective Human–Computer Interaction, 3rd ed., Addison Wesley Longman, Reading, Mass., 1998. 4. M.H. Birnbaum, ed. Psychological Experiments on the Internet, Academic Press, San Diego, 2000. 5. G. Keppel, W.H. Saufley, and H. Tokunaga, Introduction to Design and Analysis, 2nd ed., W.H. Freeman & Co., New York, 1992.
January–March 2002
Readers may contact David Brown at Worcester Polytechnic Inst., Computer Science Dept., Worcester, MA 01609, email
[email protected]. Readers may contact Multimedia at Work editors Tiziana Catarci at the Dept. Information Systems, Univ. of Rome “La Sapienza,” Via Salara 113, 00198 Rome, Italy, email
[email protected], and Thomas Little at the Multimedia Communications Lab, Dept. of Electrical Eng., Boston Univ., 8 Saint Mary’s St., Boston, MA 02215, email
[email protected].
5